This example uses a plugin from XFdtd’s XTend Library to perform two Particle Swarm Optimizations (PSO) on an E-shaped patch. The first investigation focuses on a dual band configuration resonating at 1.8 and 2.4 GHz while the second search maximizes performance over the entire frequency range from 1.8 to 2.4 GHz.
PSO is a global optimization technique inspired by swarm behavior found naturally in schools of fish, flocks of birds, and swarms of insects. A number of particles comprising a swarm are distributed throughout the N-dimensional solution space. An evolutionary process ensues where each particle evaluates the fitness of its current location and moves on to a new location based on the best result seen by that particular particle and the best result seen by the overall swarm. Over a number of generations, the solution space is explored and an optimal solution is reached.
The fitness function for this particular optimization simply evaluates the linear return loss of the antenna over the band of interest and sets the fitness level to be the worst return loss encountered. In the case of the dual band optimization, this concept is extended such that the fitness value is the worst return loss seen in either band. One advantage of this approach is that the minimum in-band performance is known at every generation. The user can monitor the current fitness value and terminate if a desired target level is reached. Six principle variables impact the characteristics of the E-shaped patch as can be observed in Figure 1. These parameters are permitted to vary according to Table 1. Since some of the variables are dependent on one another, XTend’s PSO plugin uses a dynamic constraint system to update parameter bounds throughout the optimization. Table 2 details the dynamic constraints. The same set of bounds and constraints are used for both investigations.
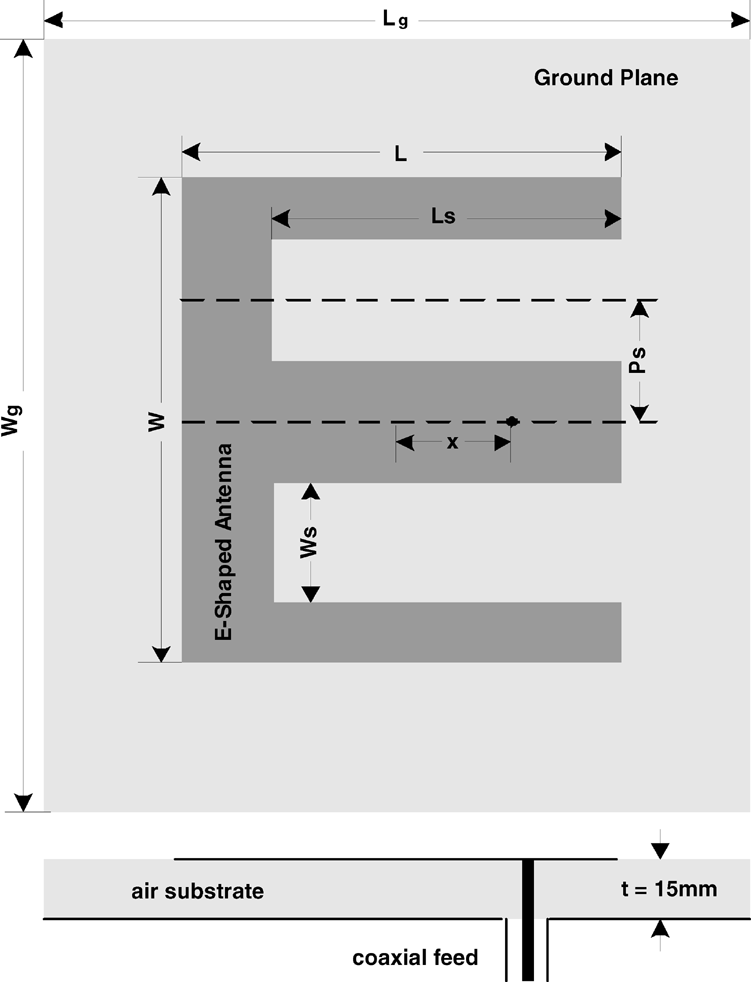
Figure 1: Schematic of E-shaped patch.
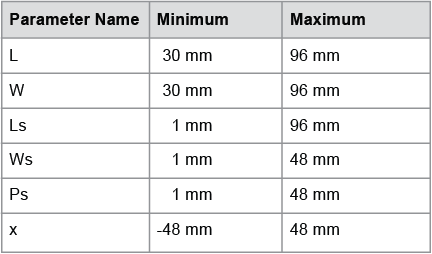
Table 1
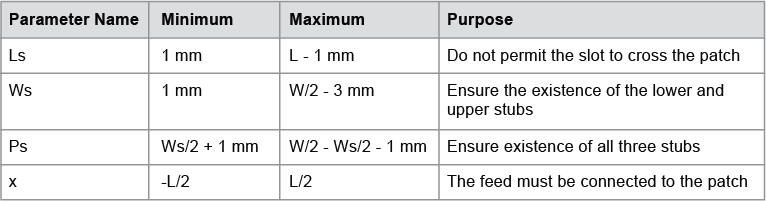
Table 2
XStream, XFdtd’s CUDA-accelerated implementation of FDTD, is pivotal in the timely execution of the PSO. Each particle generates a new XF simulation for each successive generation. These simulations are distributed across the available CUDA-capable GPUs in the system. The particular system used here contains six NVIDIA Tesla C2070’s. The PSO assigns one simulation to each GPU, permitting six simulations to be solved simultaneously. To maximize the utility of the GPUs, the number of particles is chosen to be an integer multiple of the number of GPUs. Twelve particles and 600 generations were chosen for these optimizations. The dual band antenna clearly converged early, so the process was terminated after 450 generations.
The 12 simulations of each generation completed in an averaged total time of 5 minutes 45 seconds. The convergence of the swarm on the optimal solution for each configuration can be seen in Figures 2 and 3. The investigations could be terminated after reaching a fitness level of 0.3 if our goal is to create an antenna with at least -10 dB return loss over our band(s) of interest. The dual band setup passes this milestone after just 10 generations while the wideband version sees it around 180 generations. Figures 4 and 5 demonstrate the progression of the optimizations by examining the return loss achieved at several milestone points including the final optimal solutions. The parameters associated with the dual band solution are listed in Table 3, and the wideband parameters are in Table 4.
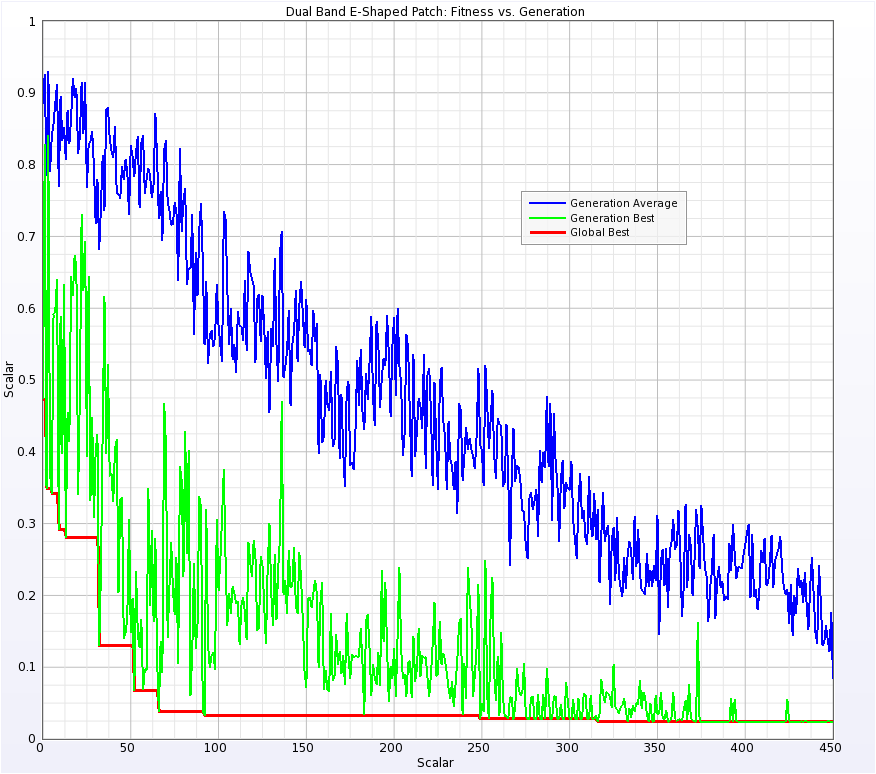
Figure 2: Convergence of the swarm on the optimal answer for the dual band configuration.
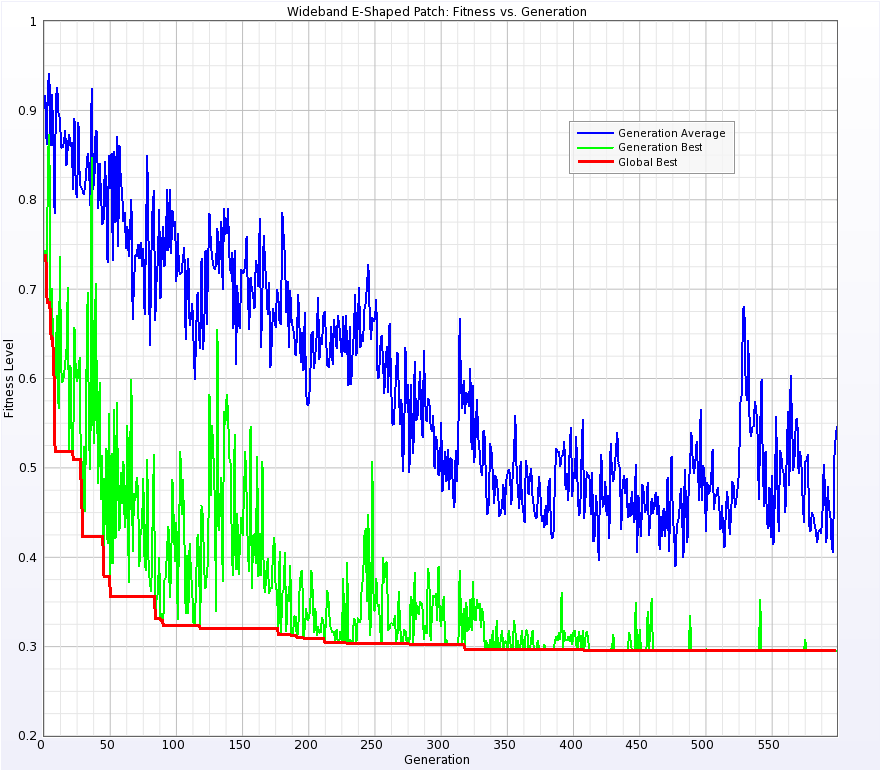
Figure 3: Convergence of the swarm on the optimal answer for the wideband configuration.
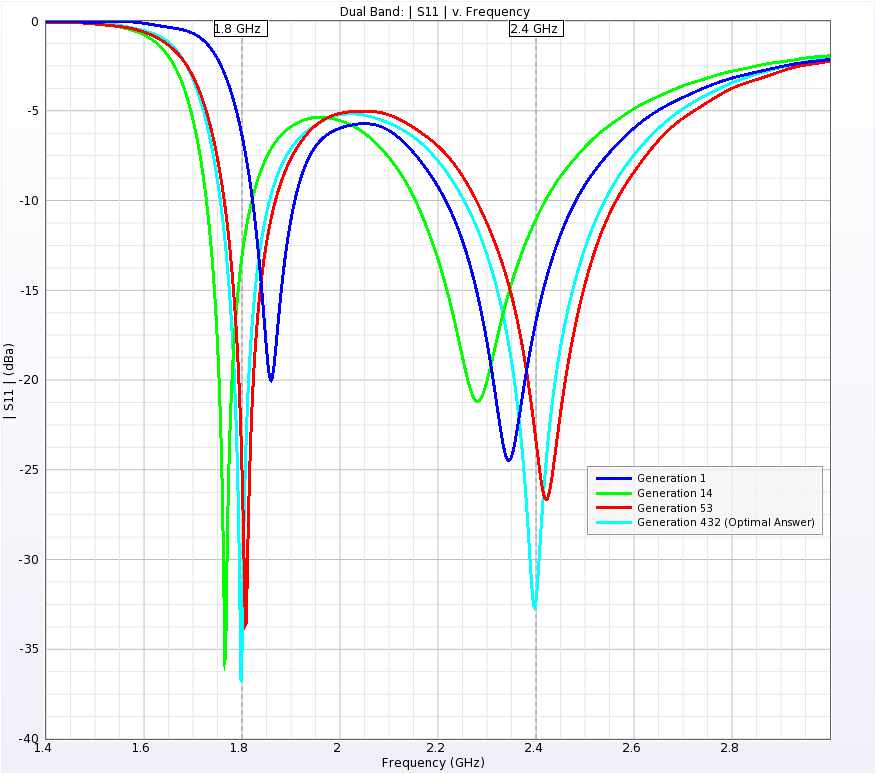
Figure 4: Snapshots of the dual band patch's return loss at several milestone points.
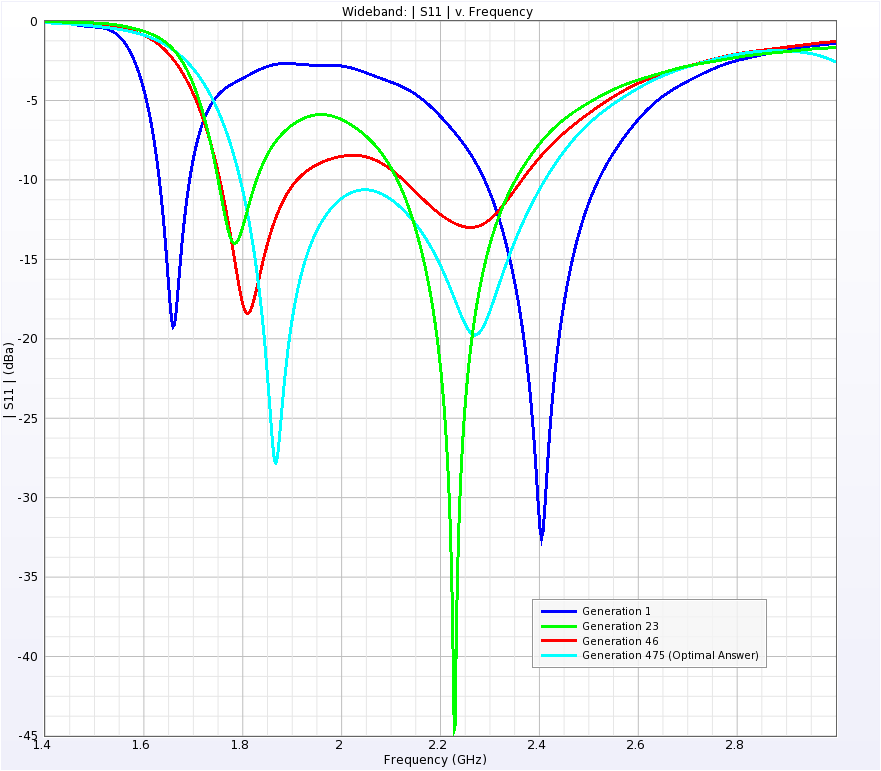
Figure 5: Snapshots of the wideband patch's return loss at several milestone points.
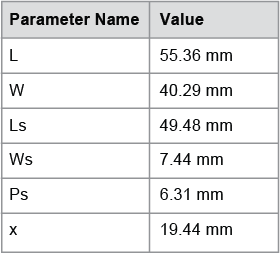
Table 3