This example illustrates the ability of Wireless InSite to provide fully three-dimensional propagation predictions over irregular terrain.
Figure 1 shows a 3D orthographic view of terrain near Golden, Colorado. The terrain was read from USGS digital terrain data. The vertical display is scaled by a factor of 2 relative to the horizontal scales. The terrain shows covers an area of approximately 3.3 x 4.1 km.
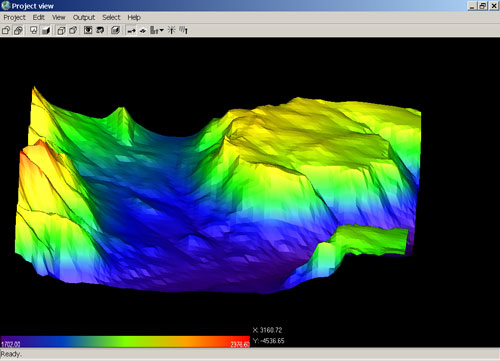
Figure 1
After reading in the USGS data, Wireless InSite was used to locate several transmitting and receiving antennas on the terrain. The antennas are vertically polarized isotropic antennas located 15 meters above the local terrain. The transmitter antenna locations are shown as green boxes and the receiving antenna locations as red boxes in Figure 2. Using the Wireless InSite full 3D ray model with 1 diffraction and up to 6 reflections, and allowing rays with low amplitudes to be included in the calculation, calculations are made for all transmitter/receiver combinations at 1 GHz. This took several hours due to the large number of terrain facets.
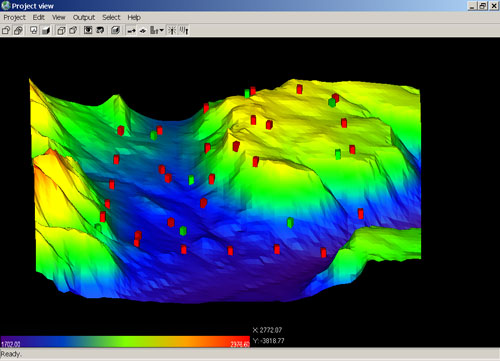
Figure 2
After the calculations are completed the user can display the rays between any transmitter-receiver pair. Figure 3 shows the 30 rays found between Transmitting antenna number 4 and Receiving antenna number 3.
Another view of these rays after zooming in is shown in Figure 4.
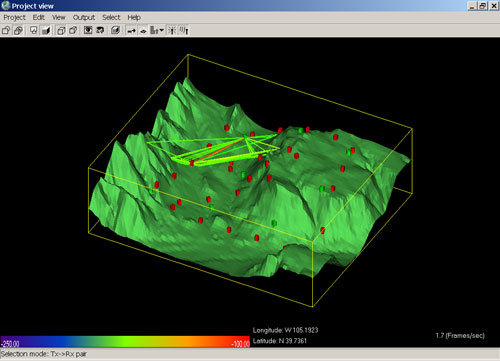
Figure 3
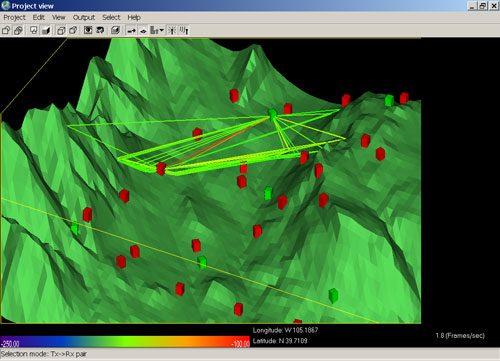
Figure 4
Wireless InSite provides a variety of output including path loss, electric field magnitudes, and path delay. For these long paths with extensive multipath the time delays for the various rays may be of interest. Wireless InSite provides impulse response for each transmitter-receiver pair showing the relative power in each ray and time delay. For the ray paths shown in Figures 3 and 4 the impulse response is shown in Figure 5 for 1 GHz.
Figure 5
Wireless InSite saves ray paths so that the effects of changing parameters that do not change ray paths are quickly calculated. For example, making a new calculation for the same terrain and transmitter/receiver antenna locations but at 100 MHz instead of 1 GHz takes just a few seconds. The corresponding impulse response for the same pair of antennas but at 100 MHz is shown in Figure 6. As expected, the multipath rays with longer delays have relatively higher amplitudes at 100 MHz than for 1 GHz.
Figure 6