The four targets consist of small flat plates that were measured at 5.9 GHz for monostatic RCS at an elevation angle of 10 degrees (above the surface of the plate) and varying azimuth angles. The targets were developed by NASA and published in [1]. The measured results used in this example were extracted from the later publication [2].
The shapes were chosen based on various factors considered difficult for simulation software. The shapes are a “business card” which is a 2 x 3.5 wavelength rectangular plate; a “wedge cylinder” which has a triangular edge and a semi-circular edge joined together; a “plate cylinder” which is a combination of the business card with the semi-circular edge of the wedge cylinder; and a “wedge plate cylinder” which is a combination of the various shapes. Figures of the four shapes are shown in Figures 1 – 4. [Note: more detailed explanations of each of the figures used in this example can be found below.] For the sake of the simulations, the plates were considered to have a thickness of 41 mils and were perfectly conducting.

Figure 1: The Business Card geometry.
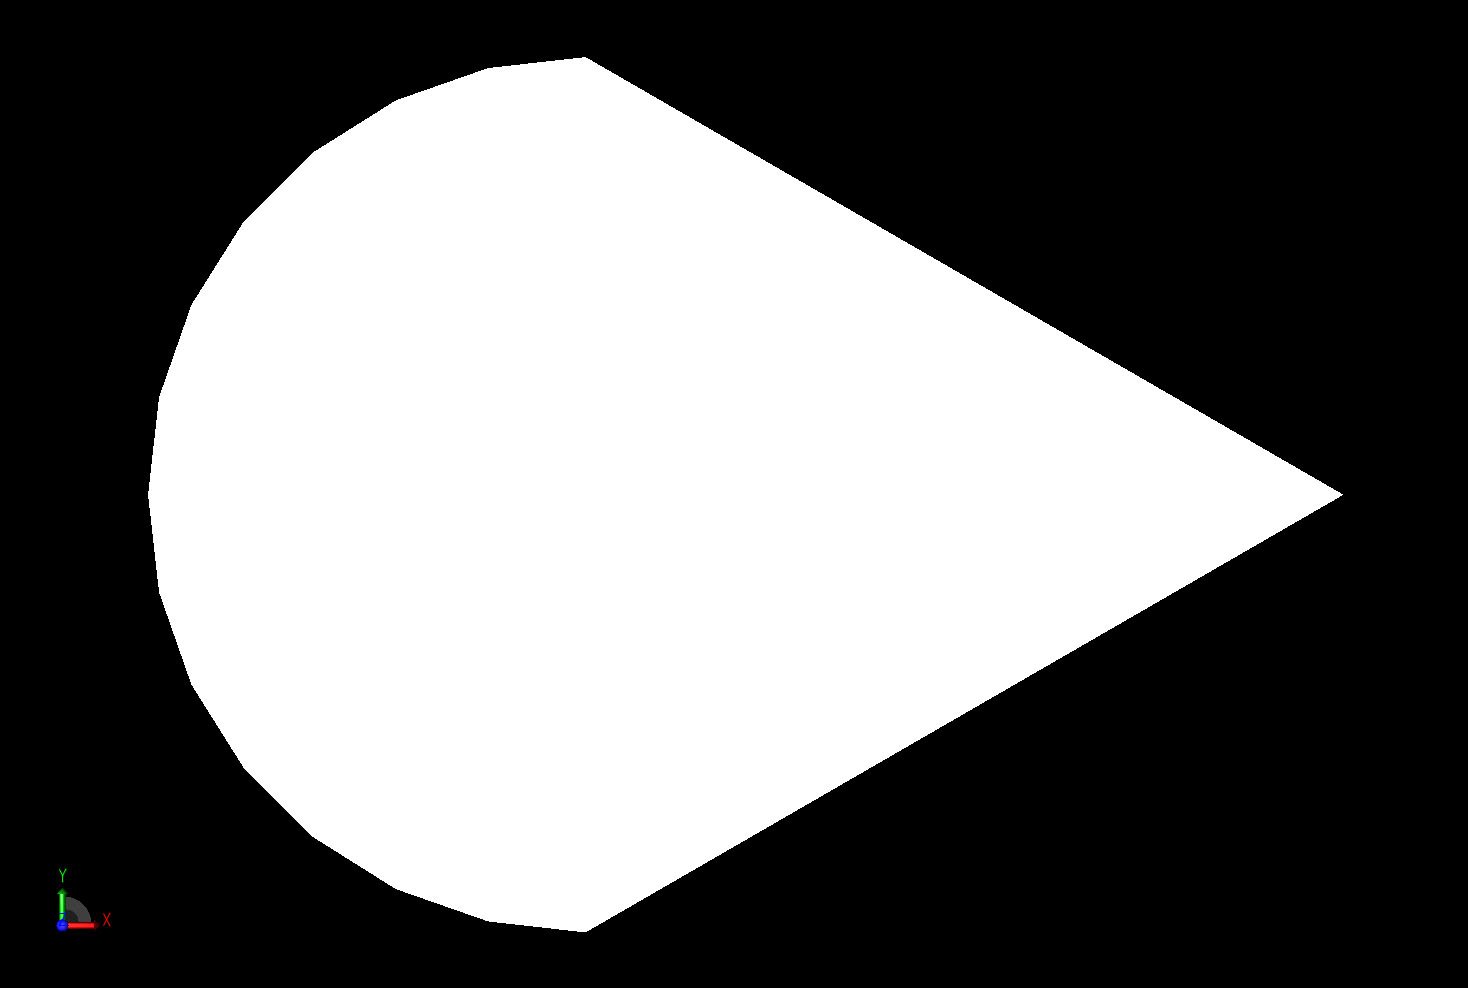
Figure 2: The Wedge Cylinder geometry.
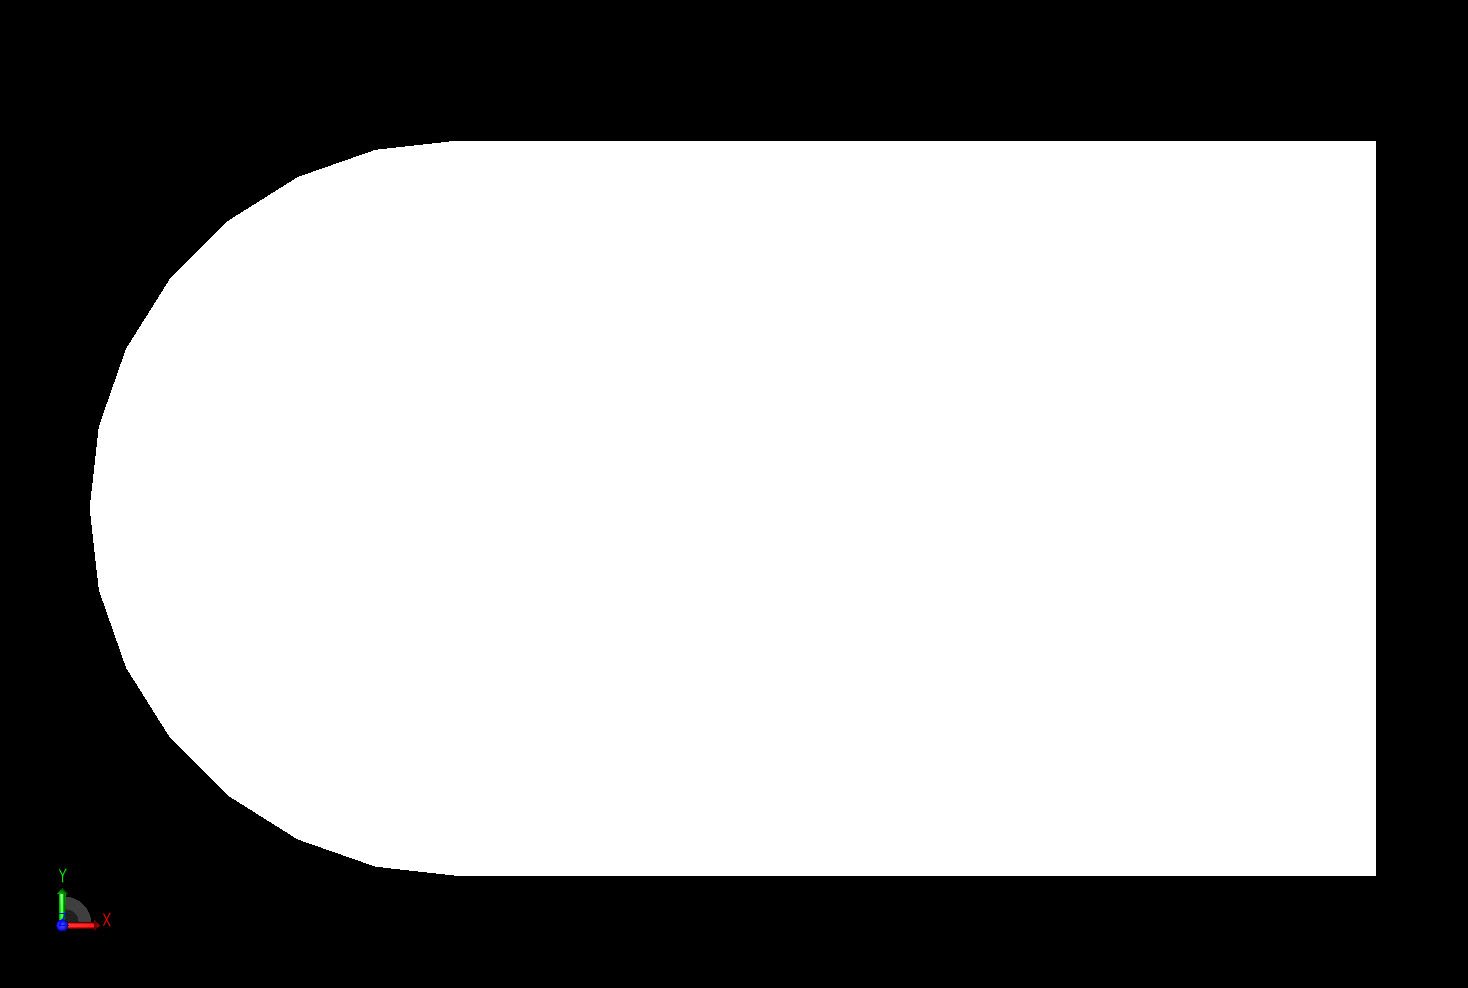
Figure 3: The Plate Cylinder geometry.
Figure 4: The Wedge Plate Cylinder geometry.
The simulations were performed using XFdtd with the XACT meshing feature used for all targets except the “business card.” The software used a mesh size equivalent to 20 cells per wavelength at the target frequency (5.9 GHz) for all simulations and the fixed points feature was employed for all geometries. In some cases good results were possible with a lower resolution, but for consistency all results are shown in the same resolution. To better illustrate the fidelity of the simulation, a view of the mesh is shown in Figure 5 for the Wedge Plate Cylinder geometry.
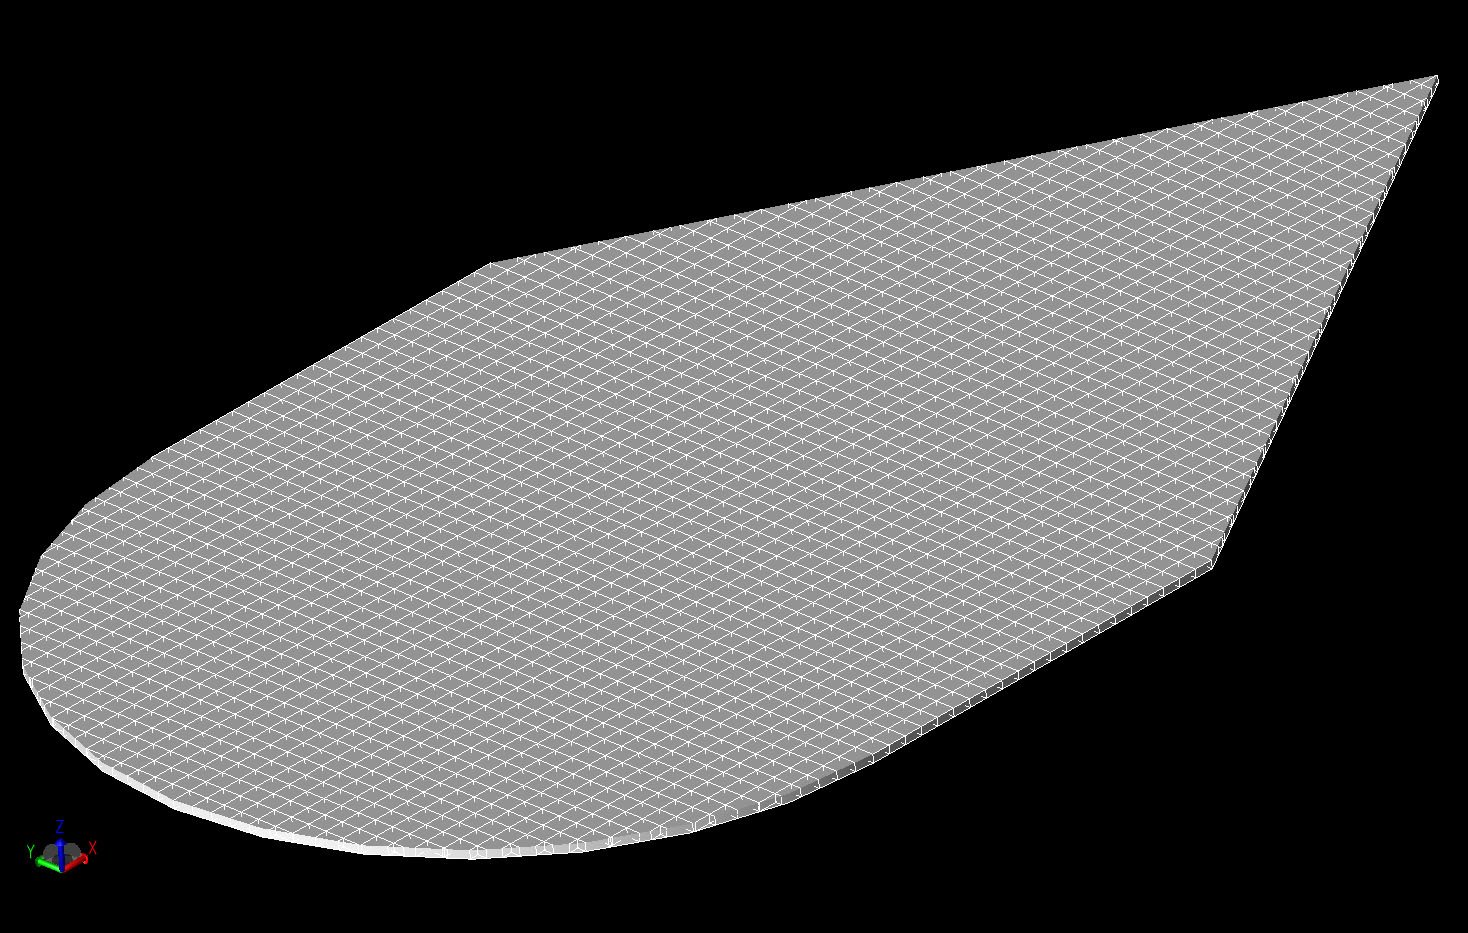
Figure 5: A three dimensional view of the Wedge Plate Cylinder geometry mesh.
The simulations used an incident plane wave with a sinusoidal source and data was collected using a steady-state far zone transform. This combination was shown to give the most rapid results for this single-frequency analysis. Due to the results required in a backscatter RCS situation, each simulation produced a single data point for the file output graph.
The XStream GPU solution was used to perform all simulations to provide the quickest results. A single value parameter sweep was performed with the incident phi direction (azimuth angle) used as the parameter in increments of one degree. The output was processed with a custom script written to extract the backscatter RCS at each incident angle and plot the results in a single graph. Each incident angle required less than 20 seconds of execution time on an NVIDIA Quadro FX 1600M graphics card.
The Business Card geometry is already aligned with the rectangular FDTD grid, so the use of the XACT meshing capabilities was not required. The geometry is aligned so that 0 degrees azimuth is normally incident on one of the shorter sides of the plate. The simulated results compared to measured results from the referenced publications are shown in Figures 6 and 7 for the vertical and horizontal polarizations, respectively. The results show generally good agreement over all incident angles. The slightly lower simulated RCS values for the middle of the vertical polarization graph mirrored the simulated results presented by the authors of the referenced publications as well.
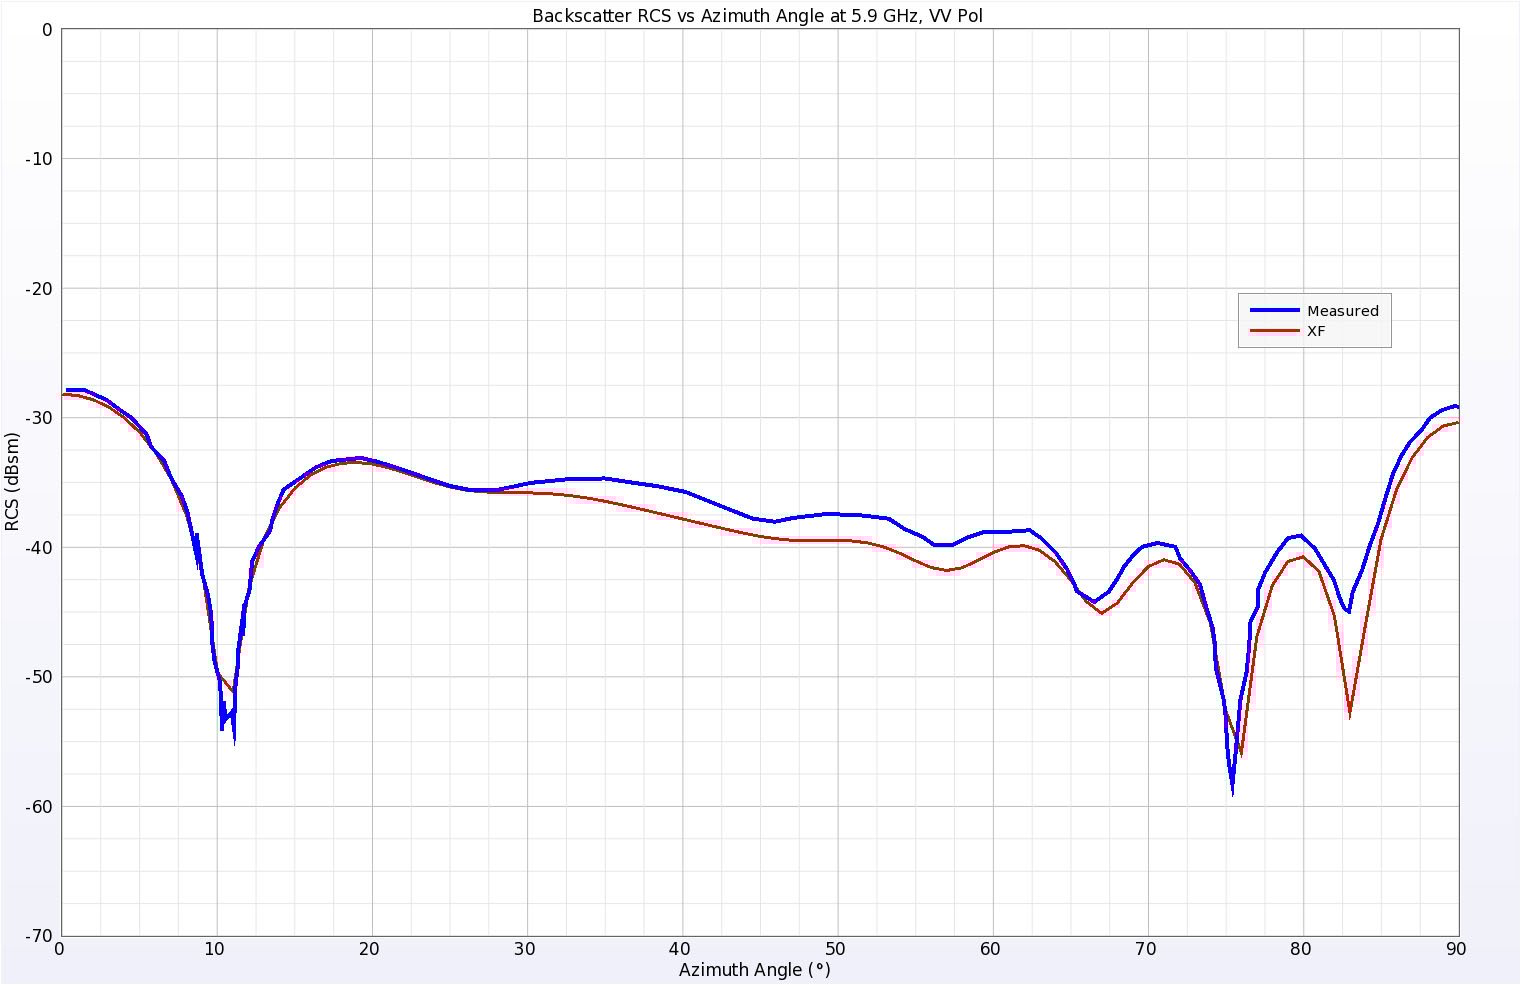
Figure 6: Simulated and Measured backscatter RCS results for the Business Card at 5.9 GHz, vertical polarization.
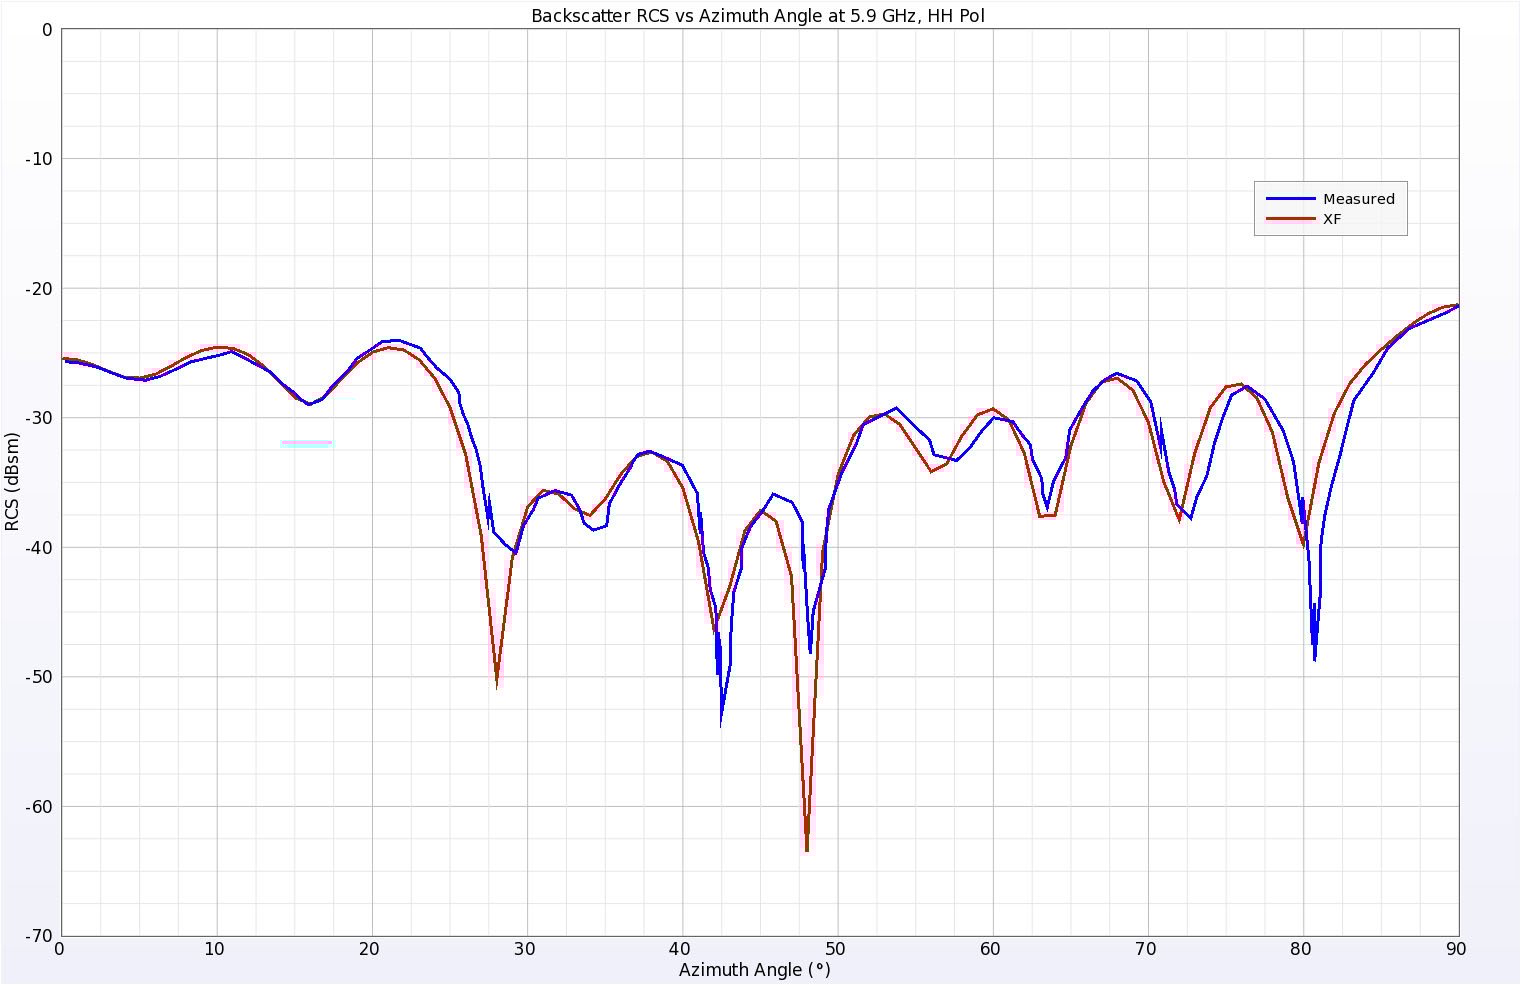
Figure 7: Simulated and Measured backscatter RCS results for the Business Card at 5.9 GHz, horizontal polarization.
The Wedge Cylinder presents a more challenging structure for the FDTD simulation due to the curved surfaces and the sharp point. In the XFdtd simulation, a fixed point was added at the vertex of the wedge to ensure a balanced mesh was created. The RCS results for both polarizations are shown in Figures 8 and 9 with generally good agreement to the published measurements.
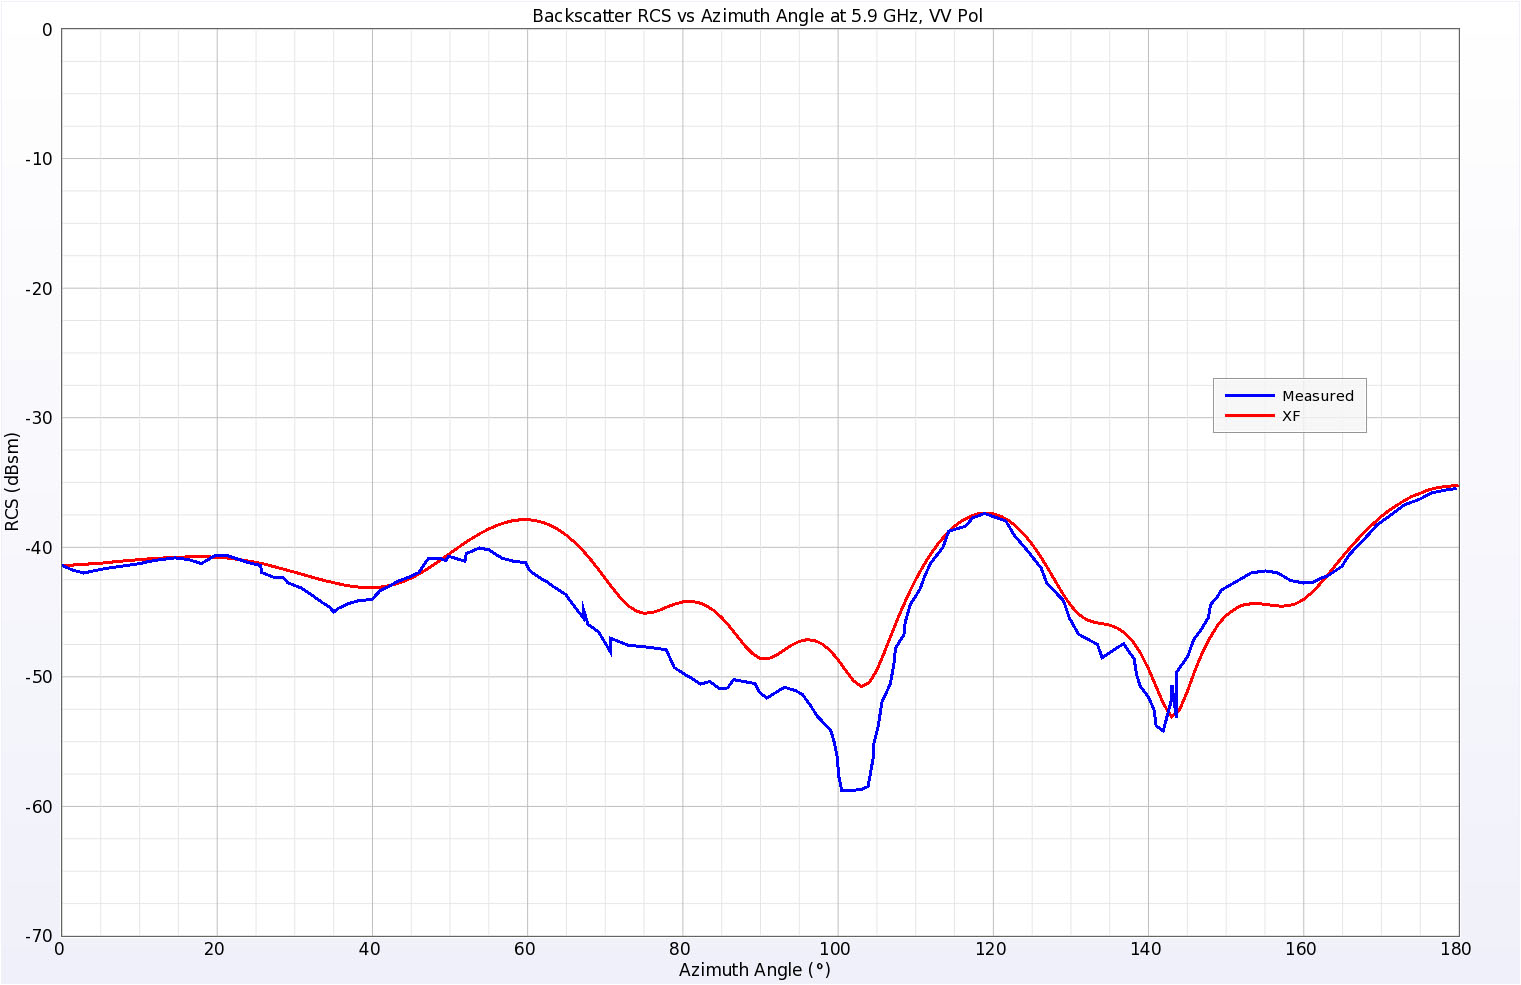
Figure 8: Simulated and Measured backscatter RCS results for the Wedge Cylinder at 5.9 GHz, vertical polarization.
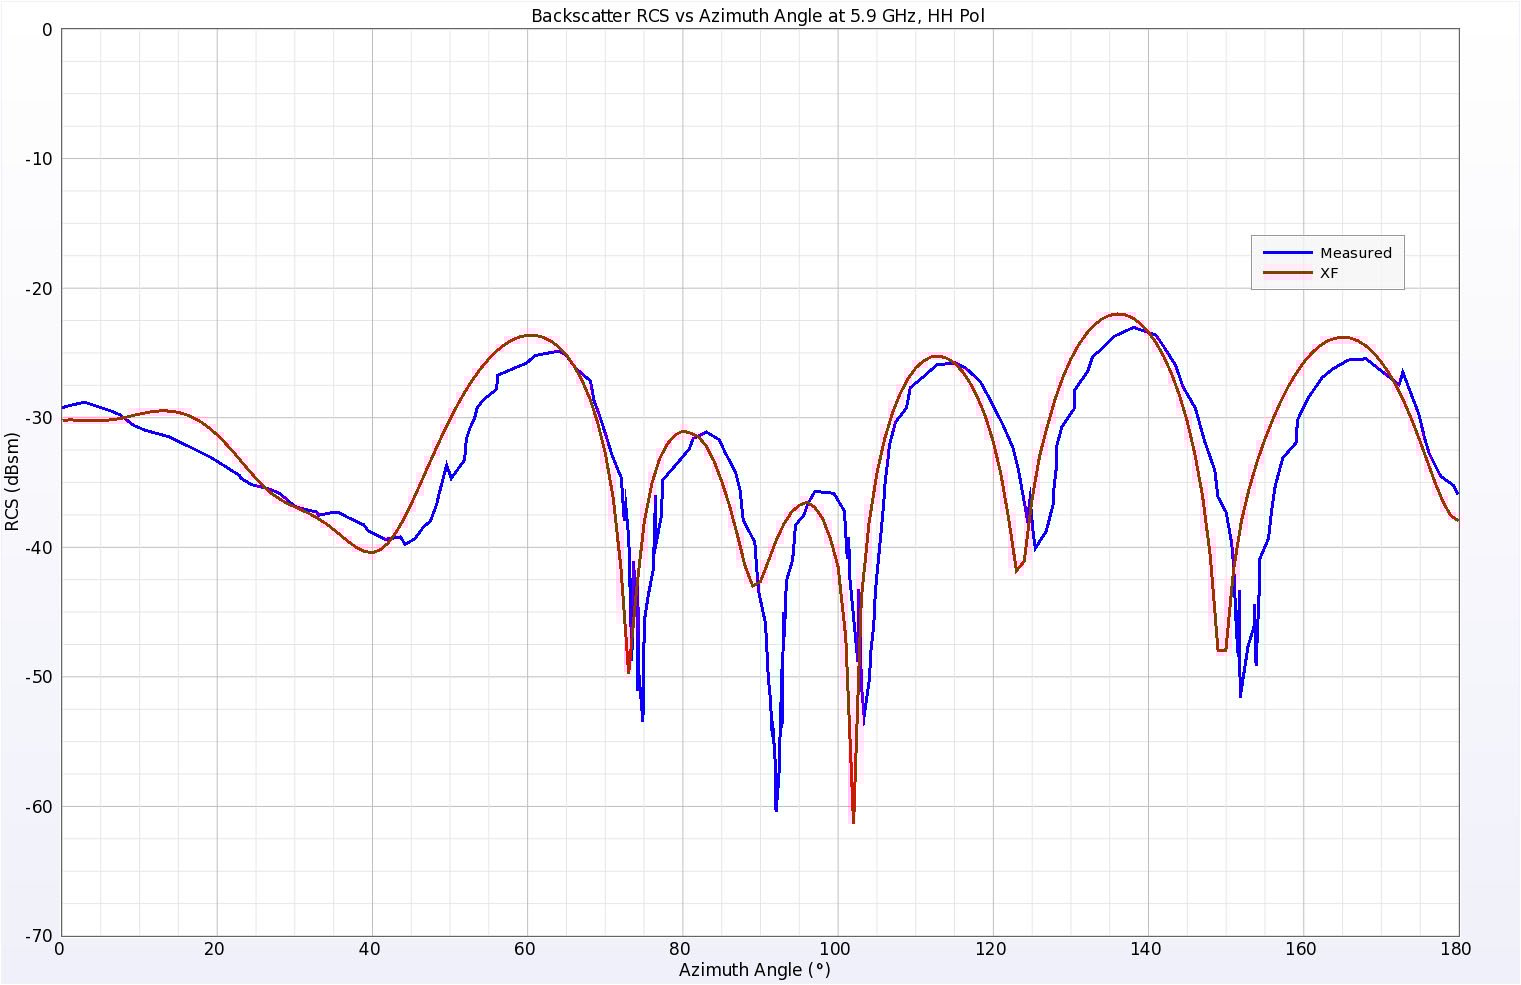
Figure 9: Simulated and Measured backscatter RCS results for the Wedge Cylinder at 5.9 GHz, horizontal polarization.
The Plate Cylinder geometry builds off the business card shape but adds a semi-circular portion on one of the short sides. The simulated results again agree well with the measured results, as can be seen in Figures 10 and 11.
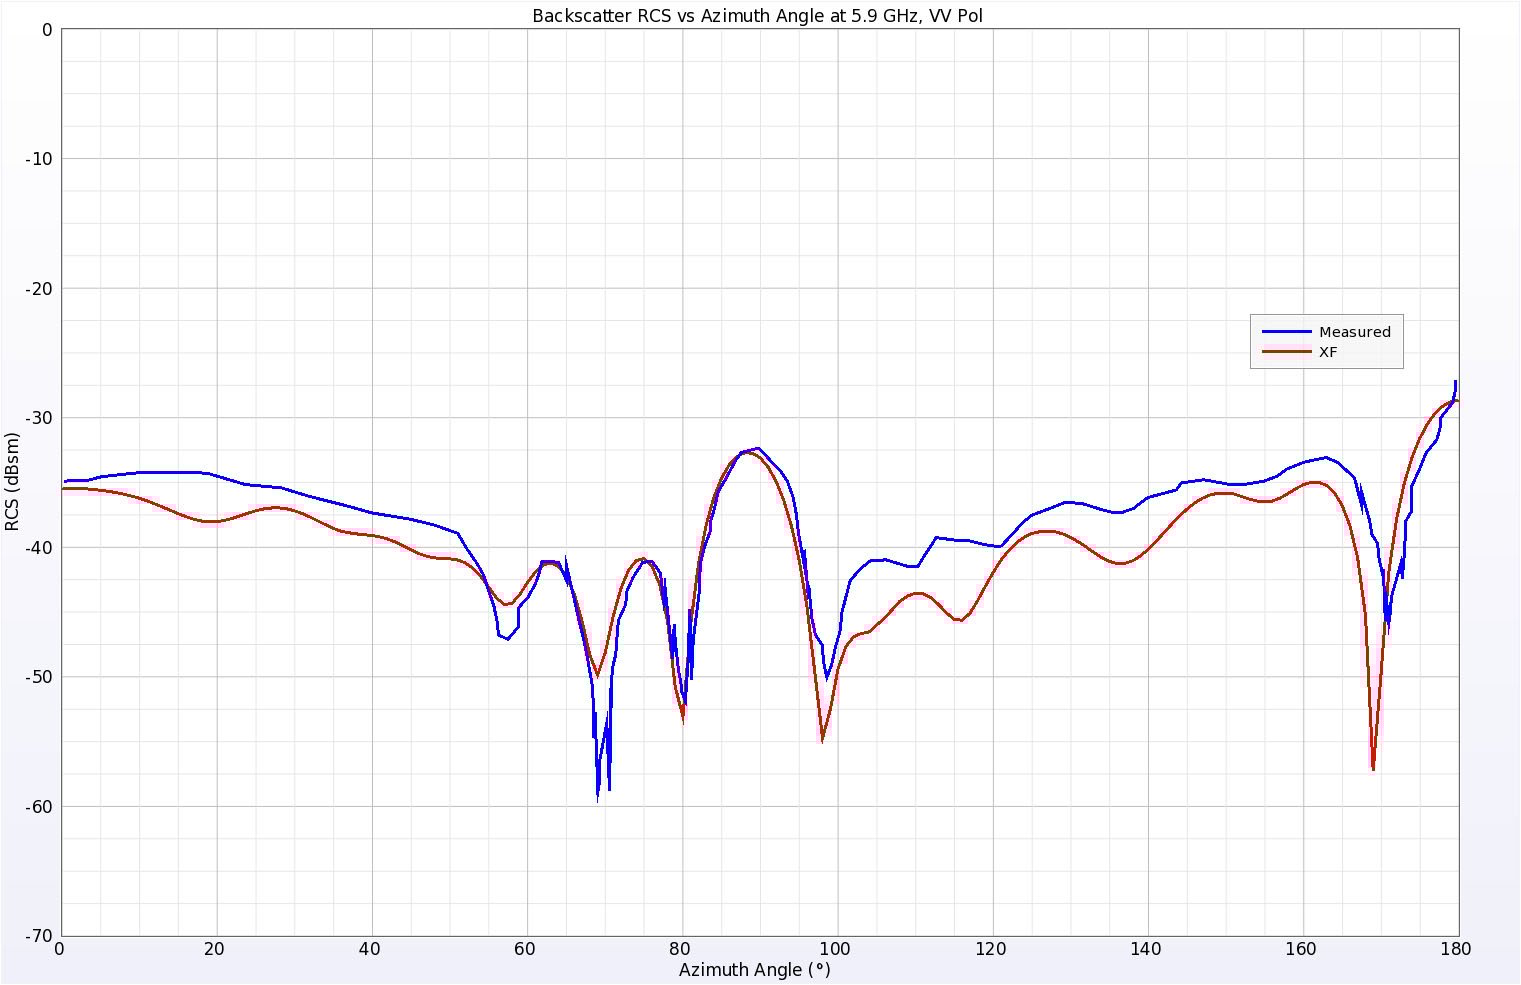
Figure 10: Simulated and Measured backscatter RCS results for the Plate Cylinder at 5.9 GHz, vertical polarization.
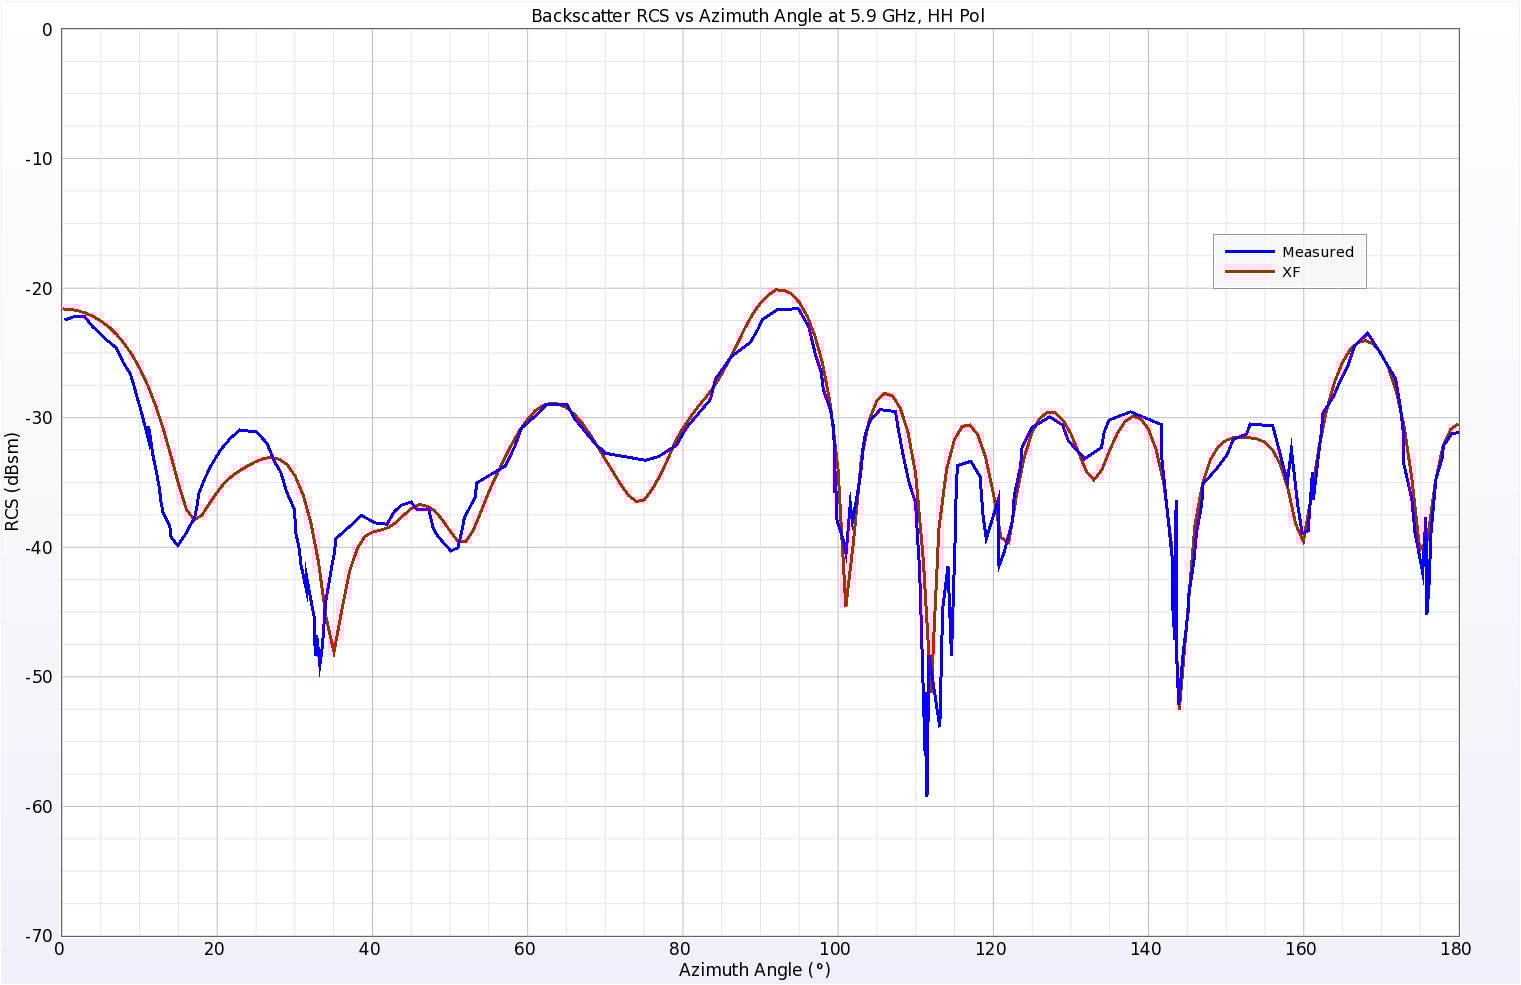
Figure 11: Simulated and Measured backscatter RCS results for the Plate Cylinder at 5.9 GHz, horizontal polarization.
Finally, the Wedge Plate Cylinder geometry combines the three structures with the vertex of the wedge at the 0 degree point and the center of the semi-circle at 180 degrees. The simulated and measured results show good agreement once again as is shown in Figures 12 and 13.
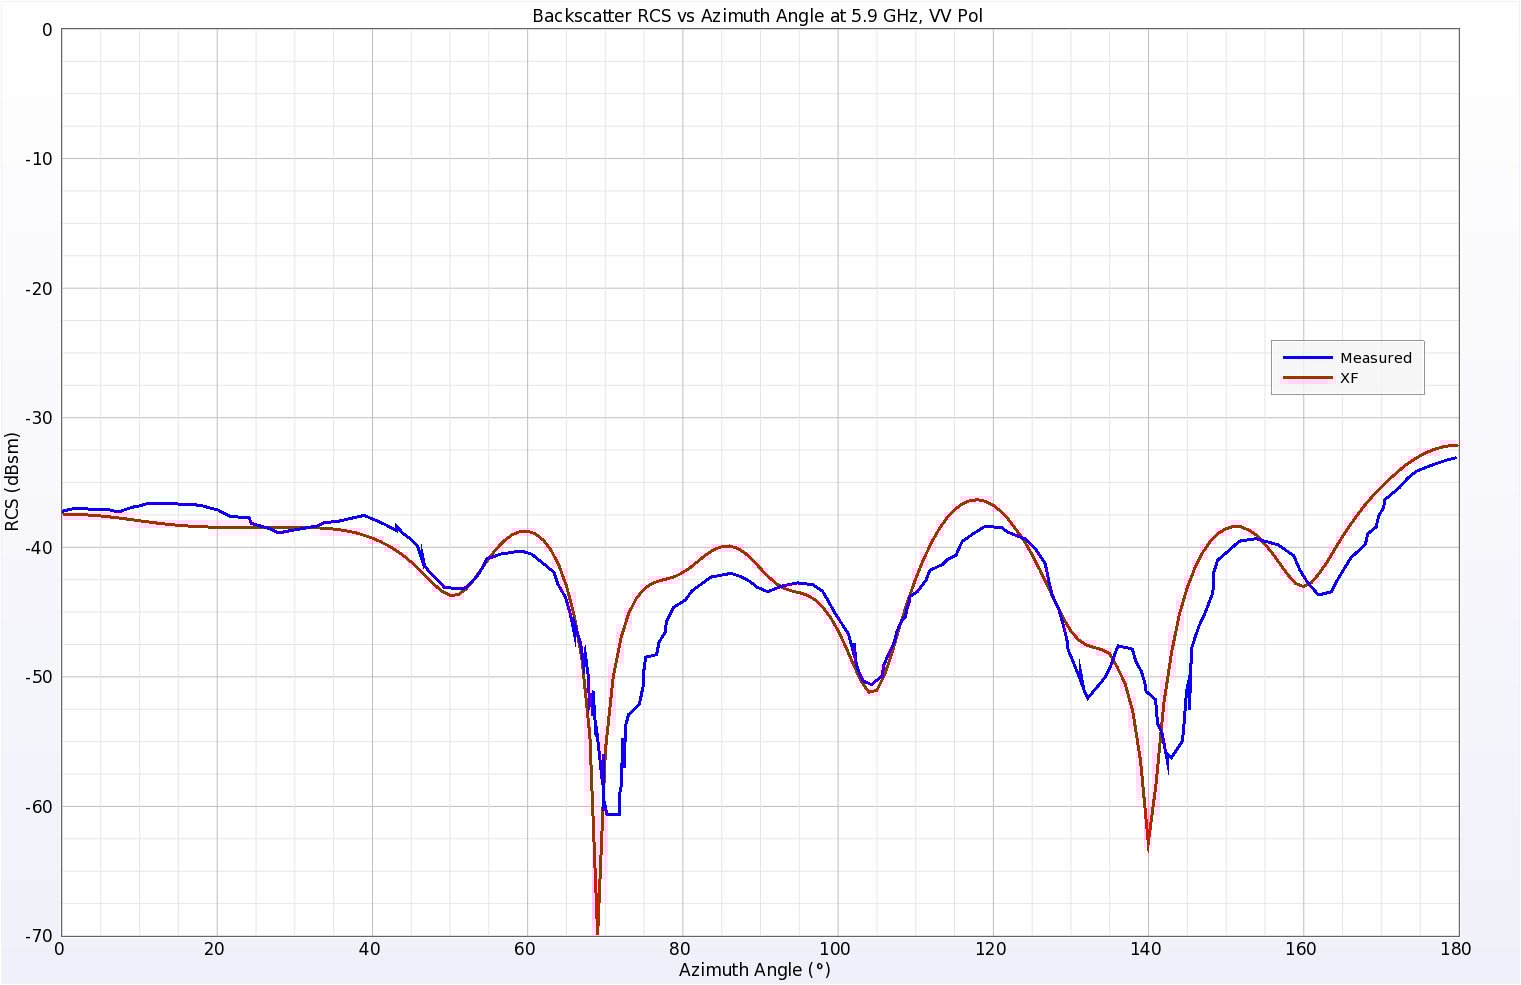
Figure 12: Simulated and Measured backscatter RCS results for the Wedge Plate Cylinder at 5.9 GHz, vertical polarization.
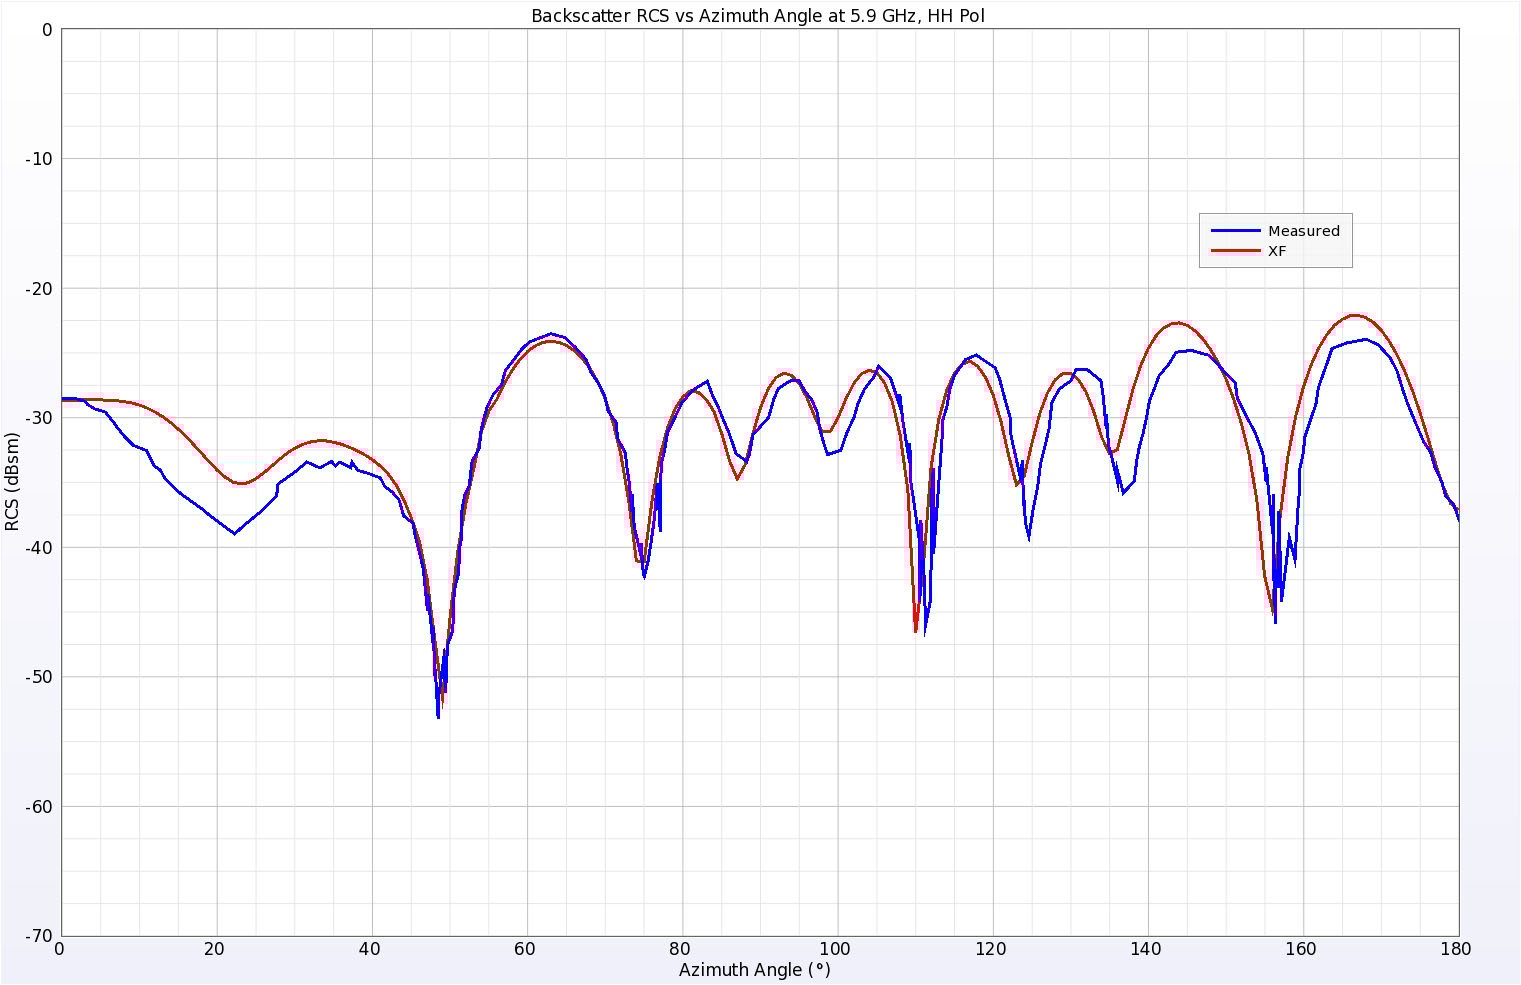
Figure 13: Simulated and Measured backscatter RCS results for the Wedge Plate Cylinder at 5.9 GHz, horizontal polarization.
Explanations of Figures
-
Figure 1: The Business Card geometry: The X length is 3 wavelengths while the Y length is 2 wavelengths (at 5.9 GHz). The thickness is 41 mils.
-
Figure 2: The Wedge Cylinder geometry: The radius of the semi-circle is 1 wavelength while the length of one wedge side is 2 wavelengths (at 5.9 GHz). The angle of the wedge is 60 degrees while the thickness of the plate is 41 mils.
-
Figure 3: The Plate Cylinder geometry: The radius of the semi-circle portion is 1 wavelength while the plate section is 2.5 x 2 wavelengths (at 5.9 GHz). The thickness of the plate is 41 mils.
-
Figure 4: The Wedge Plate Cylinder geometry: The radius of the semi-circle portion is 1 wavelength. The center section is a 1 x 2 wavelength rectangular plate while the wedge section has a side length of 2 wavelengths (at 5.9 GHz). The angle of the wedge is 60 degrees while the plate thickness is 41 mils.
-
Figure 5: A three dimensional view of the Wedge Plate Cylinder geometry mesh shown to illustrate the cell size used for the simulations, the plate thickness, and the XACT meshing capabilities.
-
Figure 6: Simulated and Measured backscatter RCS results for the Business Card at 5.9 GHz, vertical polarization. The elevation angle was 10 degrees above the plane of the plate and the azimuth angle was varied. Zero degrees represents normal incidence on one of the shorter sides of the plate while 90 degrees is normal incidence on a longer side.
-
Figure 7: Simulated and Measured backscatter RCS results for the Business Card at 5.9 GHz, horizontal polarization. The elevation angle was 10 degrees above the plane of the plate and the azimuth angle was varied. Zero degrees represents normal incidence on one of the shorter sides of the plate while 90 degrees is normal incidence on a longer side.
-
Figure 8: Simulated and Measured backscatter RCS results for the Wedge Cylinder at 5.9 GHz, vertical polarization. The elevation angle was 10 degrees above the plane of the plate and the azimuth angle was varied. Zero degrees represents normal incidence on vertex of the wedge.
-
Figure 9: Simulated and Measured backscatter RCS results for the Wedge Cylinder at 5.9 GHz, horizontal polarization. The elevation angle was 10 degrees above the plane of the plate and the azimuth angle was varied. Zero degrees represents normal incidence on vertex of the wedge.
-
Figure 10: Simulated and Measured backscatter RCS results for the Plate Cylinder at 5.9 GHz, vertical polarization. The elevation angle was 10 degrees above the plane of the plate and the azimuth angle was varied. Zero degrees represents normal incidence on the short straight side of the plate, while 180 degrees represents the center of the circular edge.
-
Figure 11: Simulated and Measured backscatter RCS results for the Plate Cylinder at 5.9 GHz, horizontal polarization. The elevation angle was 10 degrees above the plane of the plate and the azimuth angle was varied. Zero degrees represents normal incidence on the short straight side of the plate, while 180 degrees represents the center of the circular edge.
-
Figure 12: Simulated and Measured backscatter RCS results for the Wedge Plate Cylinder at 5.9 GHz, vertical polarization. The elevation angle was 10 degrees above the plane of the plate and the azimuth angle was varied. Zero degrees represents normal incidence on the vertex of the wedge, while 180 degrees represents the center of the circular edge.
-
Figure 13: Simulated and Measured backscatter RCS results for the Wedge Plate Cylinder at 5.9 GHz, horizontal polarization. The elevation angle was 10 degrees above the plane of the plate and the azimuth angle was varied. Zero degrees represents normal incidence on the vertex of the wedge, while 180 degrees represents the center of the circular edge.
References
-
H. T. G. Wang, M. L. Sanders, A. C. Woo, and M. J. Schuh. “Radar Cross Section Measurement Data, Electromagnetic Code Consortium Benchmark Targets.” NWC TM 6985, May 1991.
-
A. C. Woo, H. T.G. Wang, M. J. Schuh, and M. L. Sanders. “Benchmark Plate Radar Targets for the Validation of Computational Electromagnetics Programs.” IEEE Antennas and Propagation Magazine, vol. 34, no. 6, December 1992.