The Rotman Lens Designer (RLD) software is a first-level tool for designing microstrip and stripline Rotman Lenses. The calculations in the tool are based on Geometrical Optics combined with the lens design equations developed by Rotman [1] and others [REF]. The RLD software can rapidly produce a tuned lens design from a set of design parameters but does not consider every possible contributor to performance. One such factor is the curvature of the lens sidewalls. RLD assumes the sidewalls are designed to absorb most of the energy striking them and no significant reflections are produced which might impact performance. The sidewall curvature is a unit-less value internal to the RLD software and is provided to give additional freedom to the user for developing actual lenses for export and fabrication. In reality, there are some effects from those sidewall reflections, and this example will document some of them and provide the reader with some insight to help select reasonable values for this parameter.
A general set of lens design parameters are selected for the example and are kept the same for all cases simulated. The lens has a center frequency of 9.6 GHz and a bandwidth of 1.6 GHz. The scan angle is 40 degrees with output element spacing of 0.46431 wavelengths (separation distance between the output array elements). The lens is constructed as a microstrip on a 0.508 mm thick dielectric with dielectric constant of 3. The number of beam and array ports will be set at three different values to gauge the impact for different lenses. In the first case the lens has 8 beam ports and 8 array ports. Later tests are done with 16x16 and 32x32 lenses. The width of the lens varies from 4.6 wavelengths for the 8x8 lens up to 20.2 wavelengths for the 32x32 lens. For all cases the lens is tuned for good performance in the RLD software and the settings for all parameters are held constant with the exception of the sidewall curvature.
On the top and bottom are dummy ports attached to the sidewalls that are intended to absorb any fields that strike them. The beam ports are numbered 1 to 8 from bottom to top. When the bottom port (Beam 1) is active, it will produce a beam centered at the positive maximum scan angle. A beam near the center, for example Beam 4, will produce a beam that is closer to broadside of the array. The top port (Beam 8) will produce a beam at the negative maximum scan angle. Figure 2 shows the 8 beams produced by the lens of Figure 1 with Beam 1 at the far right and Beam 8 at the far left. Due to the approximations made, the shape of these beams does not vary with the value of the sidewall curvature in the RLD software.
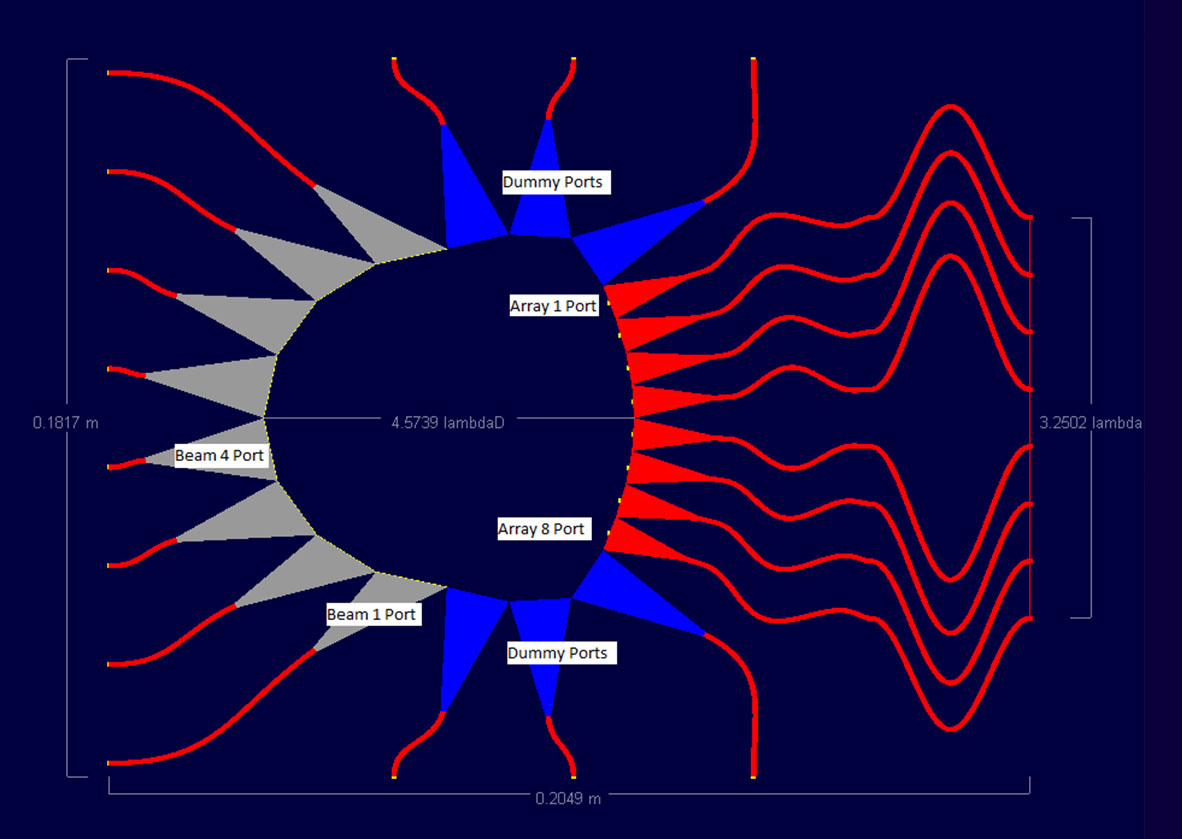
Figure 1: Shown is a basic microstrip lens generated in the RLD software. To the left are the beam (input) ports and to the right are the array (output ports). The port numbering is identified in the figure. The blue ports at the top and bottom are the dummy ports on the sidewalls. This example will vary the curvature of the sidewall while holding other lens parameters fixed.
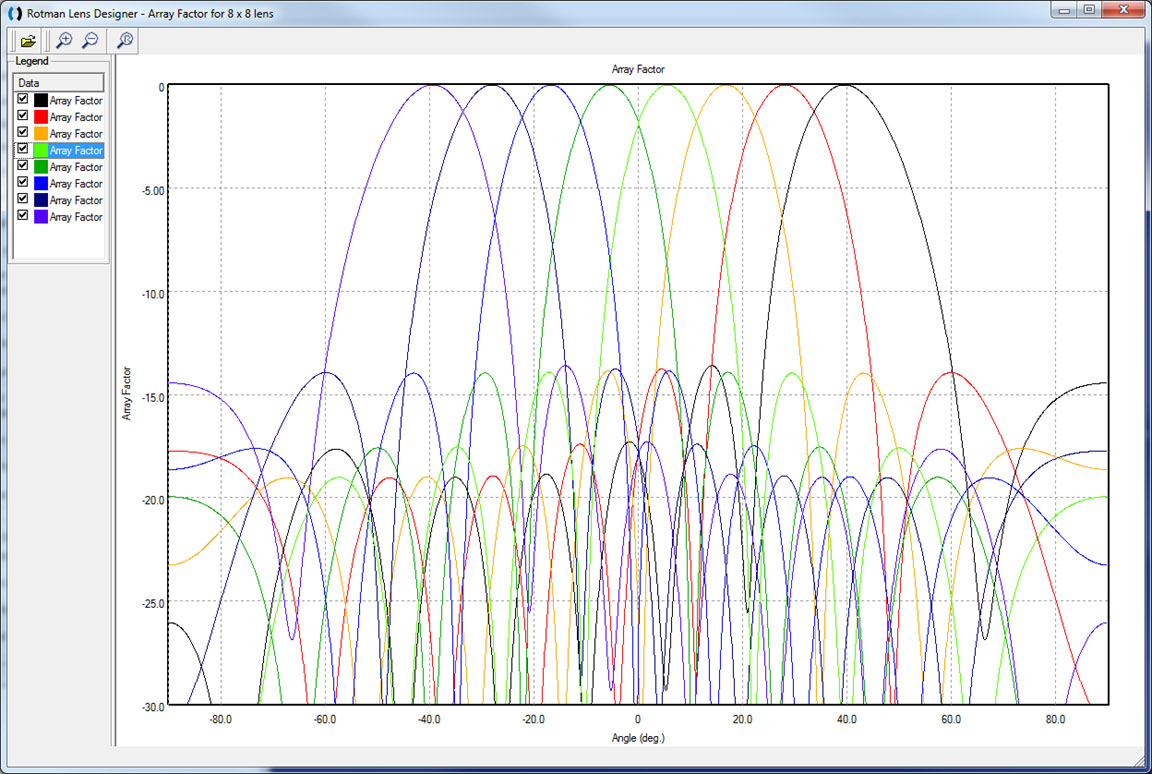
Figure 2: This is a plot of the 8 beams produced by the lens of Figure 1 in the RLD software. The maximum scan angle of the beam is +/- 40 degrees which is generated by ports 1 and 8 on the input side
This example will vary the sidewall curvature from a fairly flat value of 0.25 (shown in Figure 3) to a highly curved value of 2.5 (shown in Figure 4) and compare the results generated by RLD with those of XFdtd, a full wave solver which does take into account many effects neglected by RLD. An example of the FDTD mesh of one of the lenses is shown in Figure 5 where the inset shows the top view of the lens and the main image shows detail of some of the array transmission lines. The point of the investigation is to provide good guidelines for the RLD user for selecting sidewall curvature and to point out the importance of a more thorough simulation. These investigations will continue with larger lenses having 16 and 32 beam/array ports as well to see the impact of the number of ports on the trends found.
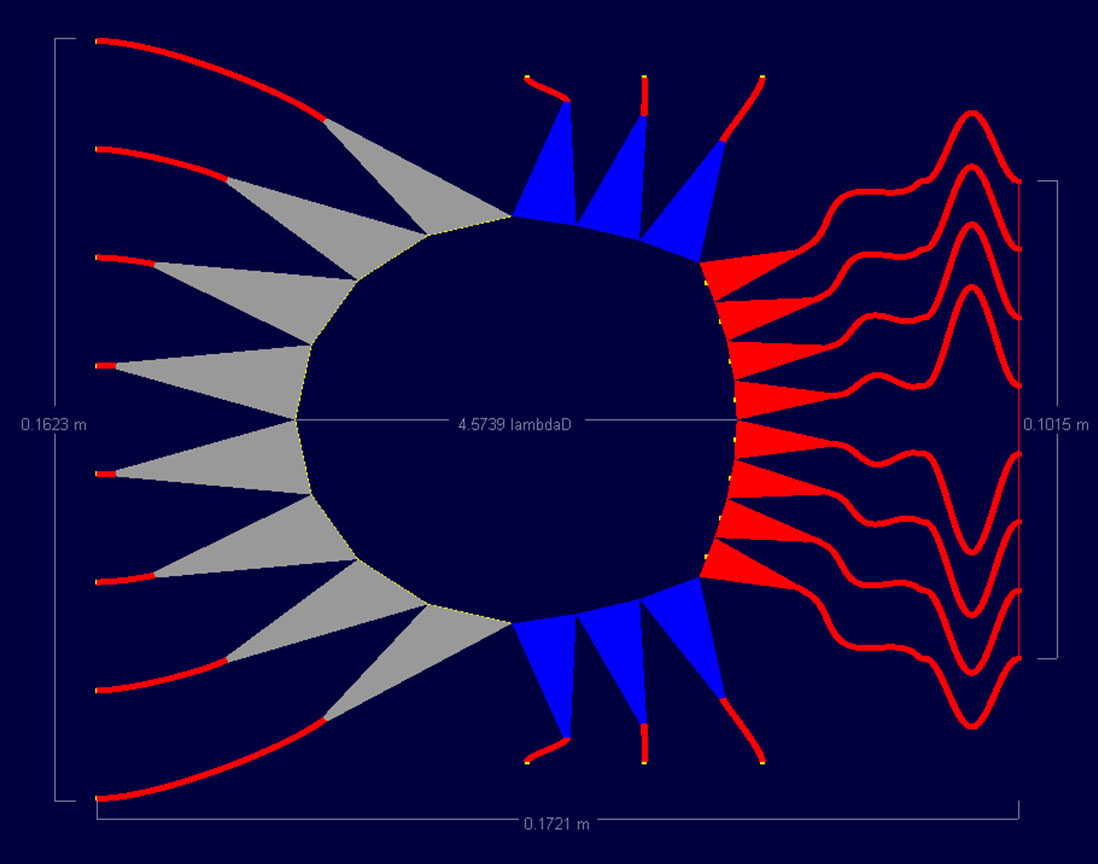
Figure 3: An 8x8 lens is shown with a sidewall curvature of 0.25, the minimum used in this study.
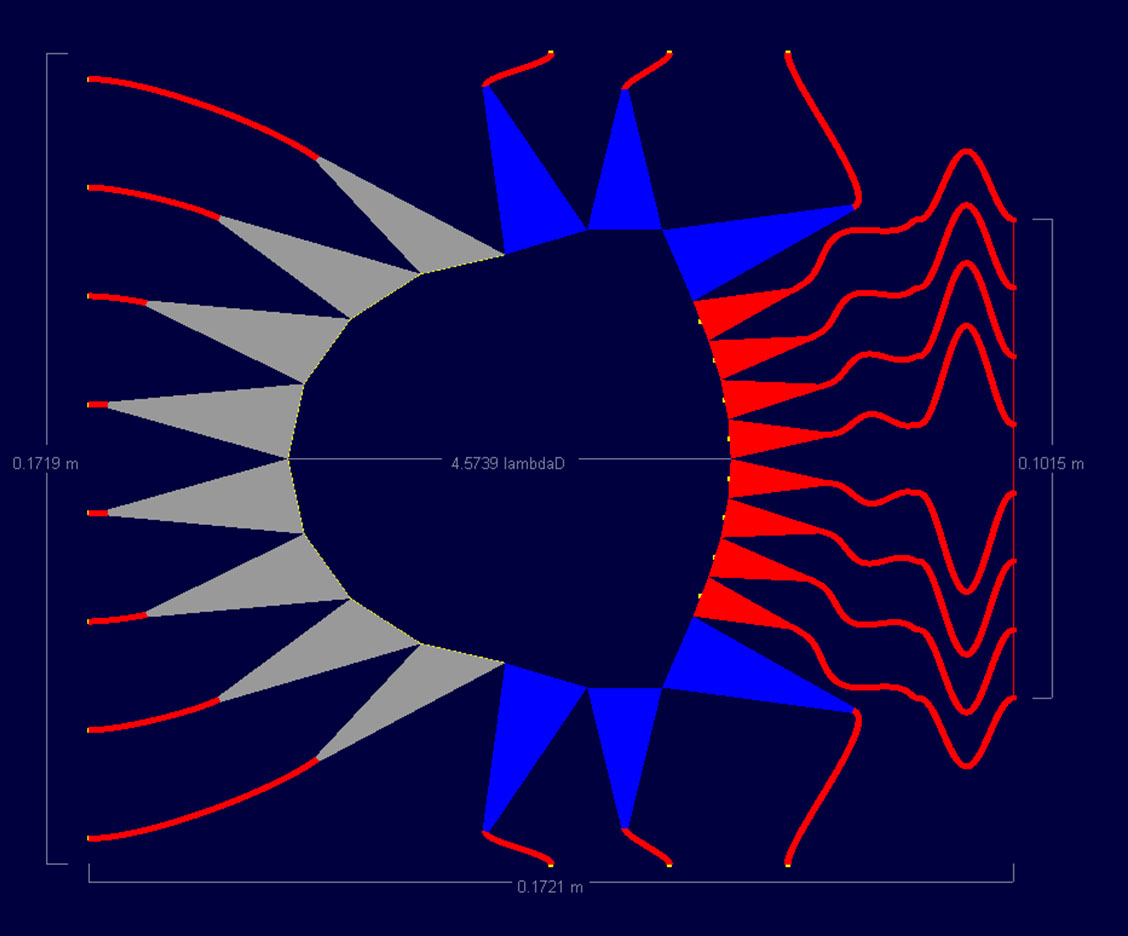
Figure 4: An 8x8 lens is shown with a sidewall curvature of 2.5, the maximum used in this study.
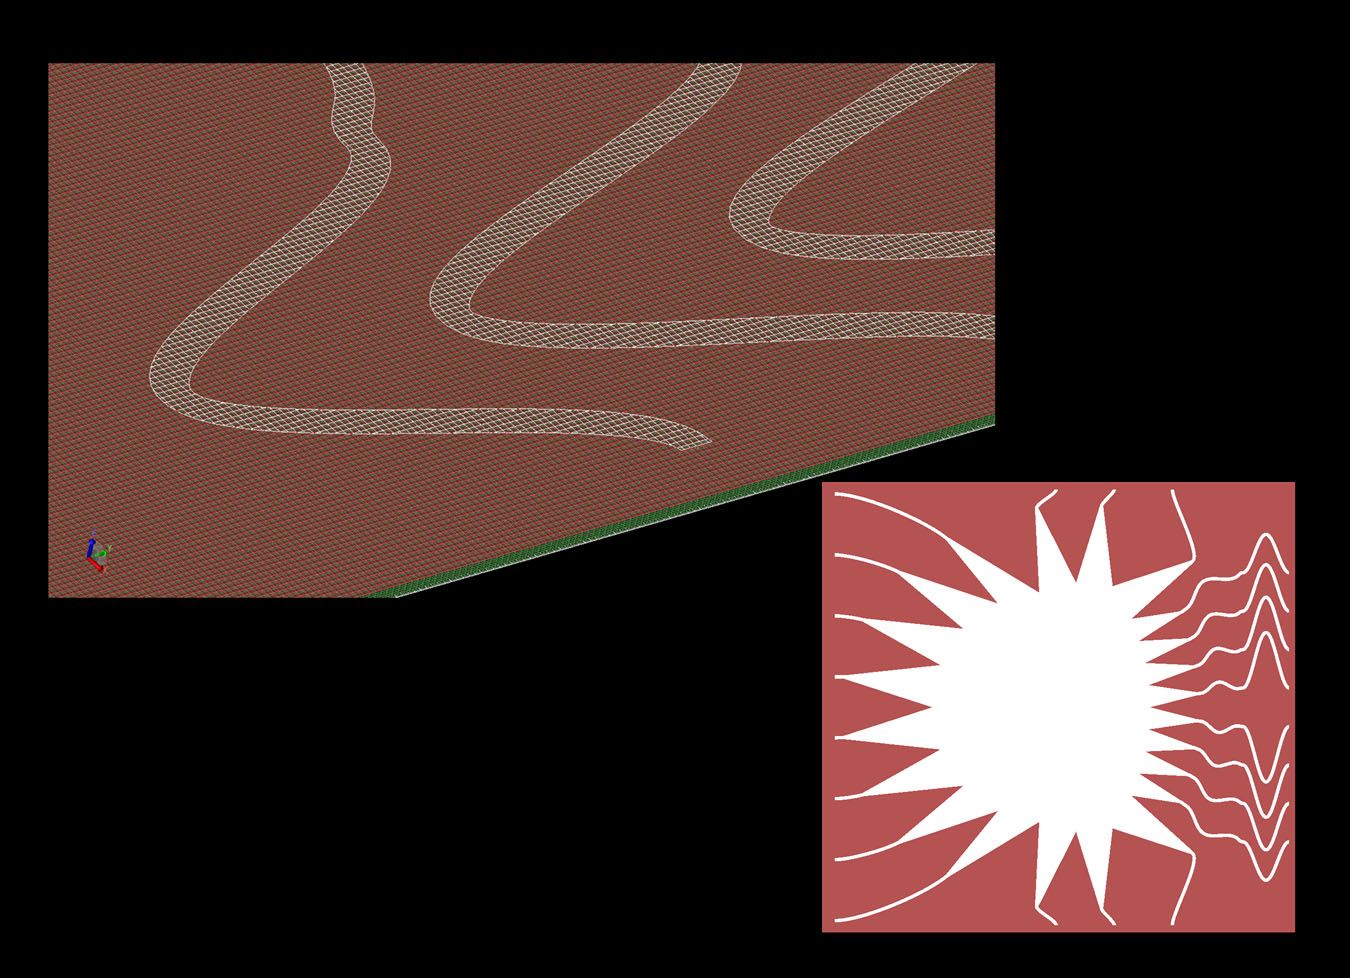
Figure 5: This is an example of the Rotman lens after importing into the full wave solver, XFdtd. The inset figure to the right shows a top view of the lens similar to that shown in the RLD software. The left image shows a detail of the FDTD mesh and the finite thickness of the underlying substrate. The XACT conformal mesh feature is used on this structure, including the transmission lines shown.
The 8x8 lens configuration was shown in Figure 1 with the sidewalls varying from a value of 0.25 (Figure 3) to 2.50 (Figure 4) with steps of 0.25 in between each case. For the 8x8 lens two different beam ports, 1 and 4, are simulated to test the extremes of the design. For the case of beam 1 active, the results comparing XFdtd and RLD are shown in Figures 6, 7, and 8 for curvatures of 0.25, 1.25, and 2.5. In Figure 6 the main beam generated by XFdtd is narrower and offset from the desired direction. The side lobes are higher as well. In Figure 7 the lens with 1.25 curvature shows better agreement between the two methods with a good main beam and generally lower side lobes. At a curvature of 2.5 as shown in Figure 8, the main beam is still a good match between codes, but the side lobes are higher than the 1.25 case. In Figure 9 all cases run in XFdtd are displayed and it can be seen that there is a fair amount of variation in the main beam. The case with the best correlation to the ideal RLD results is a sidewall curvature of 2.00.
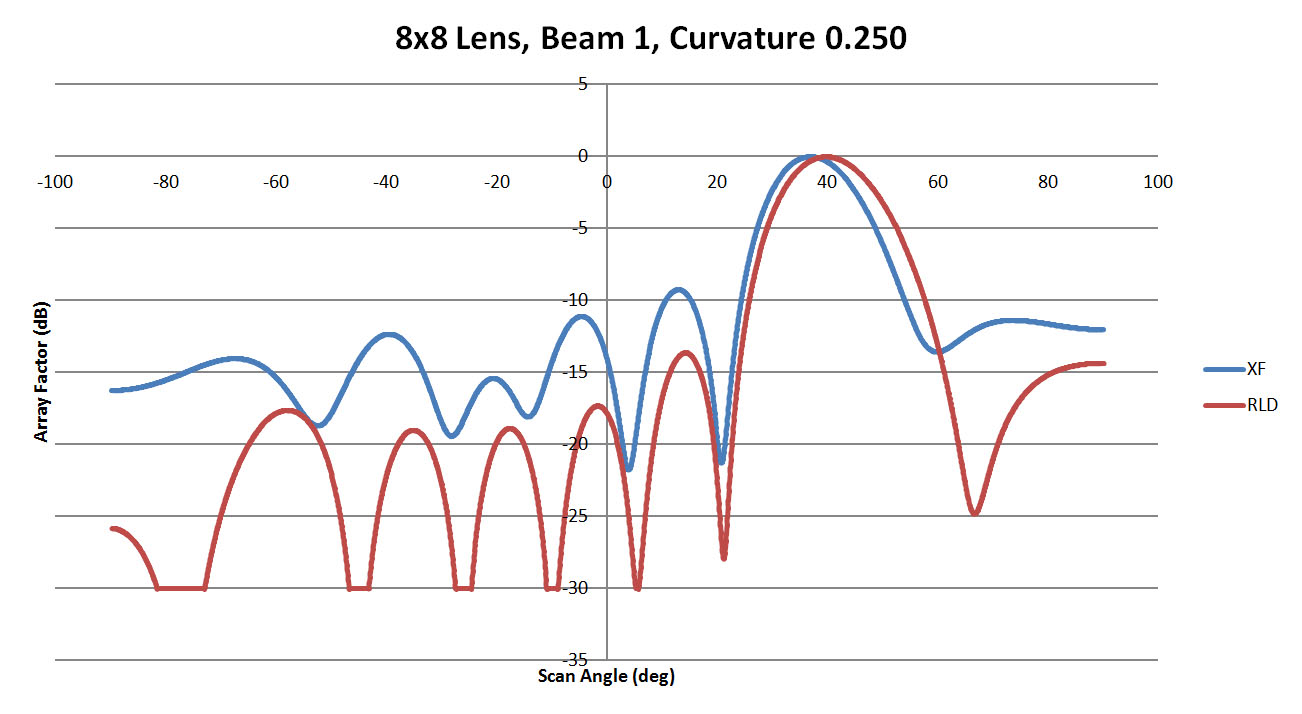
Figure 6: A comparison of beam 1 for the 8x8 lens with a sidewall curvature of 0.25 is shown. The agreement between RLD and XFdtd is marginal with an offset in the main beam and higher side lobe levels for the XFdtd case. This indicates in part that there is some difference in the results based on the sidewall curvature.
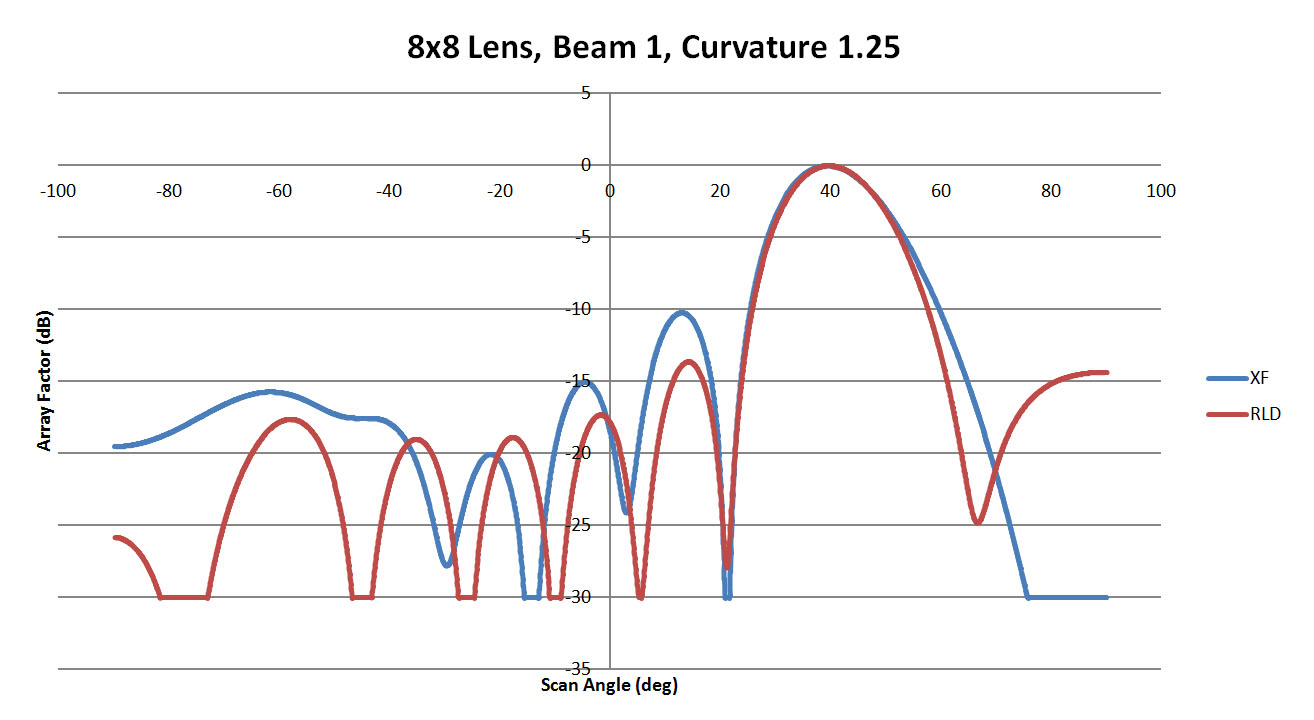
Figure 7: A comparison of beam 1 for the 8x8 lens with a sidewall curvature of 1.25. Here the agreement is better with the main beams matching and the side lobes much reduced.
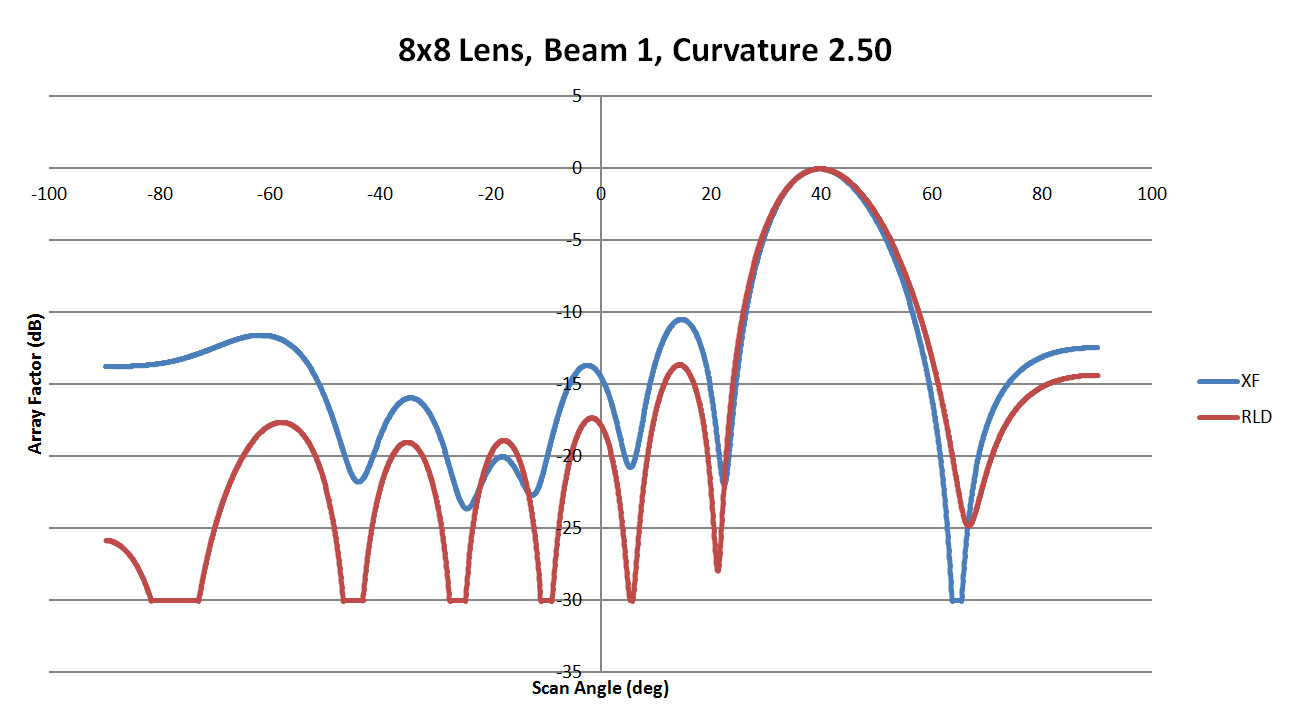
Figure 8: A comparison of beam 1 for the 8x8 lens with a sidewall curvature of 2.50. Here the main beam is a good match and there is general agreement in the side lobes although those generated by XFdtd are higher.
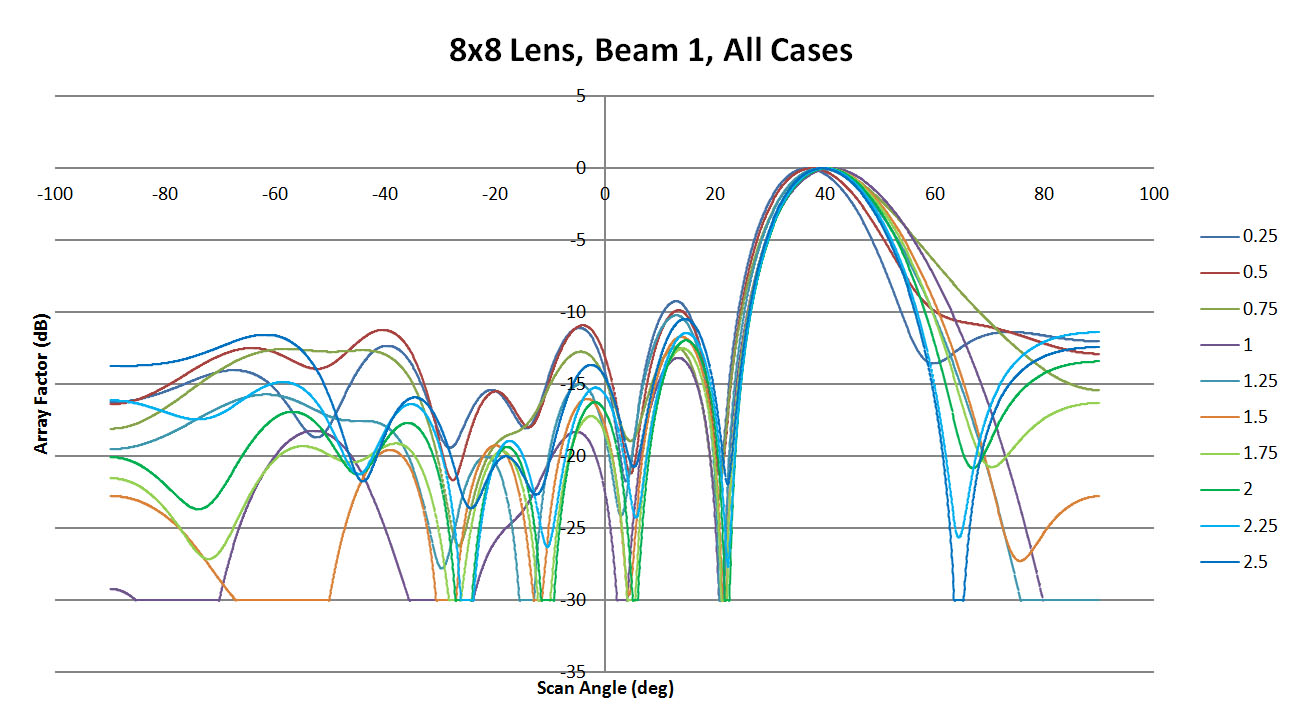
Figure 9: Shown is a comparison of all results produced by XFdtd for beam 1 of the 8x8 lens. The sidewall curvature varies from 0.25 to 2.5 in 0.25 steps. There is a shift in the location and shape of the main beam as the sidewalls are varied. The side lobes are variable as well with some cases returning fairly high values.
For a near-centered beam at port 4, the results are slightly different. The same three cases of 0.25, 1.25, and 2.50 curvature are shown in Figures 10, 11, and 12. Here the sidelobes are higher for the first two cases and a quite good match is shown in Figure 12 for the 2.50 curvature case. The beam patterns for all cases of port 4 active are shown in Figure 13 where the main beam is generally always well-formed although the side lobes show some variation. The configurations with a curvature higher than 1.00 all have high correlation with the RLD values. This is to be expected since the center port directs most of the energy toward the array while the offset ports send much more energy toward the sidewalls.
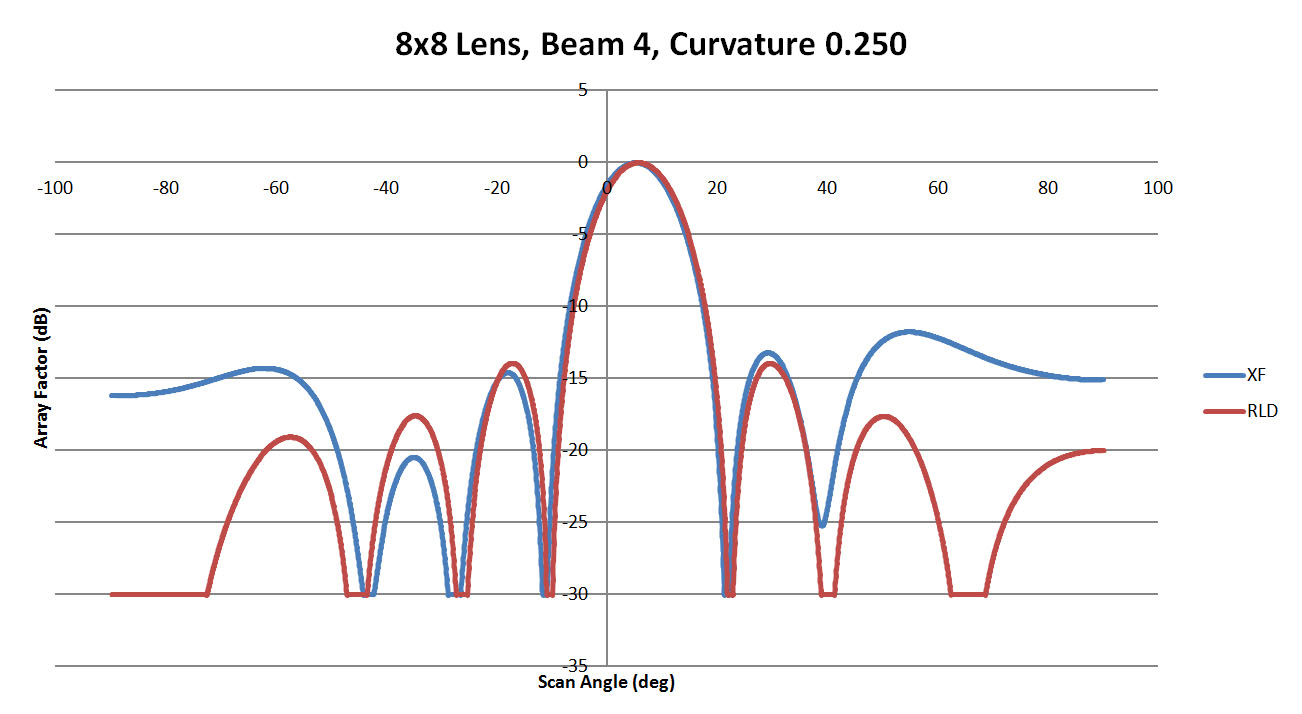
Figure 10: A comparison of beam 4 for the 8x8 lens with a sidewall curvature of 0.25
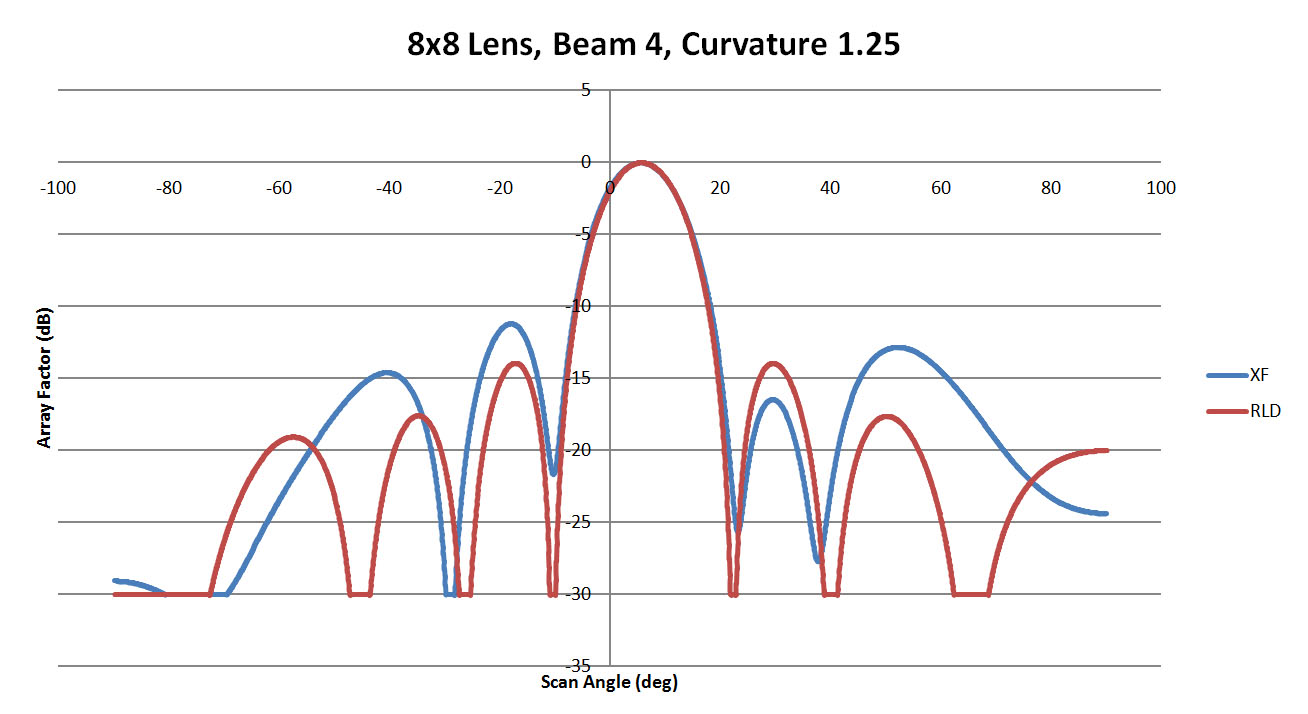
Figure 11: A comparison of beam 4 for the 8x8 lens with a sidewall curvature of 1.25
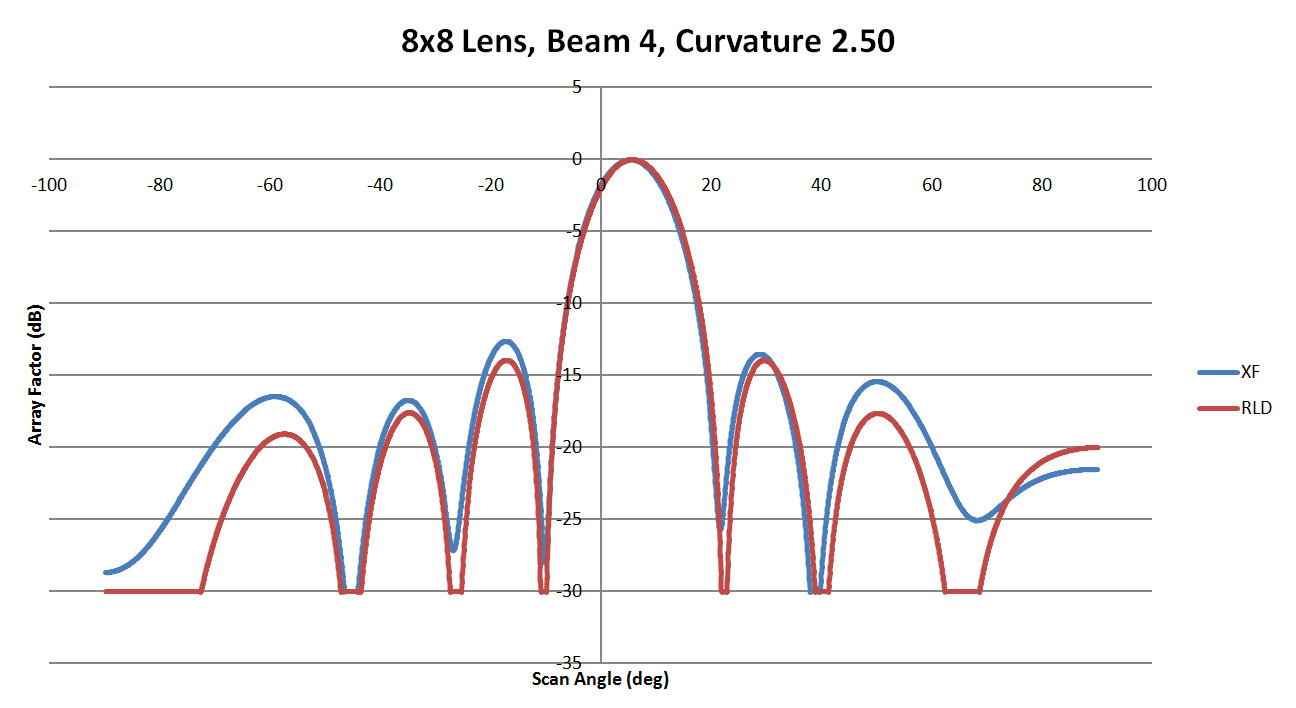
Figure 12: A comparison of beam 4 for the 8x8 lens with a sidewall curvature of 2.50
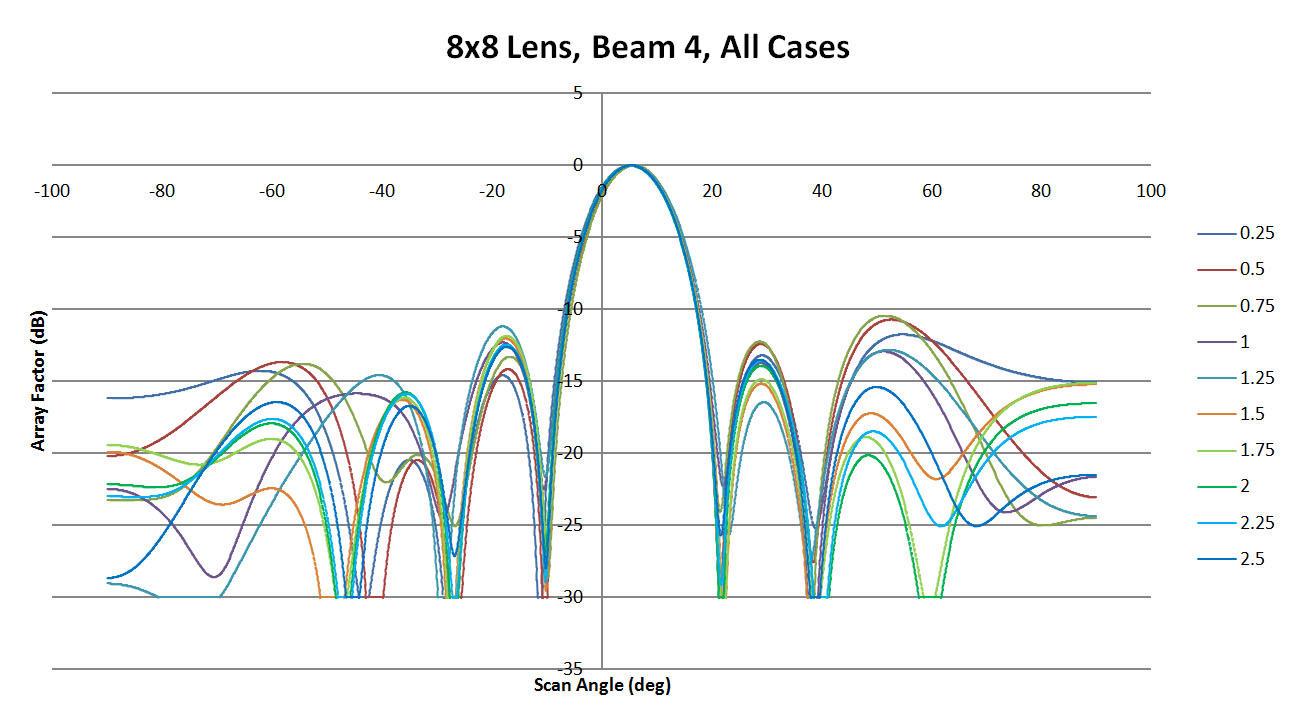
Figure 13: A summary of all XFdtd results for beam 4 of the 8x8 lens. There is good agreement on the location and shape of the main beam and some slight variation in the side lobe levels
Figure 14 shows the peak side lobe level of all cases for both beams. Generally beam 4 has lower side lobe levels for any sidewall curvature while the side lobe levels of beam 1 are more affected by variation in the sidewall. In Figure 15 the variation of the main beam location is plotted as the difference in the XFdtd location compared to the ideal RLD location. Again the center beam 4 is less impacted by sidewall shape and gives fairly good results while beam 1 varies as a function of the curvature.
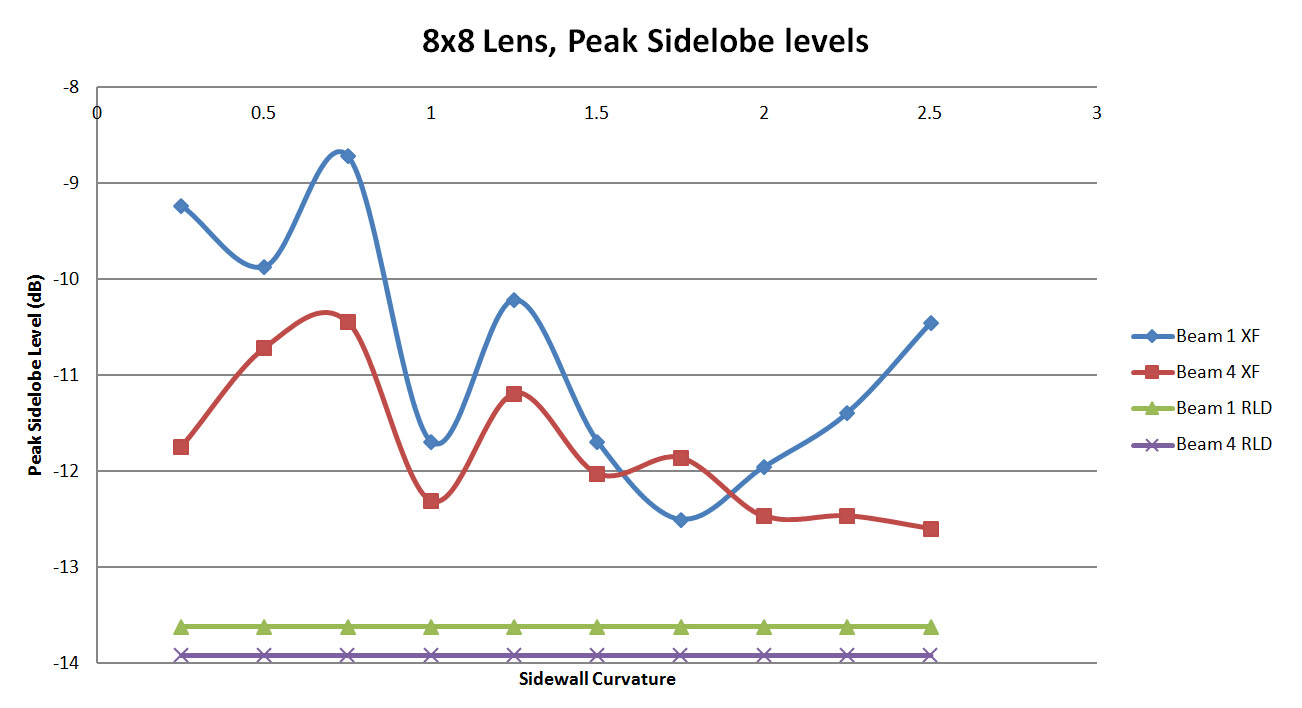
Figure 14: A plot of the peak side lobe level in the XFdtd simulations compared to the ideal values generated by the RLD software. There is variation in the XFdtd results with sidewall curvature with minimal side lobes around a curvature value of 2.00
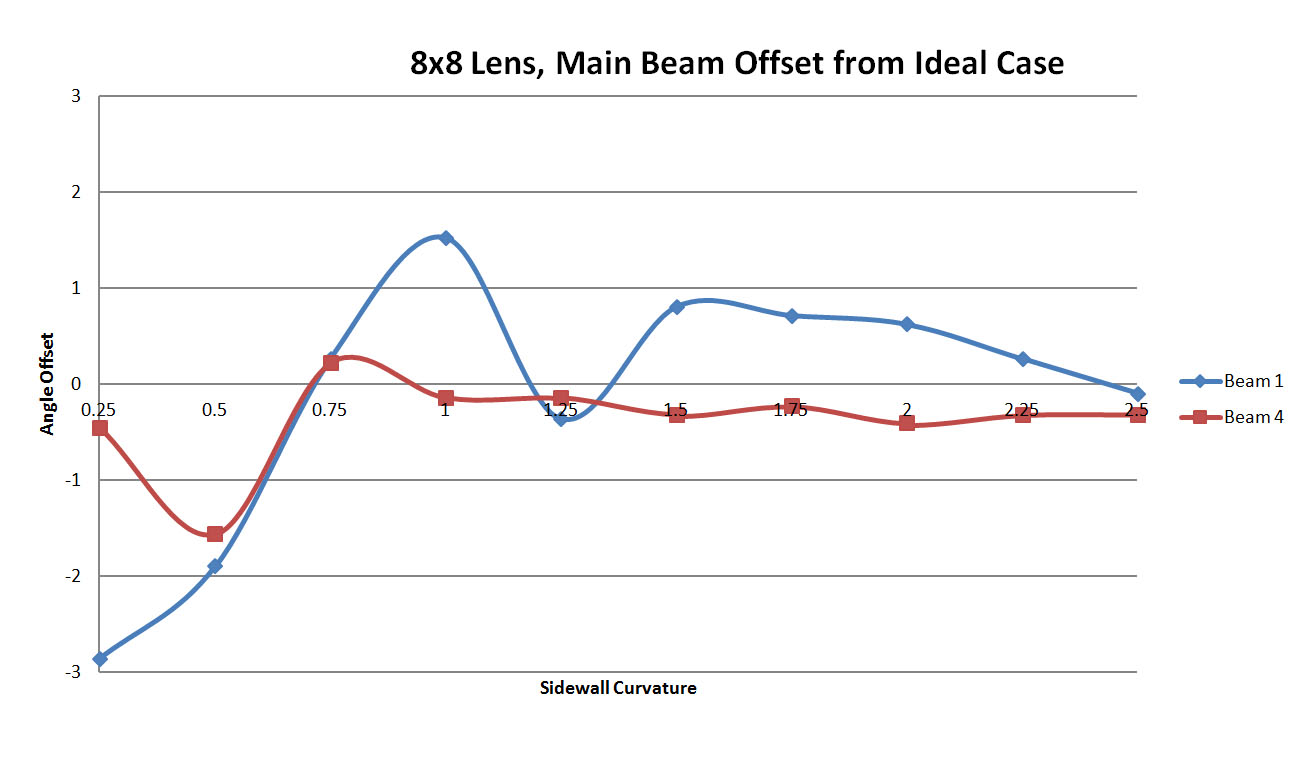
Figure 15: A plot of the offset in the main beam location between XFdtd and RLD as a function of the sidewall curvature. At low sidewall curvatures the error is much higher and converges toward zero as the curvature increases.
The simulations performed for the 8x8 lens are repeated for the 16x16 lens shown in Figure 16. In this instance, the beams from ports 1, 4, and 8 are compared which should produce beams at 40, 24, and 3 degrees, respectively. As this lens is larger, there is more room on the sides for the curvature which results in more dummy ports being added. This allows for a smoother transition of the edges than in the 8x8 case.
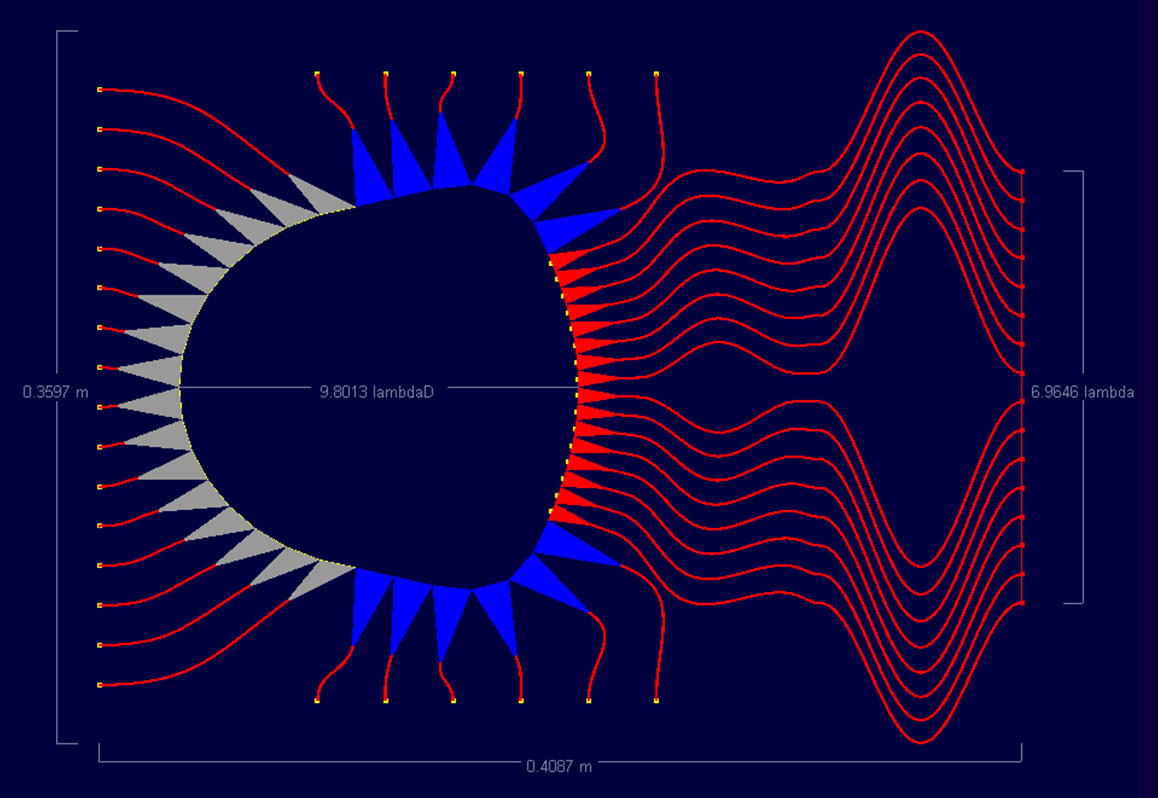
Figure 16: Shown is the 16x16 port Rotman microstrip lens simulated in the software
Figure 17 shows the resulting beam patterns for beam 1 for the sidewall curvature of 0.25. It is clear in this figure that there is an offset in the beam location between XFdtd and RLD which is more significant than was apparent in the 8x8 case. In Figures 18 and 19 with the sidewall curvature increased to 1.25 and 2.5, the variation in the beam location is reduced but at a cost of higher side lobes. Figure 20 displays all XFdtd results for the various sidewall curvatures. Here the shift in the main beam is visible with the better results produced for the higher sidewall curvature values. While the side lobe levels vary between cases, they remain below 10 dB down for all.
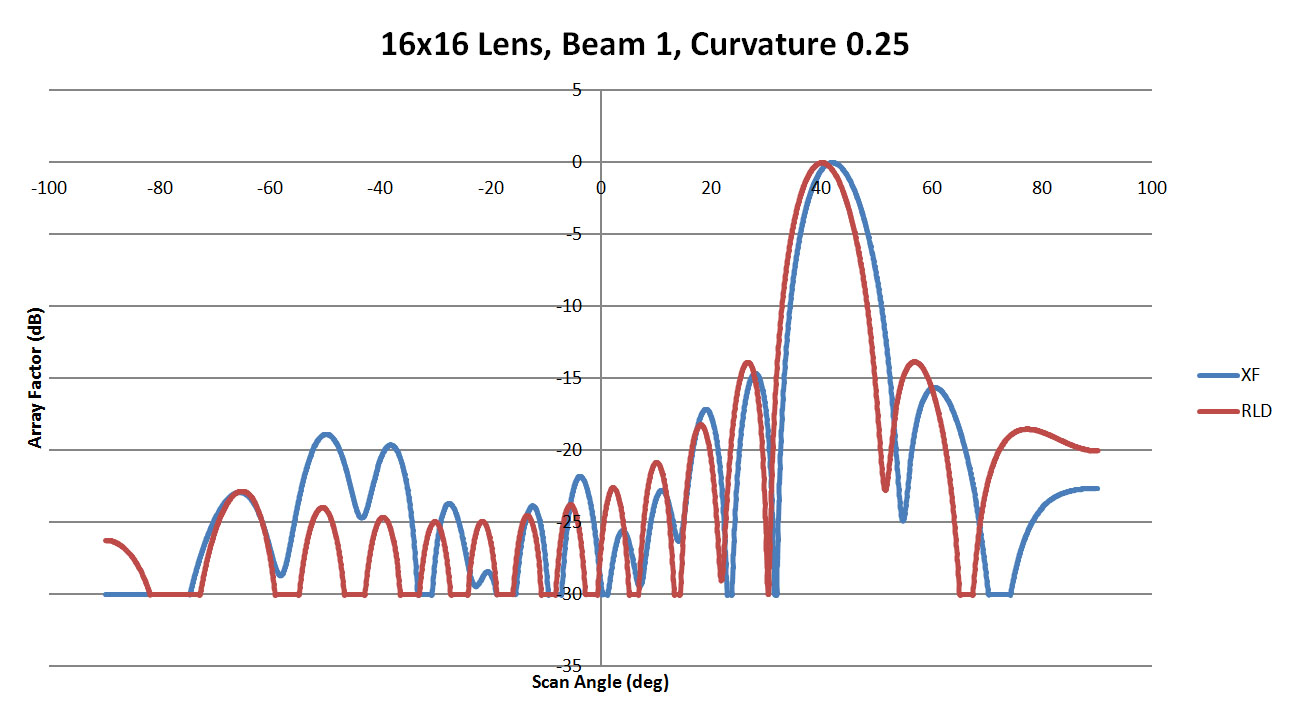
Figure 17: Shown is a comparison of the beam 1 patterns from XFdtd and RLD for a sidewall curvature of 0.25
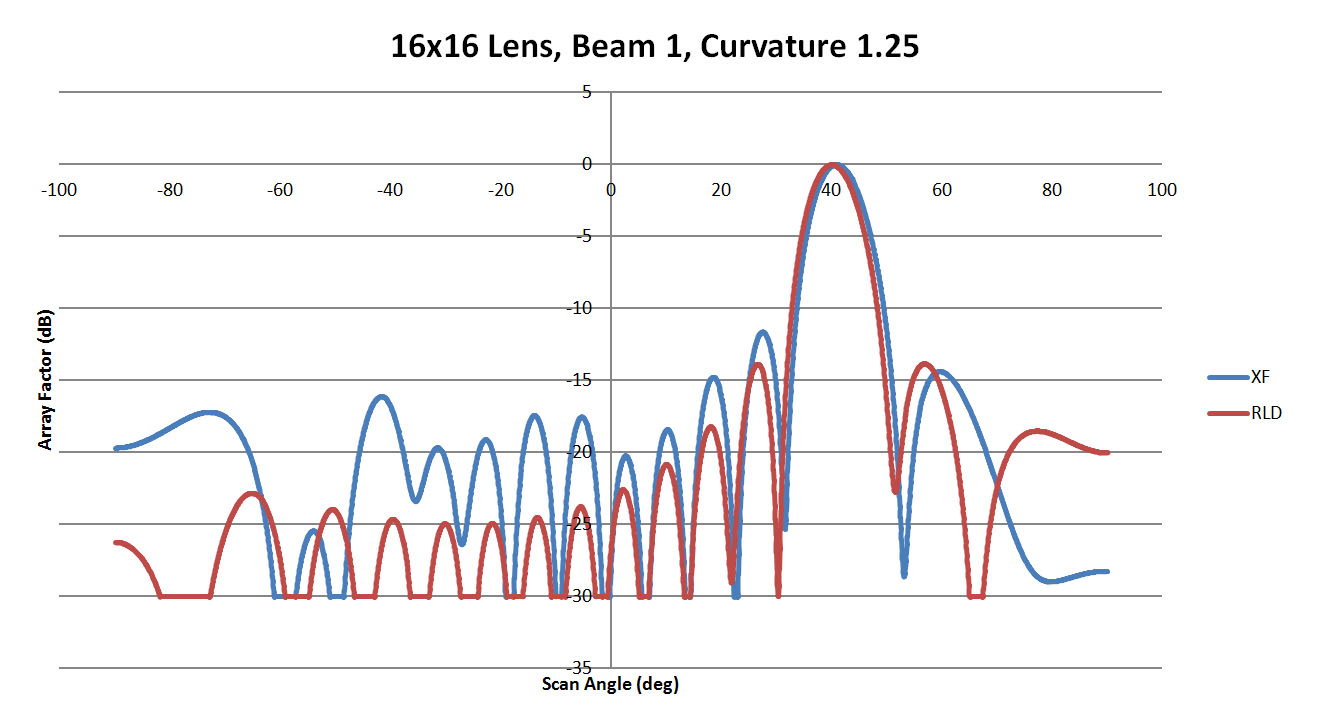
Figure 18: Shown is a comparison of the beam 1 patterns from XFdtd and RLD for a sidewall curvature of 1.25
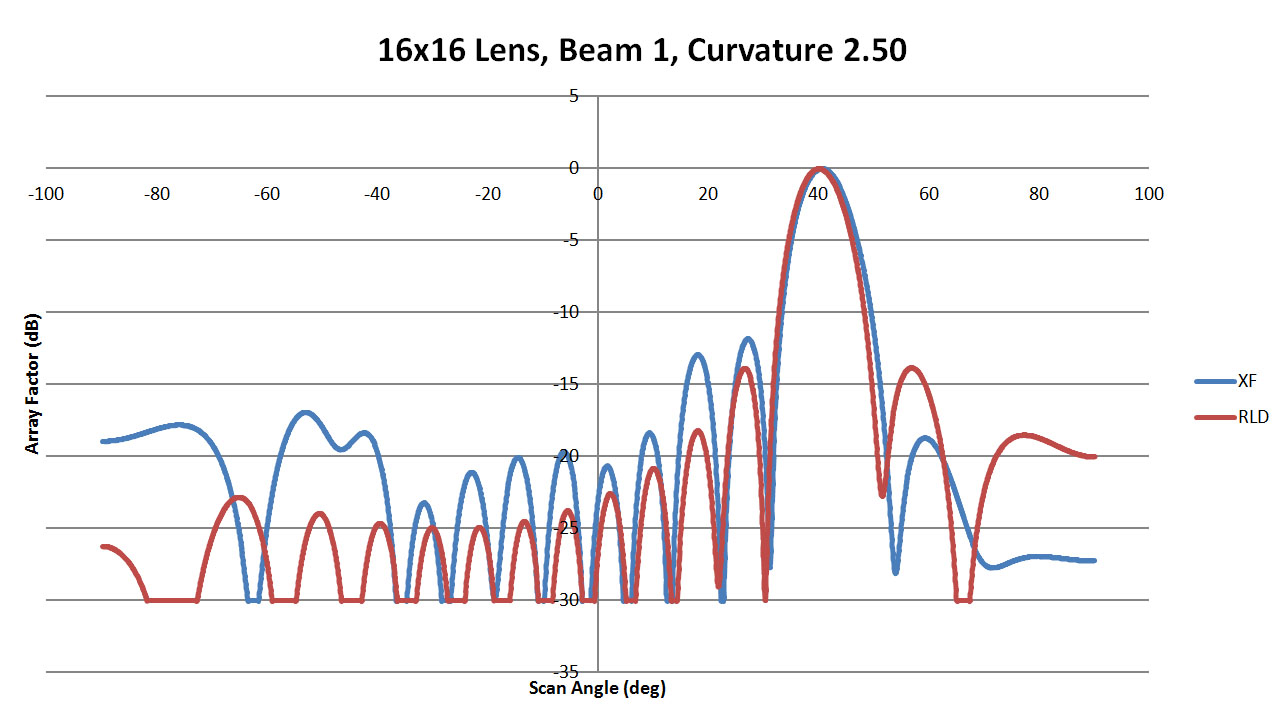
Figure 19: Shown is a comparison of the beam 1 patterns from XFdtd and RLD for a sidewall curvature of 2.5
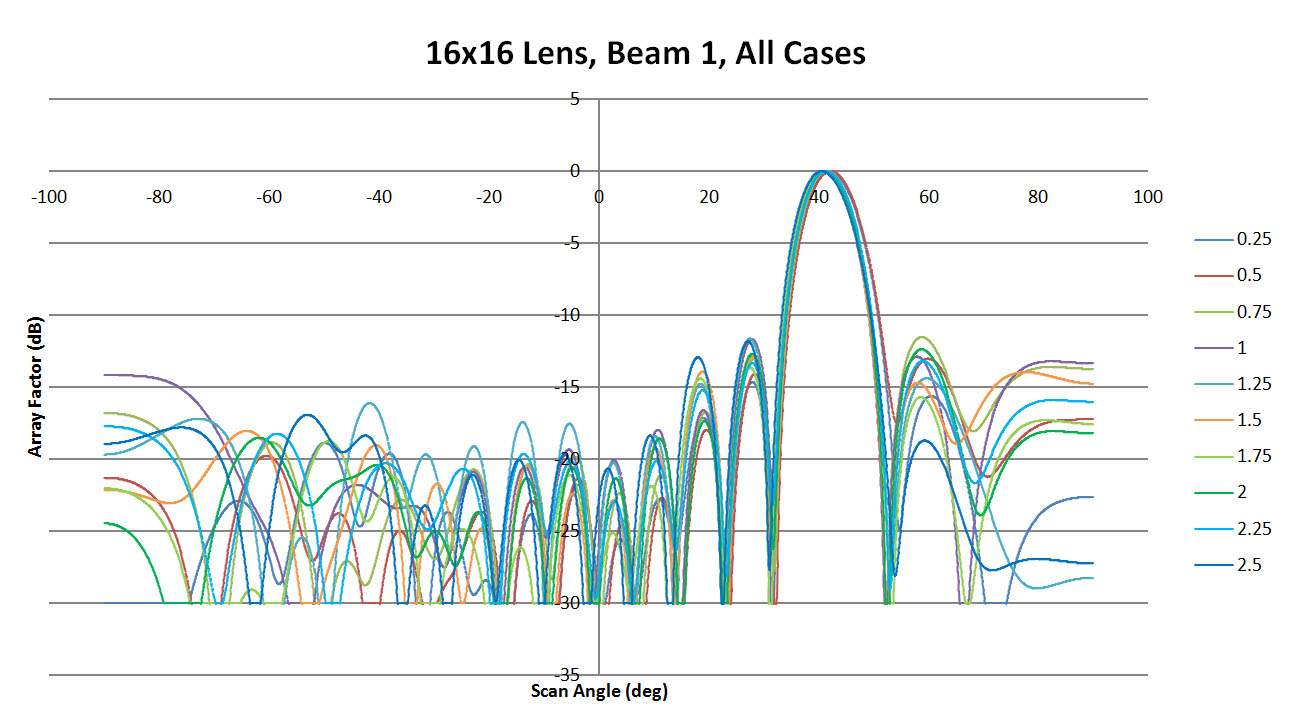
Figure 20: Shown are all the patterns generated for beam 1 by XFdtd for the different sidewall values
For beam 4 which should appear at about 24 degrees, the results show less variation with sidewall curvature. There are some significant side lobes in Figure 21 for the low curvature wall, but for the 1.25 and 2.5 cases shown in Figures 22 and 23 the levels are low and there is generally good agreement with the ideal RLD case. The summary of all sidewall cases is shown in Figure 24 and again there is low variation in the main beam position versus sidewall curvature.
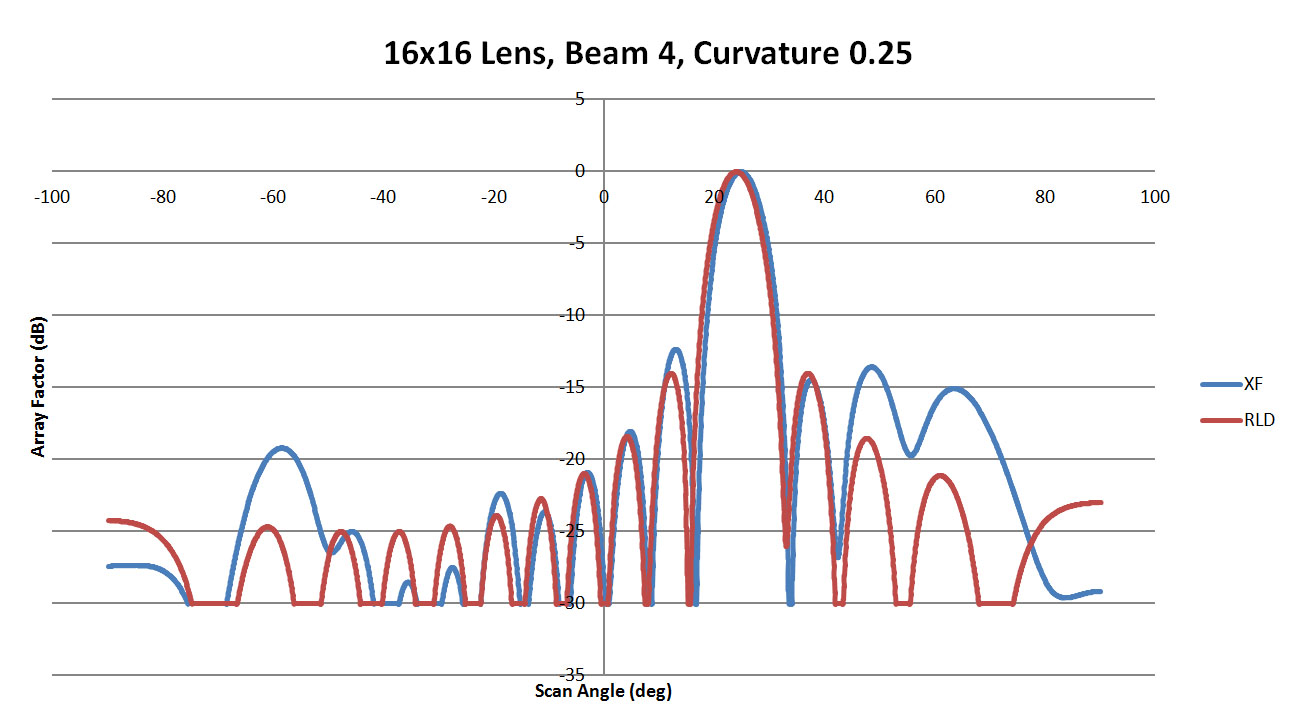
Figure 21: Shown is a comparison of the beam 4 patterns from XFdtd and RLD for a sidewall curvature of 0.25
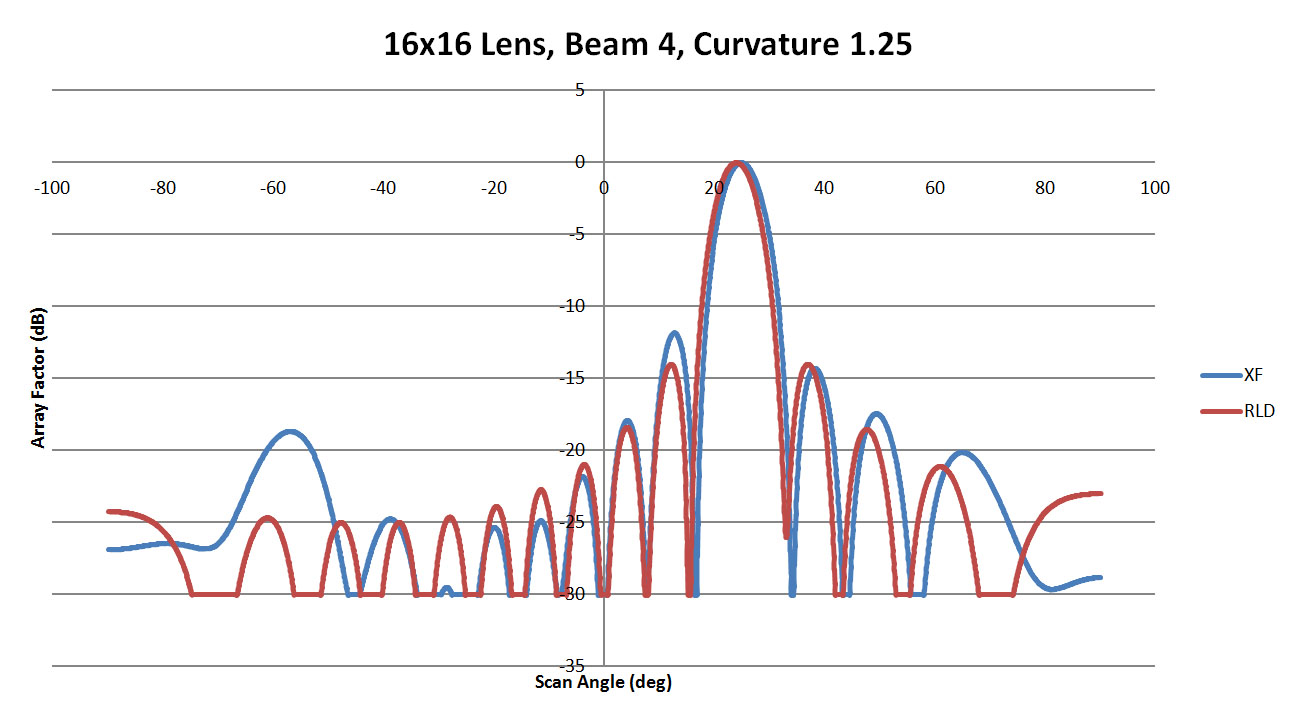
Figure 22: Shown is a comparison of the beam 4 patterns from XFdtd and RLD for a sidewall curvature of 1.25
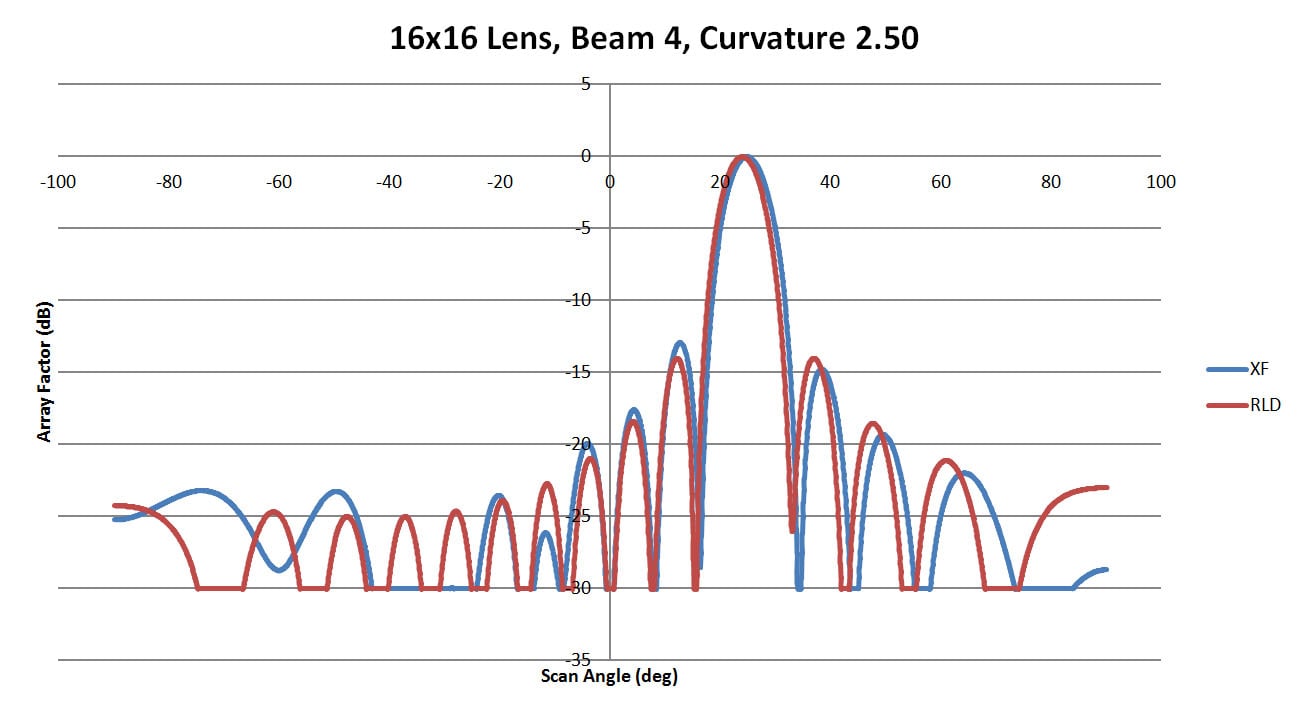
Figure 23: Shown is a comparison of the beam 4 patterns from XFdtd and RLD for a sidewall curvature of 2.5
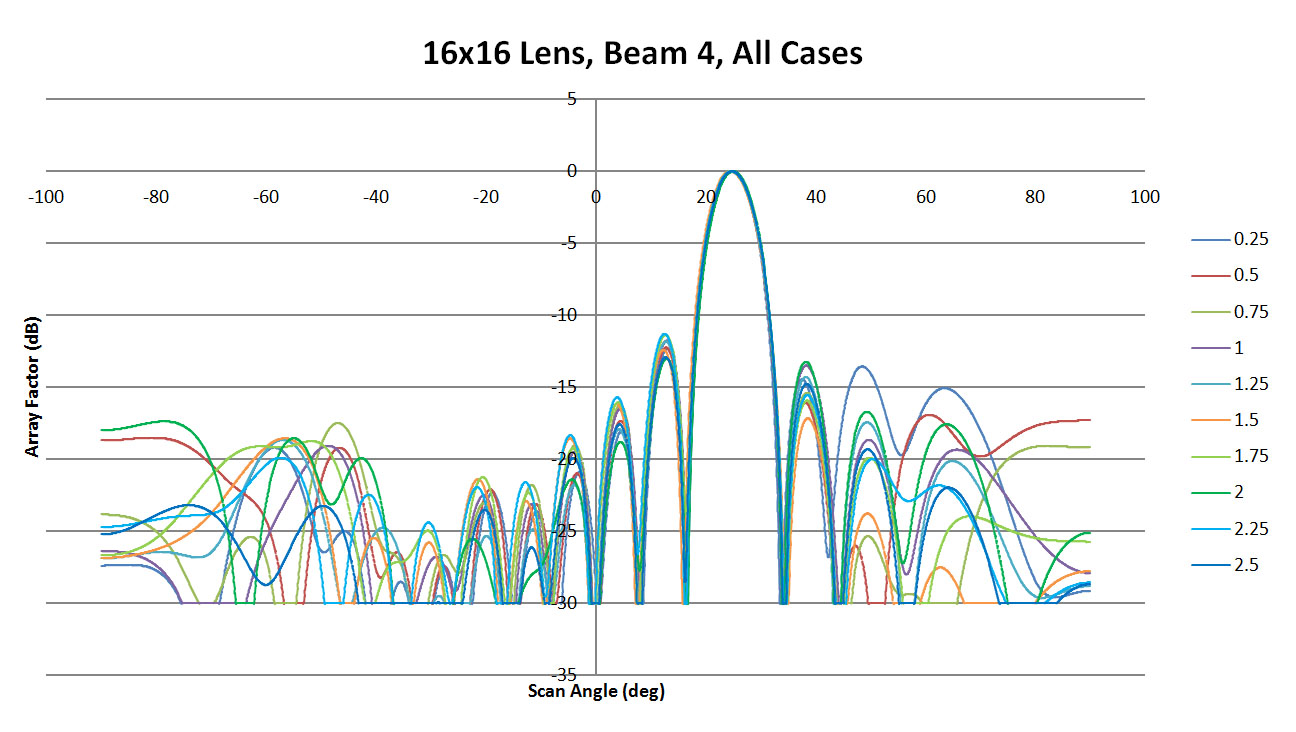
Figure 24: Shown are all the patterns generated for beam 4 by the XFdtd software as a function of sidewall curvature
The near-center beam from port 8 is well reproduced in XFdtd for all cases of sidewall curvature shown in Figures 25, 26, and 27. There are some high side lobes produced for the 0.25 curvature case which do not appear for the others. When comparing all cases in Figure 28, there is good agreement on the main beam location with some variation in the high-angle side lobes. The maximum side lobe levels are summarized in Figure 29 and again are always lower than 10 dB down from the peak. The offset of the main beam summarized in Figure 30 is more pronounced for beam 1 and shows little variation versus curvature for beams 4 and 8.
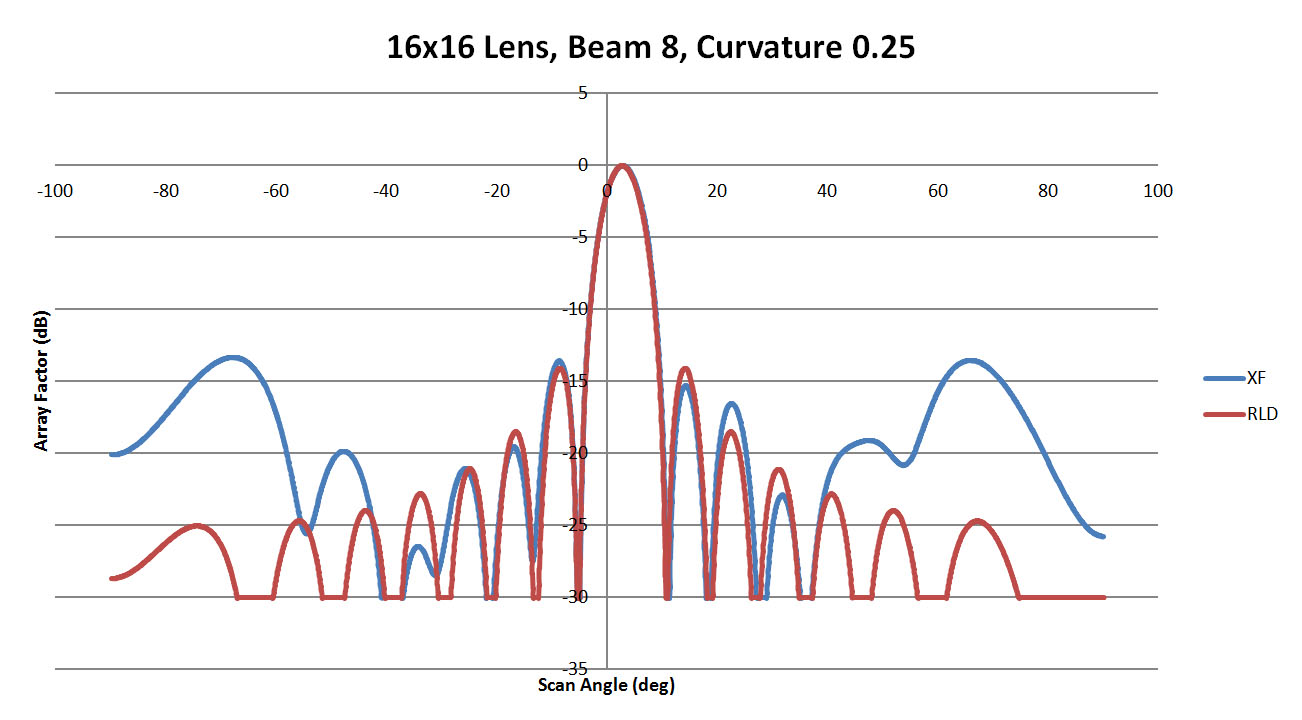
Figure 25: Shown is a comparison of the beam 8 patterns from XFdtd and RLD for a sidewall curvature of 0.25
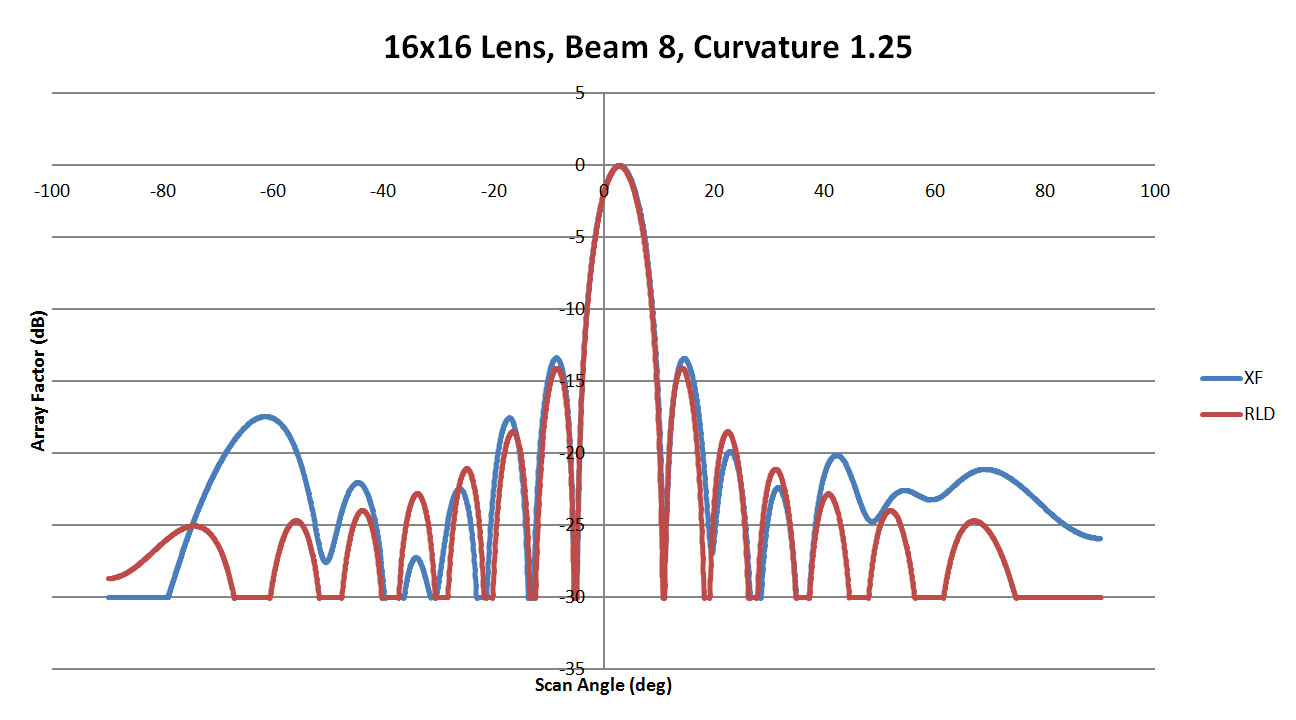
Figure 26: Shown is a comparison of the beam 8 patterns from XFdtd and RLD for a sidewall curvature of 1.25
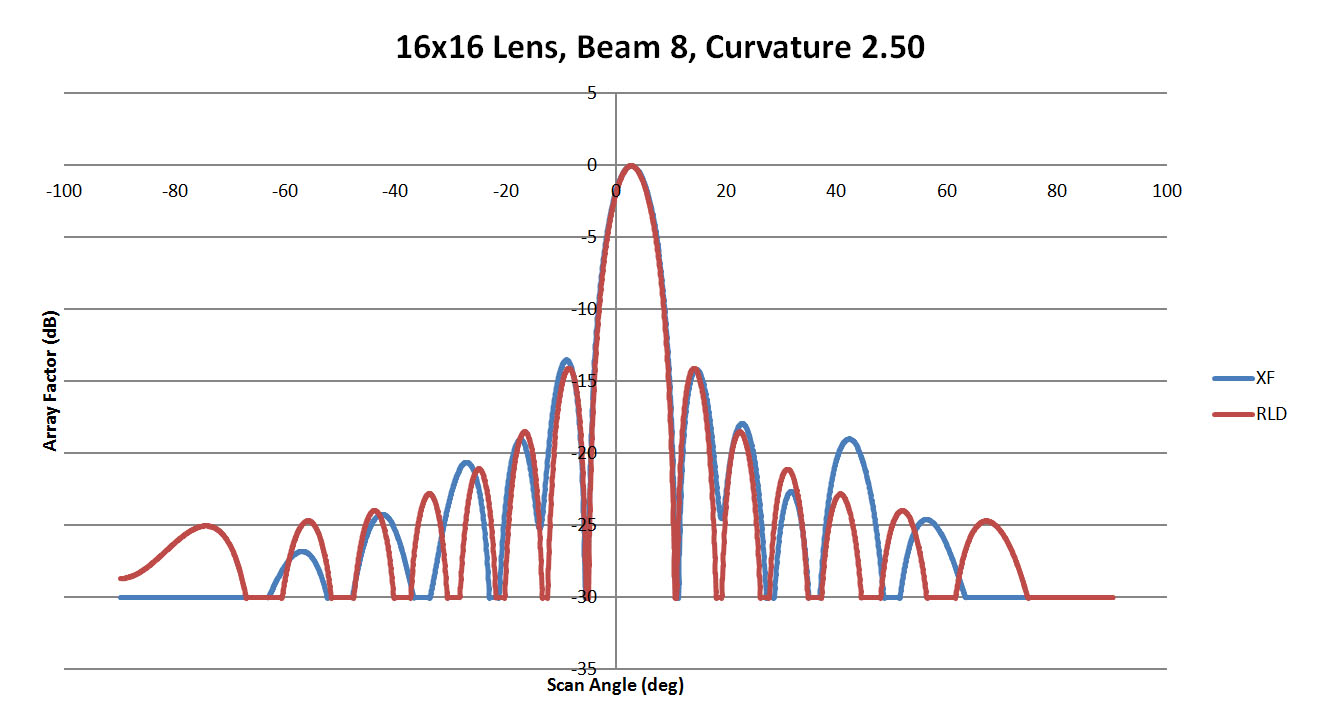
Figure 27: Shown is a comparison of the beam 8 patterns from XFdtd and RLD for a sidewall curvature of 2.5
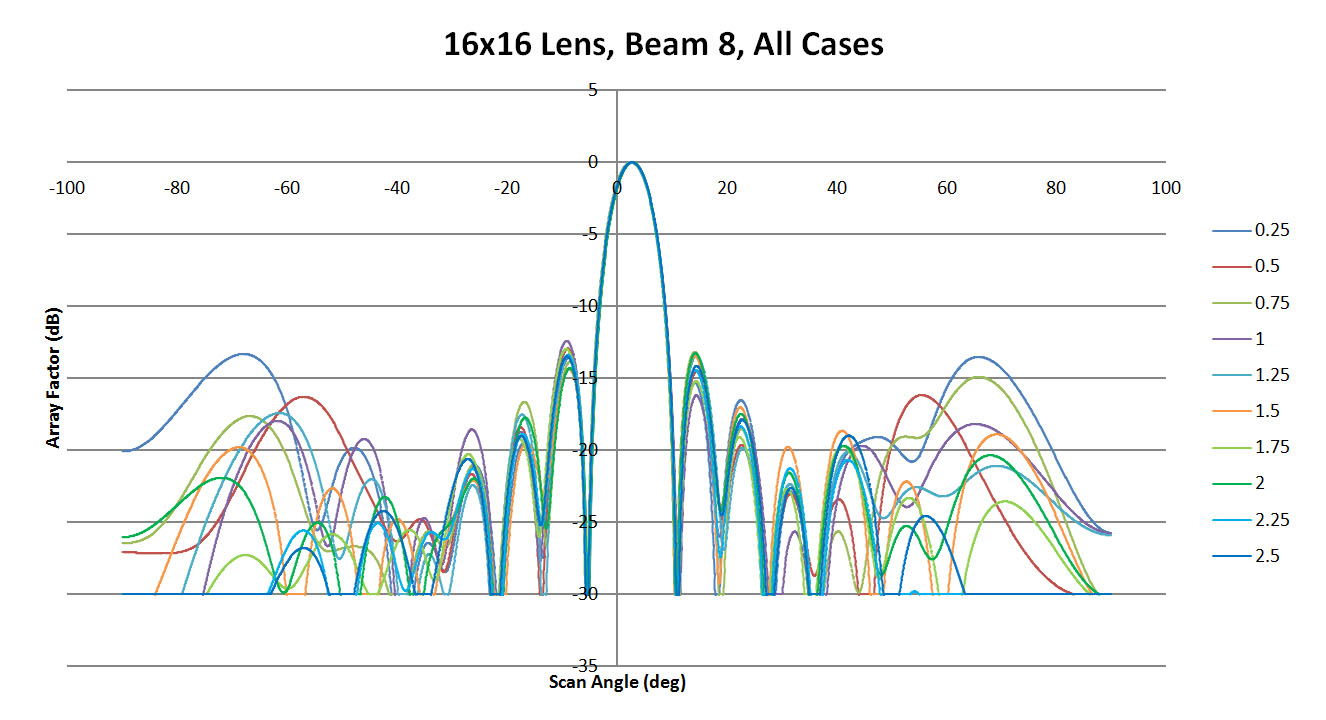
Figure 28: Shown are all the patterns generated for beam 8 by the XFdtd software as a function of sidewall curvature
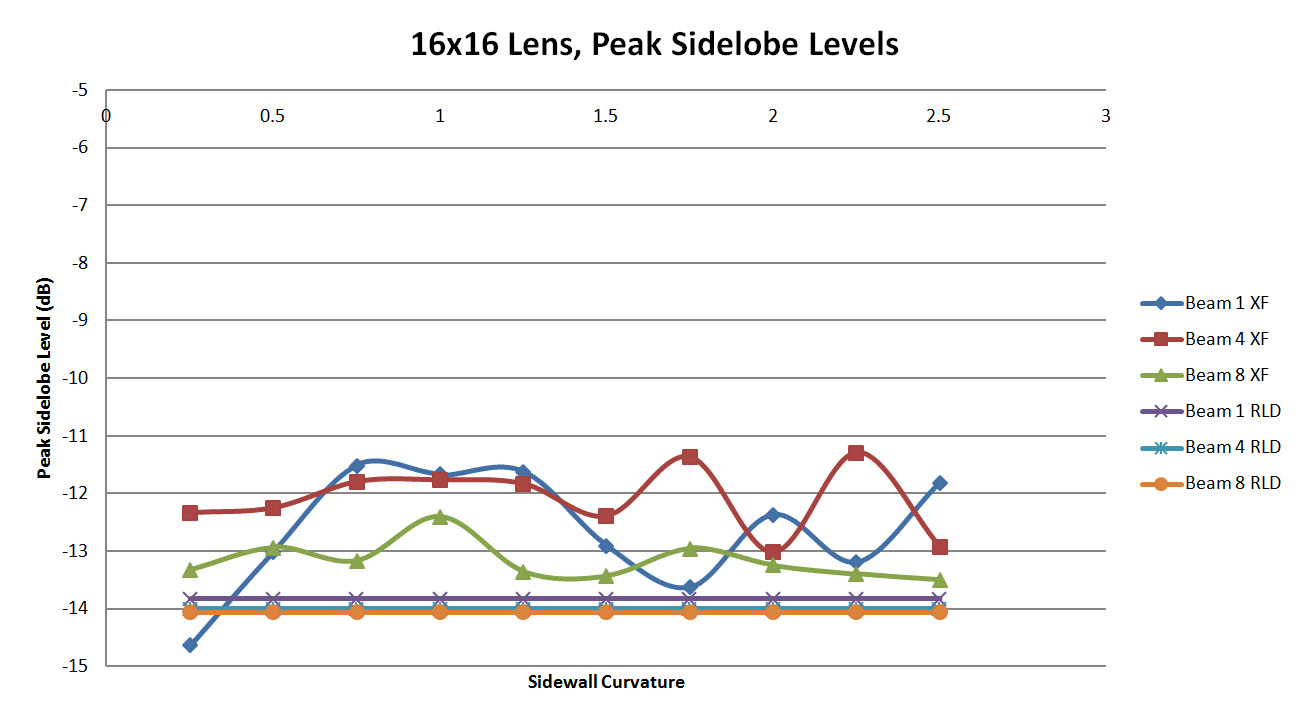
Figure 29: A plot of the peak side lobe levels in the XFdtd simulations compared to the ideal values generated by the RLD software. There is less variation than in the 8x8 lens case
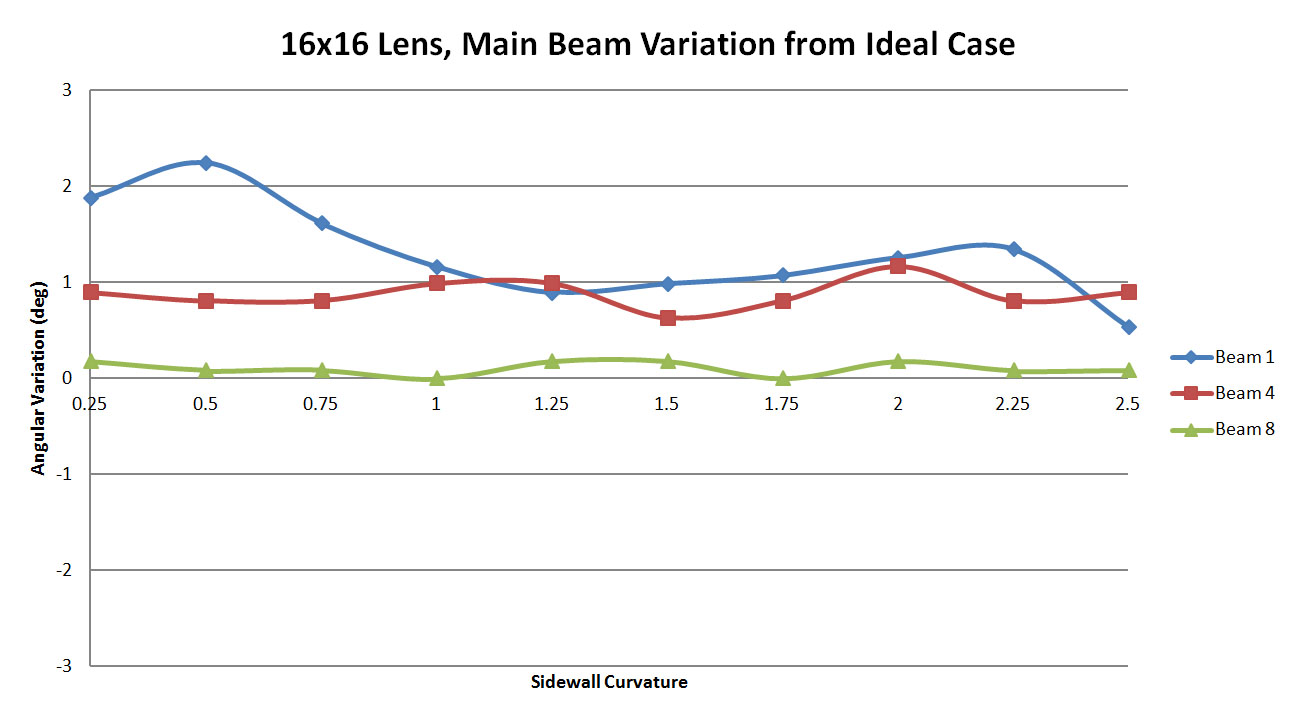
Figure 30: A plot of the offset in the main beam location between XFdtd and RLD as a function of the sidewall curvature for the 16x16 lens. At low sidewall curvatures the error is slightly higher, mainly for beam 1 and improves with higher curvature
As a final case, a 32x32 lens is tested for the same cases. The lens geometry is shown in Figure 31 and has much better definition of the sidewall curvature due to the larger size and increased number of dummy ports (which are held at a constant width for all cases). For this set of simulations, comparisons will be made for beams 1, 4, 8, 12, and 16 which produce beams ideally at 40, 32, 22, 11.5, and 1 degrees.
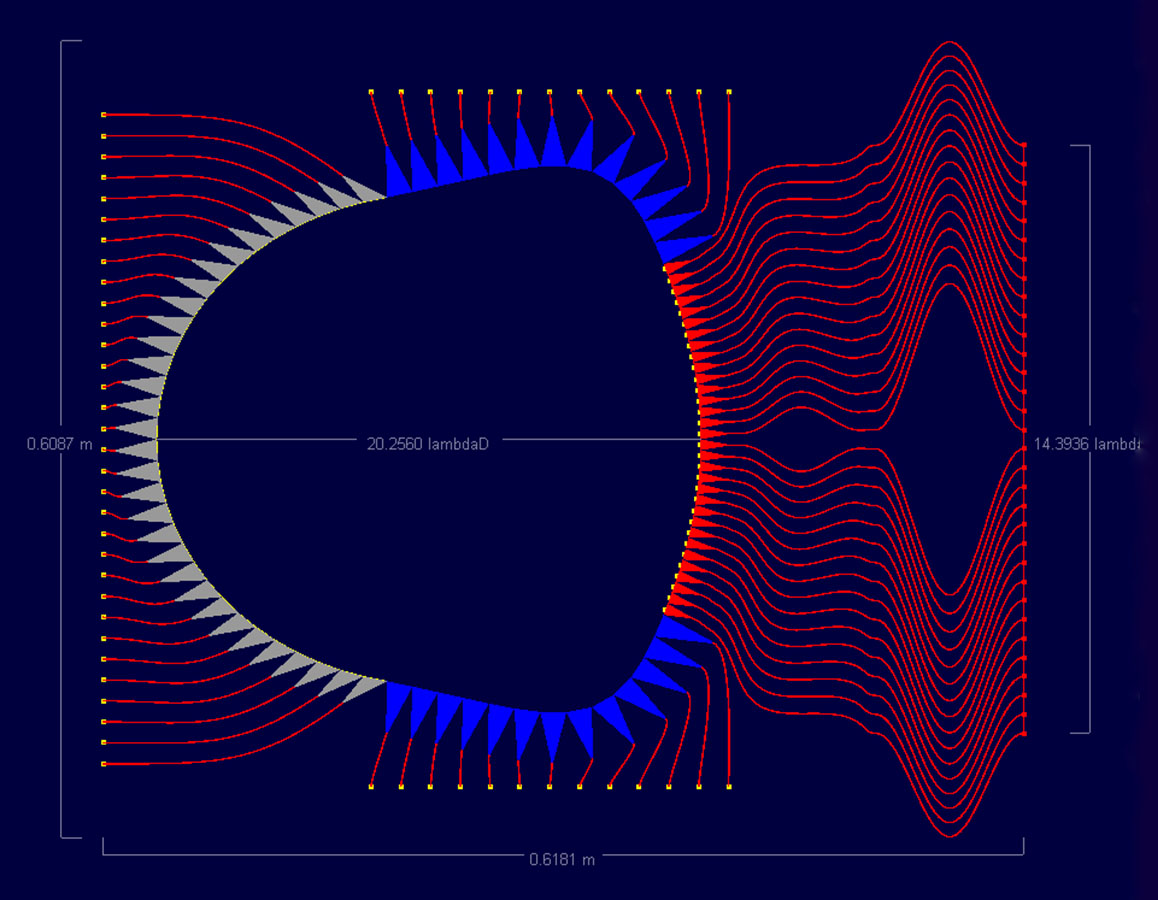
Figure 31: Shown is the 32x32 port Rotman microstrip lens simulated in the software
Figures 32, 33, and 34 display the maximum scan beam from port 1 for sidewall curvatures of 0.25, 1.25, and 2.5. There is a visible offset in the main beam location which improves with higher curvature; however, it never matches the ideal case exactly. The side lobe levels remain below -10 dB but are fairly high near the main beam. In the summary of all cases shown in Figure 35, it is evident there is a slight shift in the main beam location but the side lobes are fairly consistent between cases.
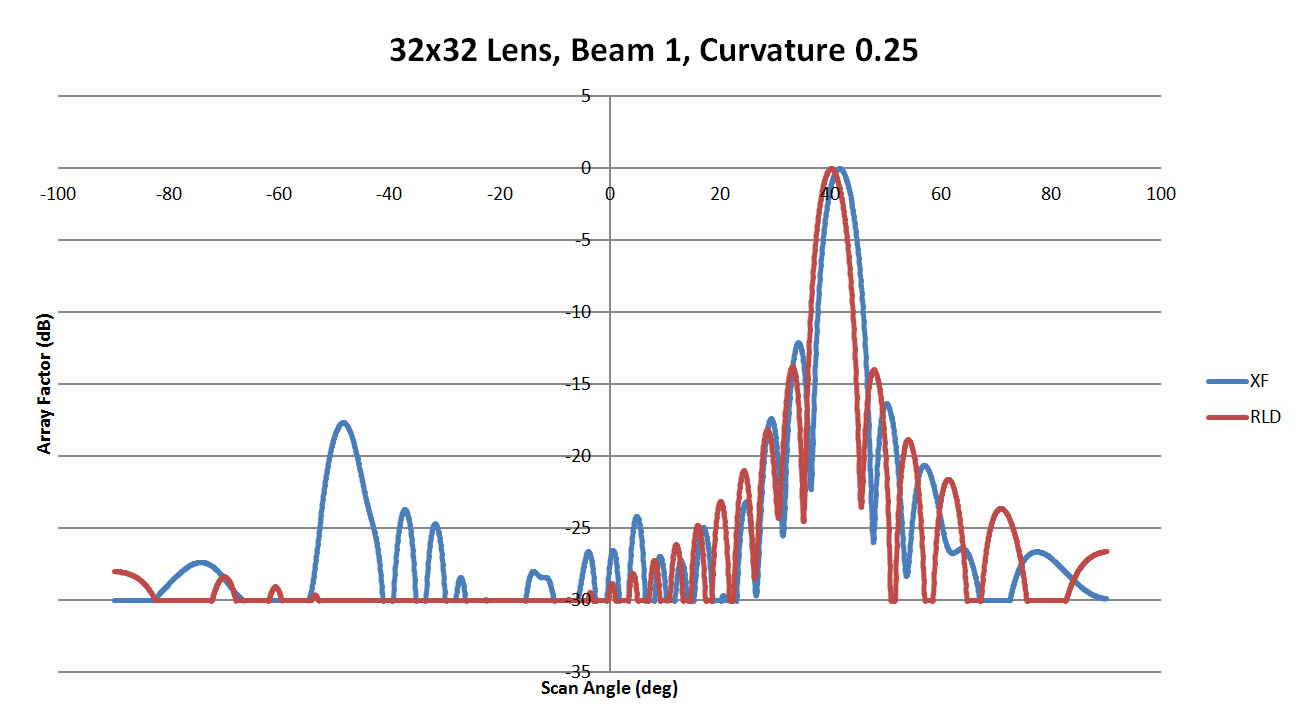
Figure 32: Shown is a comparison of the beam 1 patterns from XFdtd and RLD for a sidewall curvature of 0.25
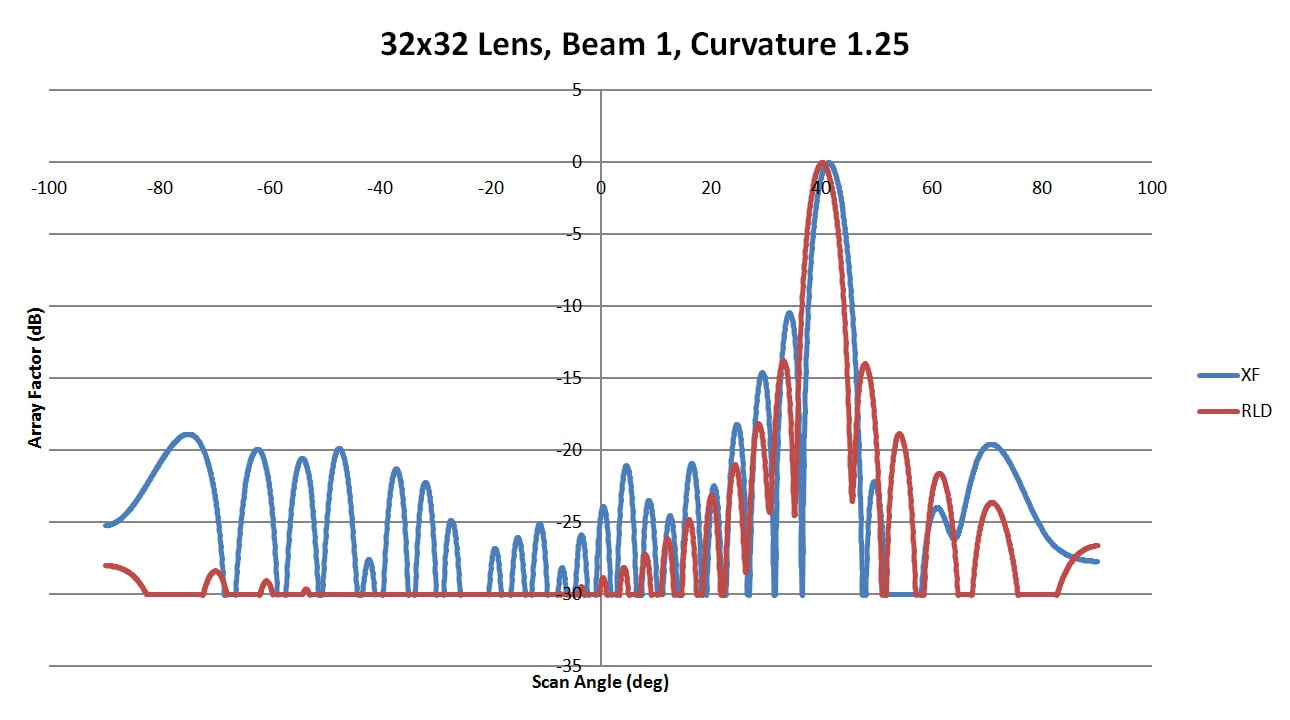
Figure 33: Shown is a comparison of the beam 1 patterns from XFdtd and RLD for a sidewall curvature of 1.25
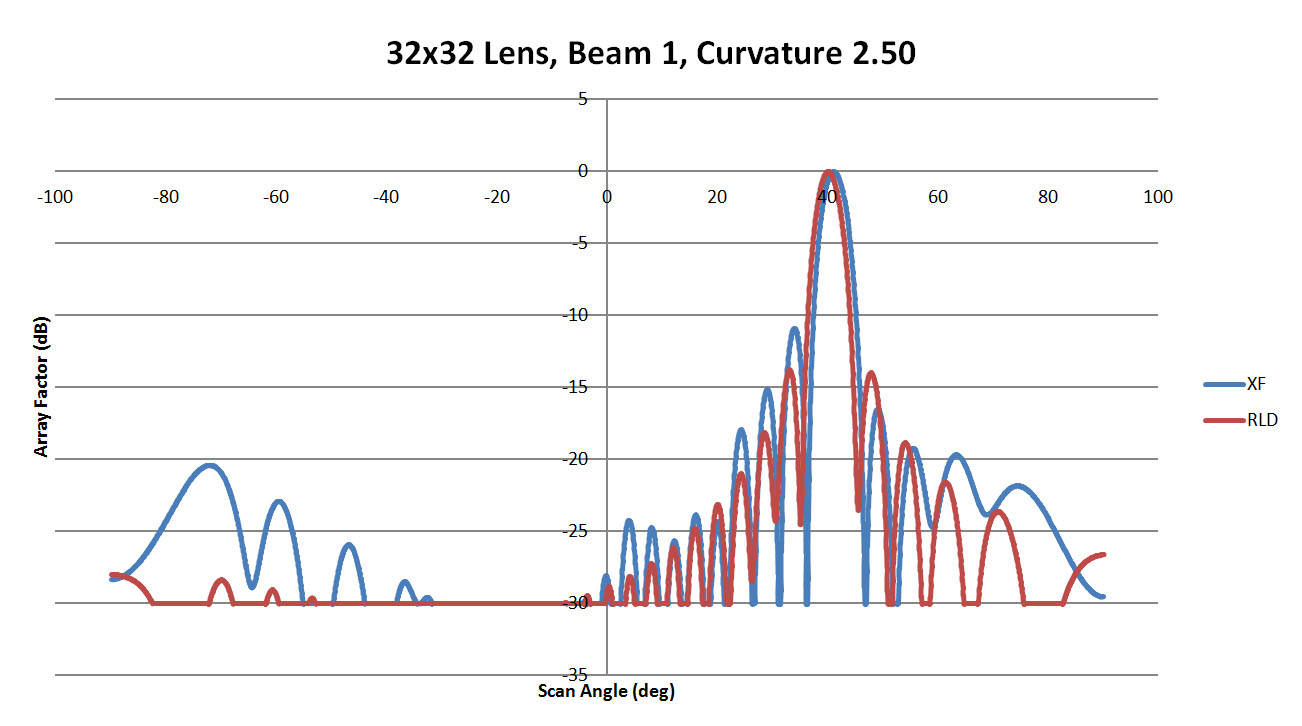
Figure 34: Shown is a comparison of the beam 1 patterns from XFdtd and RLD for a sidewall curvature of 2.5
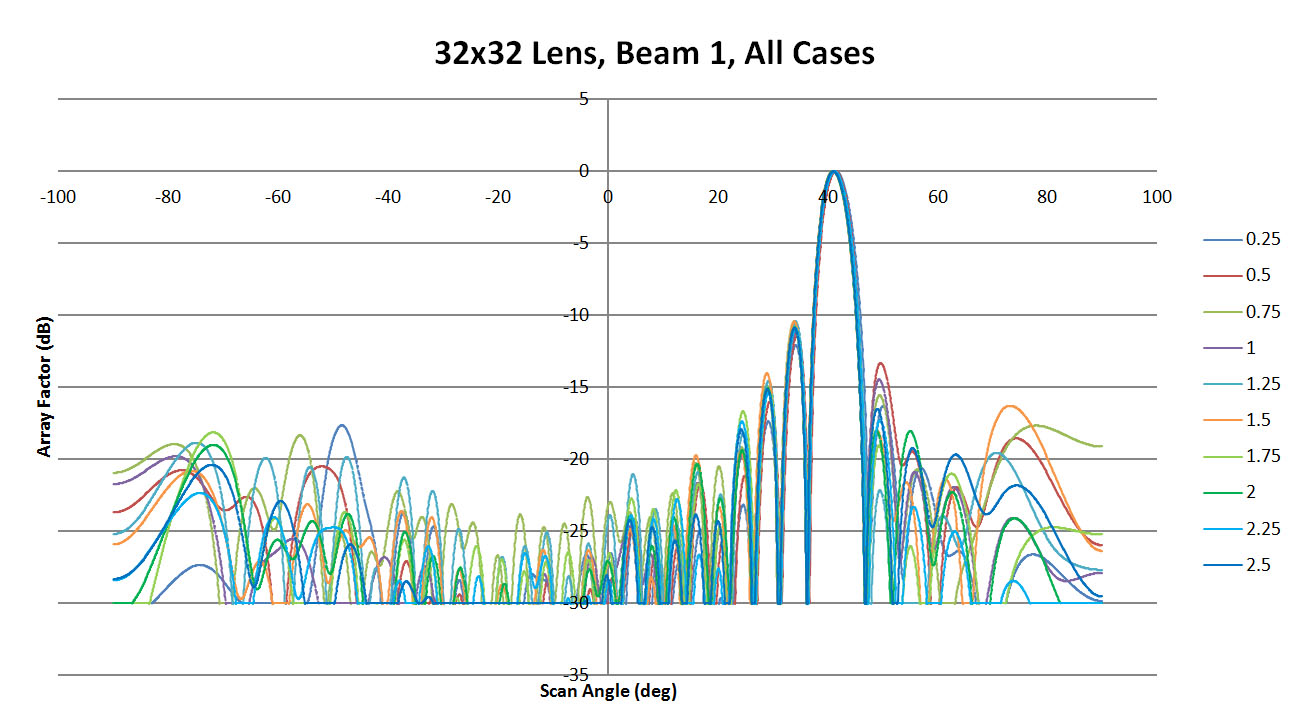
Figure 35: Shown are all the patterns generated for beam 1 by XFdtd for the different sidewall values
Beam 4 is shown in Figures 36, 37, and 38. There is again a slight shift in the beam location from the ideal case, but little variation between the XFdtd results. This is verified in Figure 39 where all cases are shown and the beam generated appears consistent. The side lobe levels are also fairly consistent between cases with only some outlying values for the lower curvature walls.
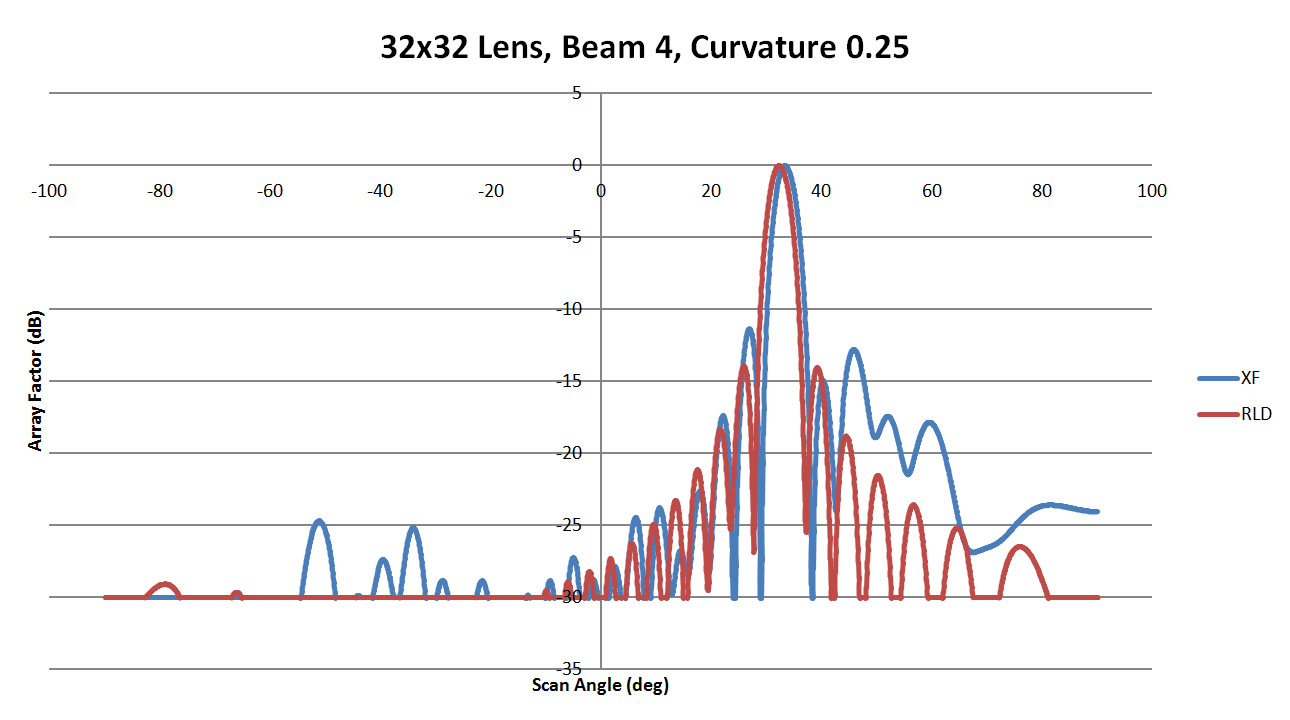
Figure 36: Shown is a comparison of the beam 4 patterns from XFdtd and RLD for a sidewall curvature of 0.25
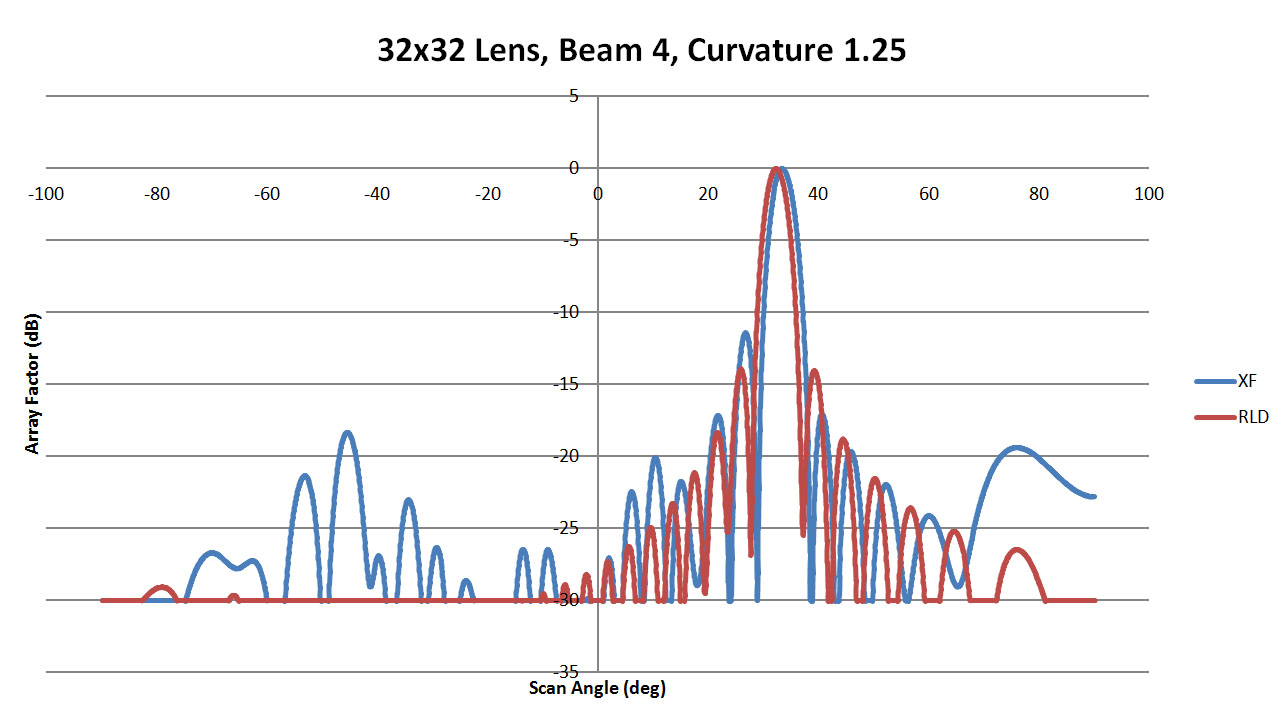
Figure 37: Shown is a comparison of the beam 4 patterns from XFdtd and RLD for a sidewall curvature of 1.25
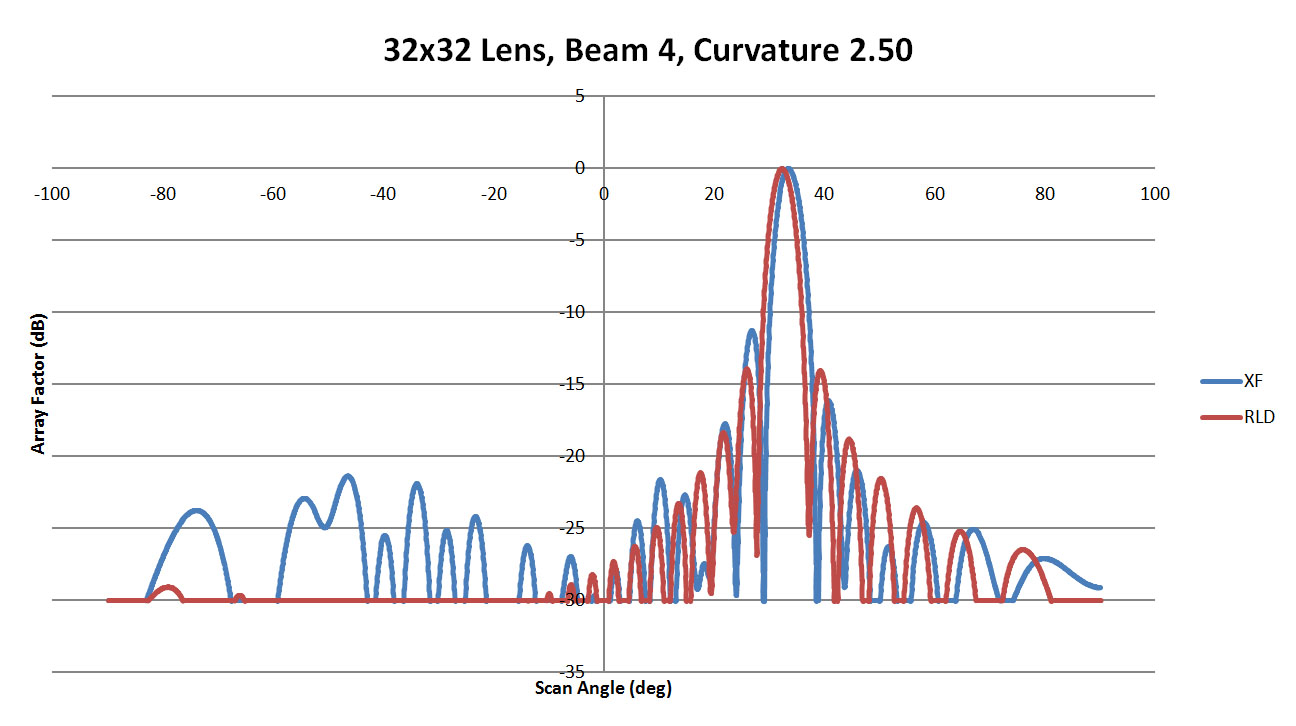
Figure 38: Shown is a comparison of the beam 4 patterns from XFdtd and RLD for a sidewall curvature of 2.5
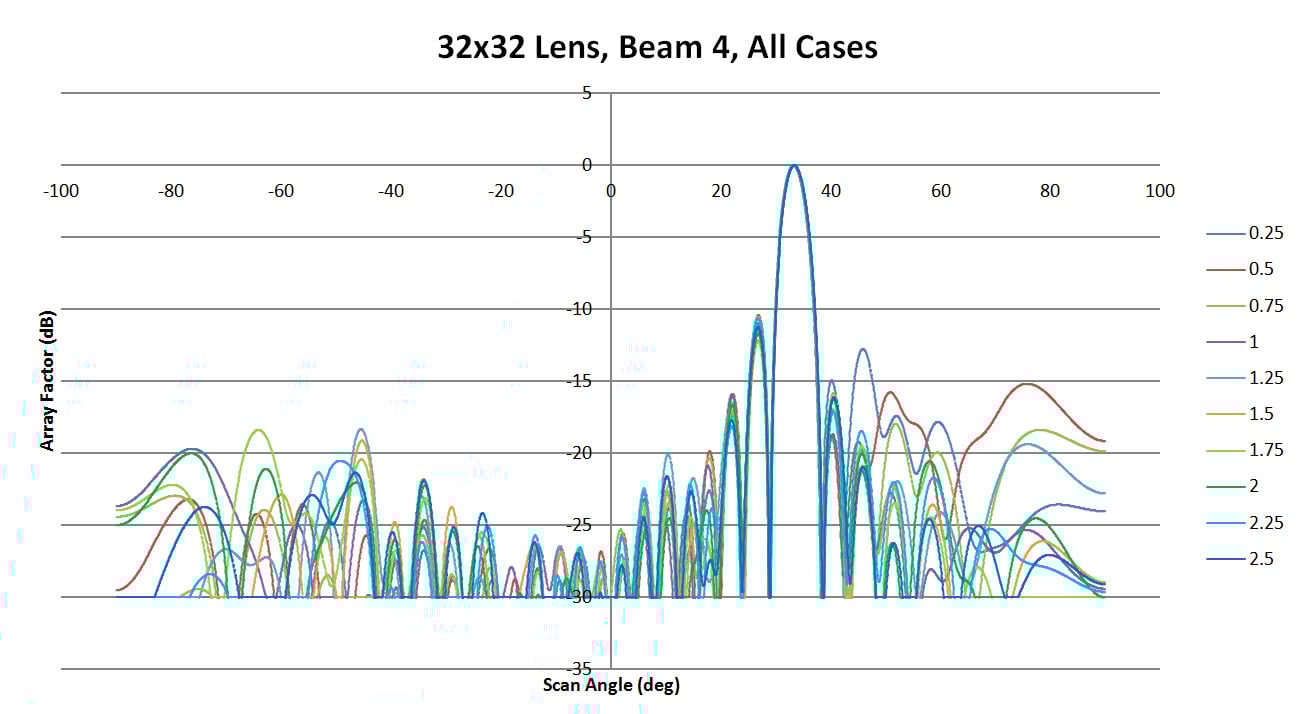
Figure 39: Shown are all the patterns generated for beam 4 by XFdtd for the different sidewall values
Similar behavior is seen for beam 8 shown in Figures 40, 41, 42, and 43. The slight offset in the main beam location remains but overall the various cases run in XFdtd produce similar results. In contrast, beam 12 shows a marked improvement in performance as the sidewall curvature increases. The main beam location remains consistent, but the higher sides visible in Figures 44 and 45 are greatly diminished in Figure 46. In Figure 47 the many cases show consistent behavior in the main beam region and out to +/-25 degrees, but beyond that range the side lobes produced are quite variable. Again, the side lobes remain below 10 dB down from the peak though.
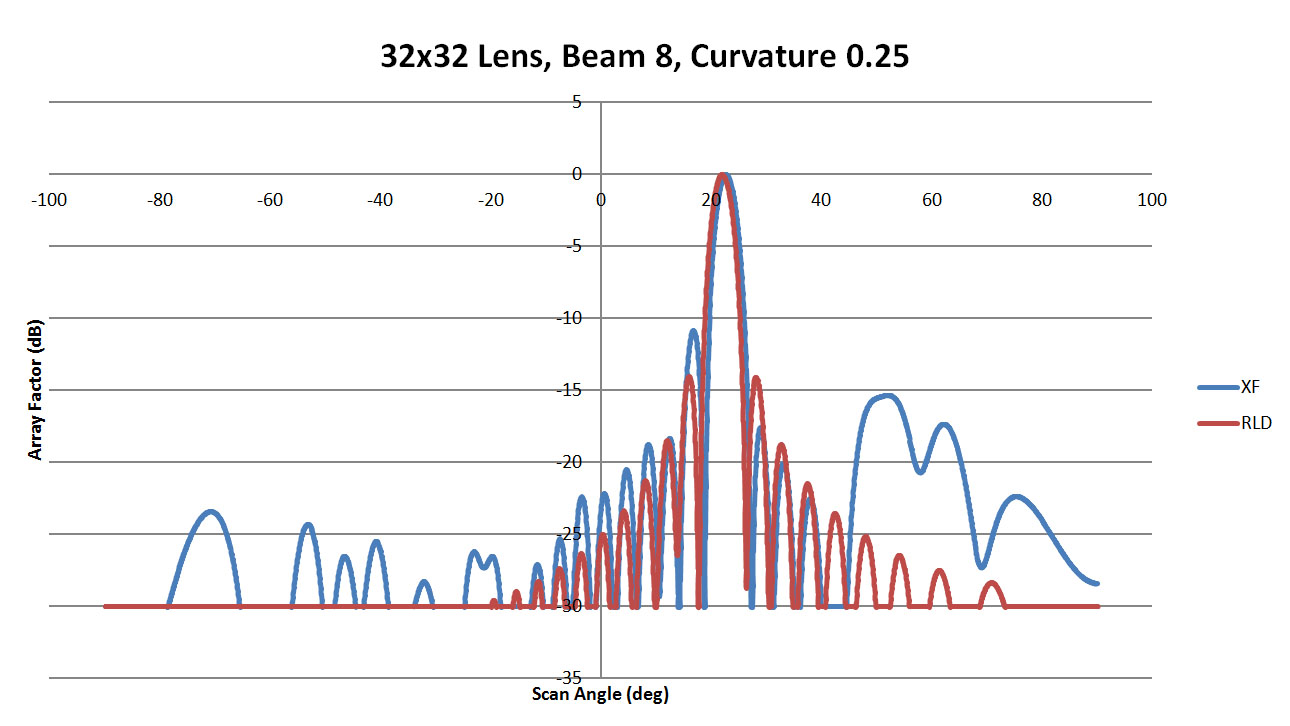
Figure 40: Shown is a comparison of the beam 8 patterns from XFdtd and RLD for a sidewall curvature of 0.25
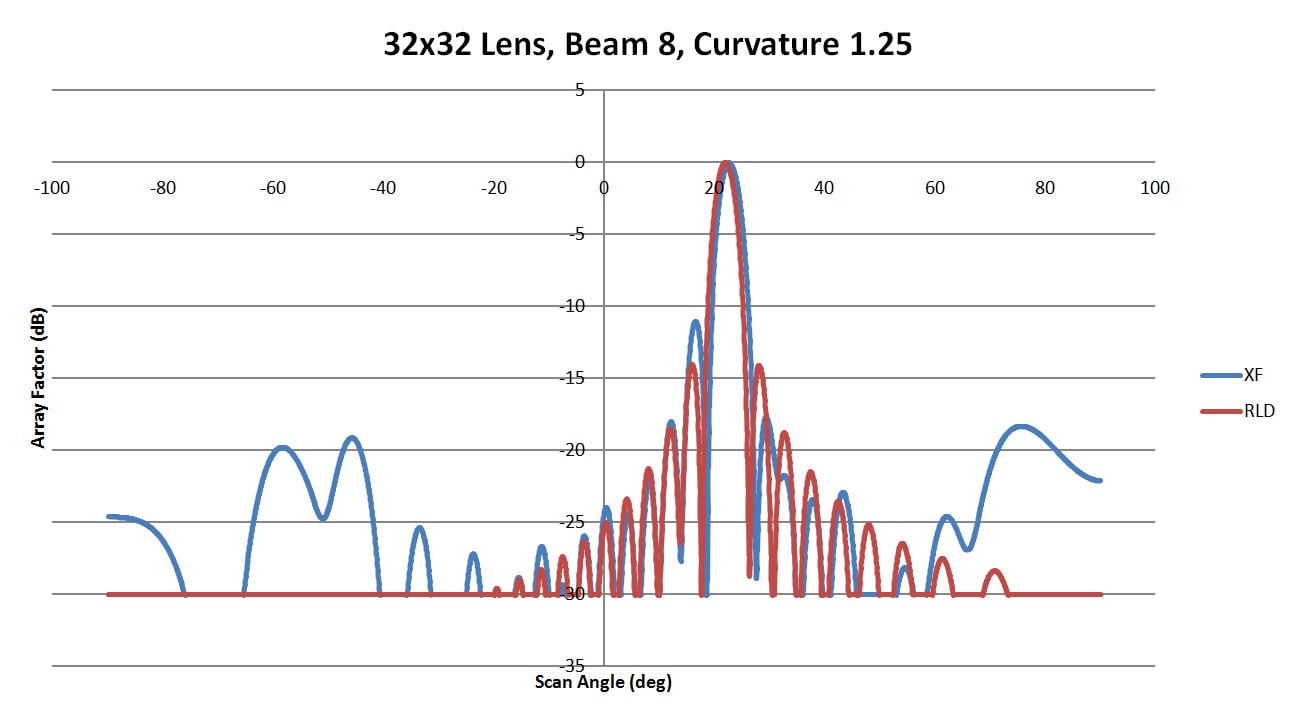
Figure 41: Shown is a comparison of the beam 8 patterns from XFdtd and RLD for a sidewall curvature of 1.25
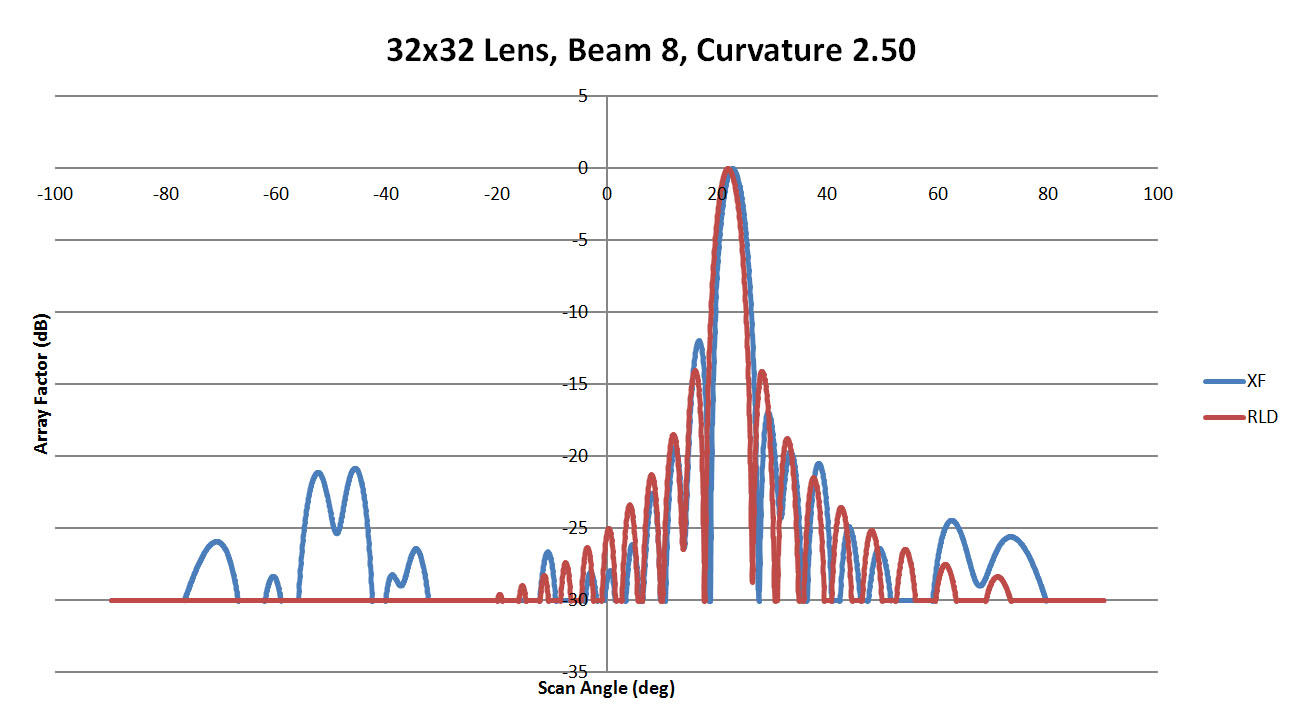
Figure 42: Shown is a comparison of the beam 8 patterns from XFdtd and RLD for a sidewall curvature of 2.5
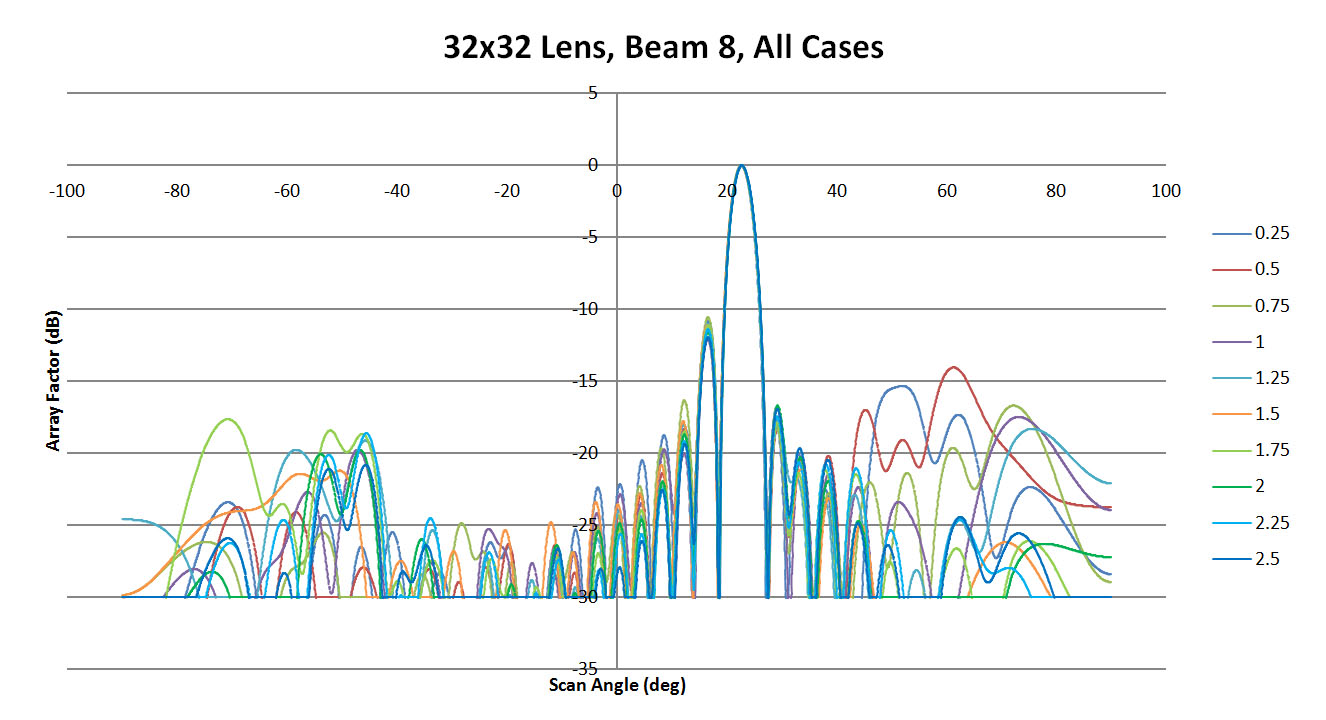
Figure 43: Shown are all the patterns generated for beam 8 by XFdtd for the different sidewall values
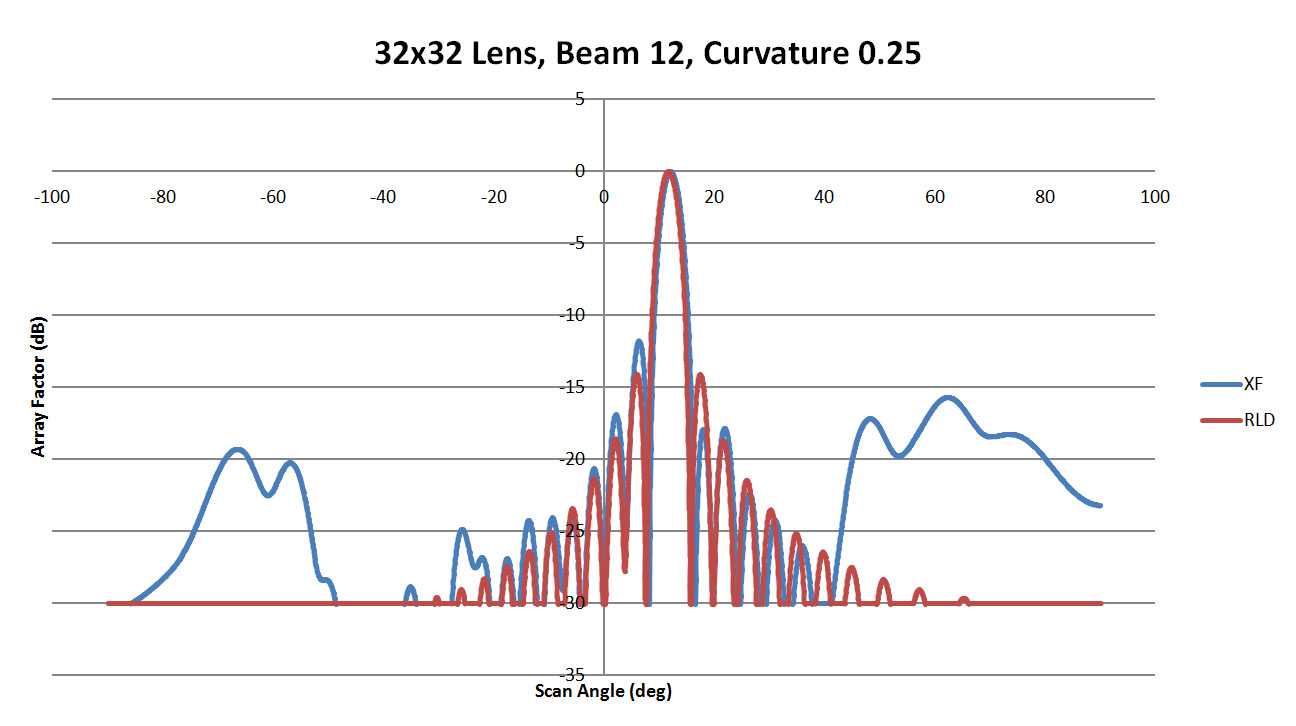
Figure 44: Shown is a comparison of the beam 12 patterns from XFdtd and RLD for a sidewall curvature of 0.25
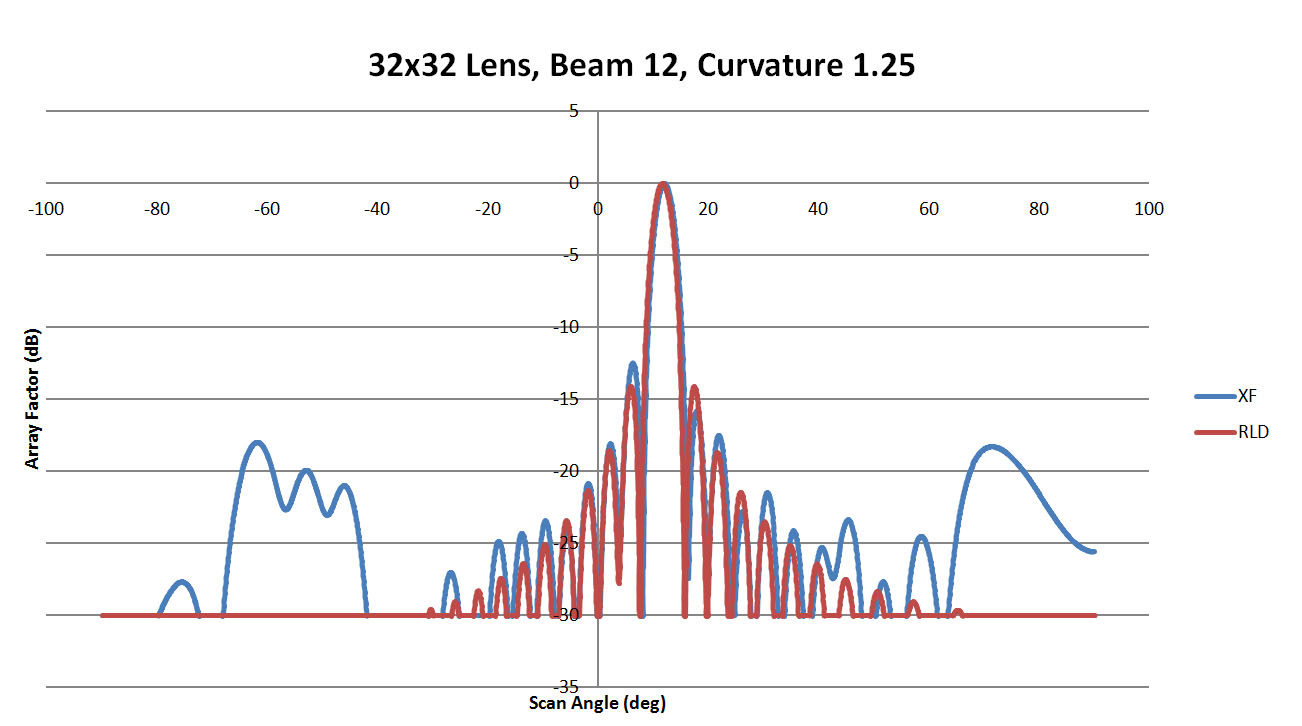
Figure 45: Shown is a comparison of the beam 12 patterns from XFdtd and RLD for a sidewall curvature of 1.25
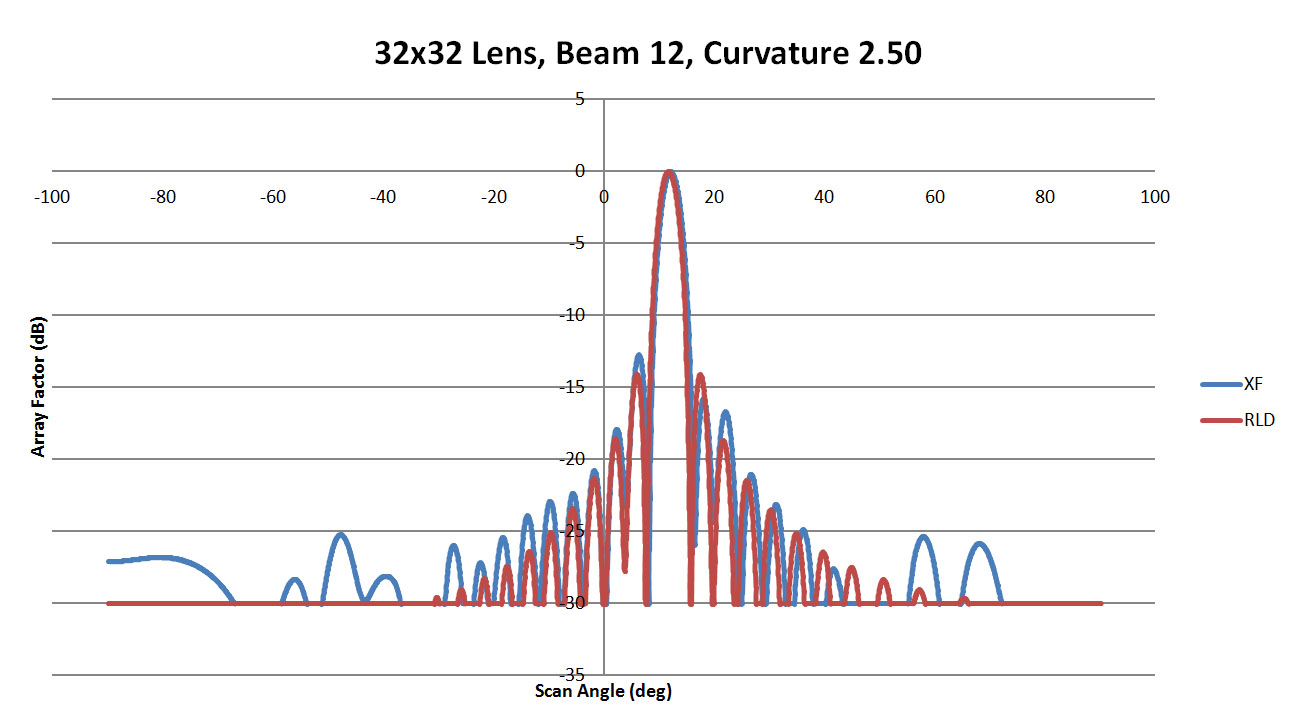
Figure 46: Shown is a comparison of the beam 12 patterns from XFdtd and RLD for a sidewall curvature of 2.5
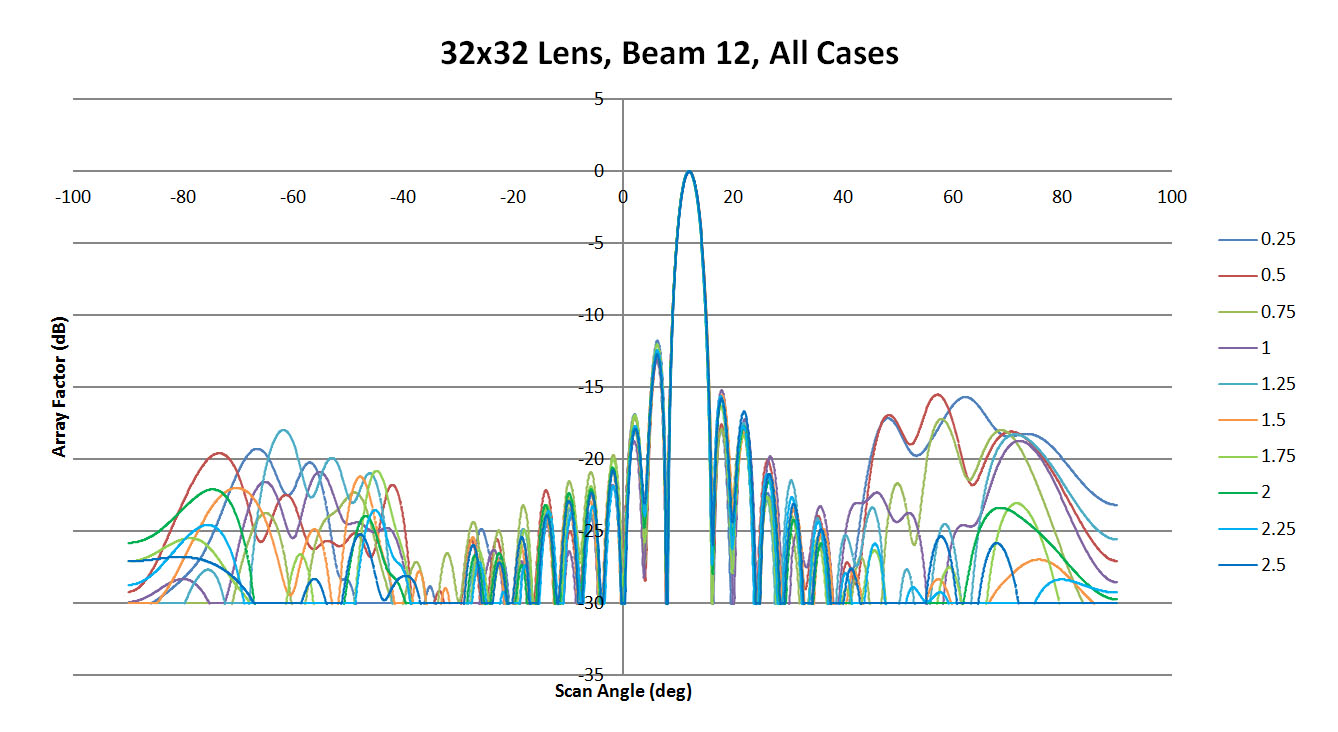
Figure 47: Shown are all the patterns generated for beam 12 by XFdtd for the different sidewall values
The final case of beam 16 has performance similar to beam 12 where the low curvature walls (Figure 48 and 49) have some larger side lobes while the highly curved wall of Figure 50 had better agreement with the ideal case. A review of all cases shown in Figure 51 is similar to beam 12 as well where the central region of the beam pattern is consistent and the variability appears in the far scan angles.
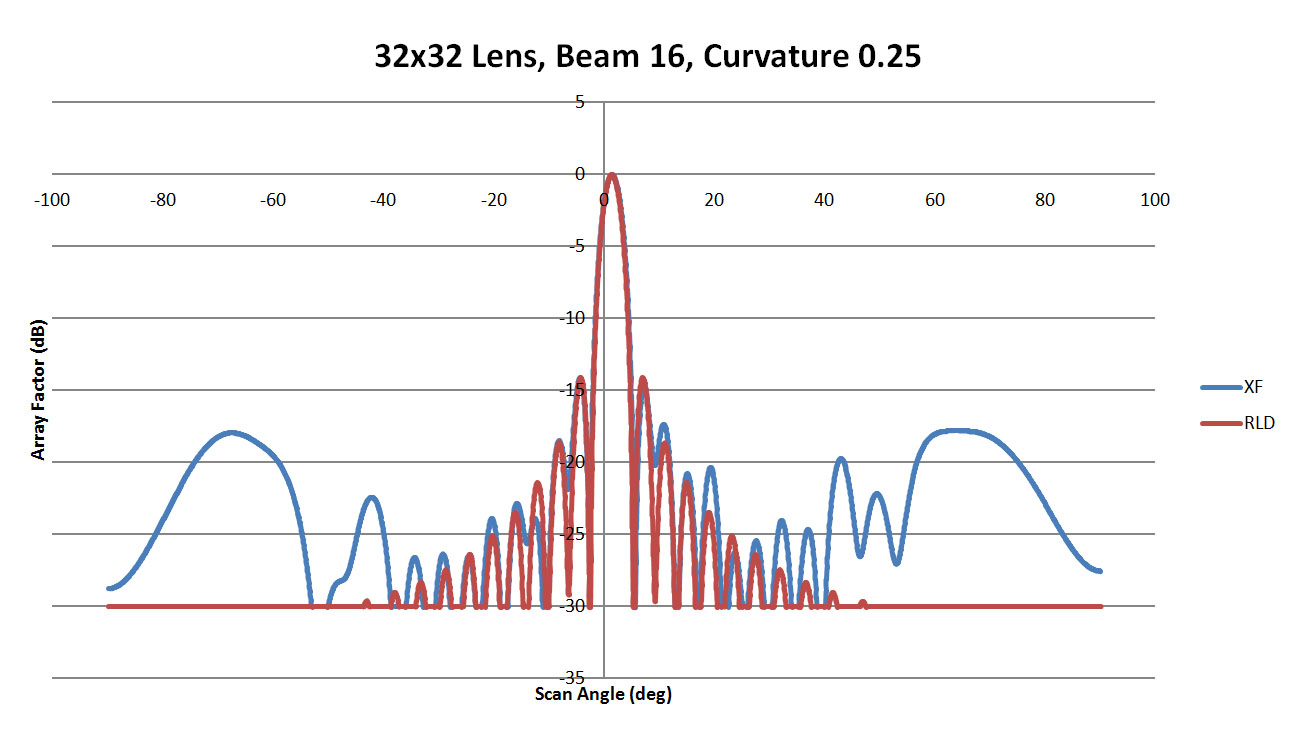
Figure 48: Shown is a comparison of the beam 16 patterns from XFdtd and RLD for a sidewall curvature of 0.25
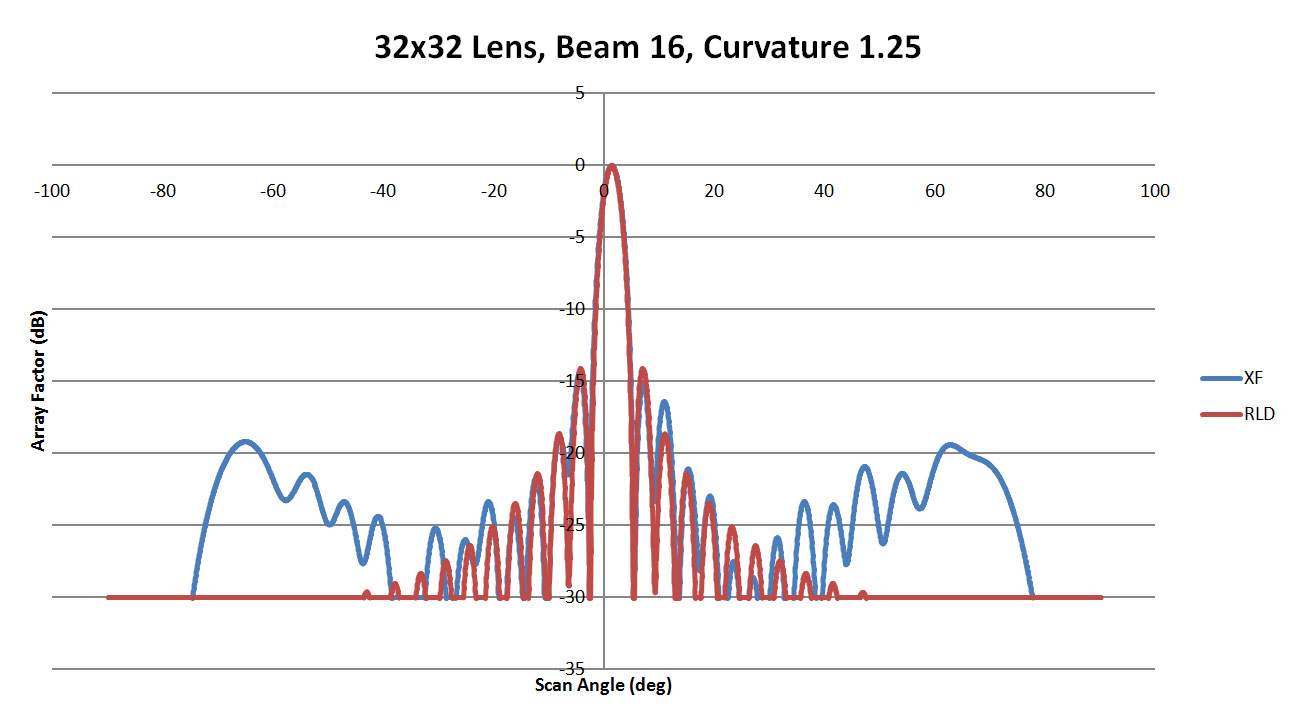
Figure 49: Shown is a comparison of the beam 16 patterns from XFdtd and RLD for a sidewall curvature of 1.25
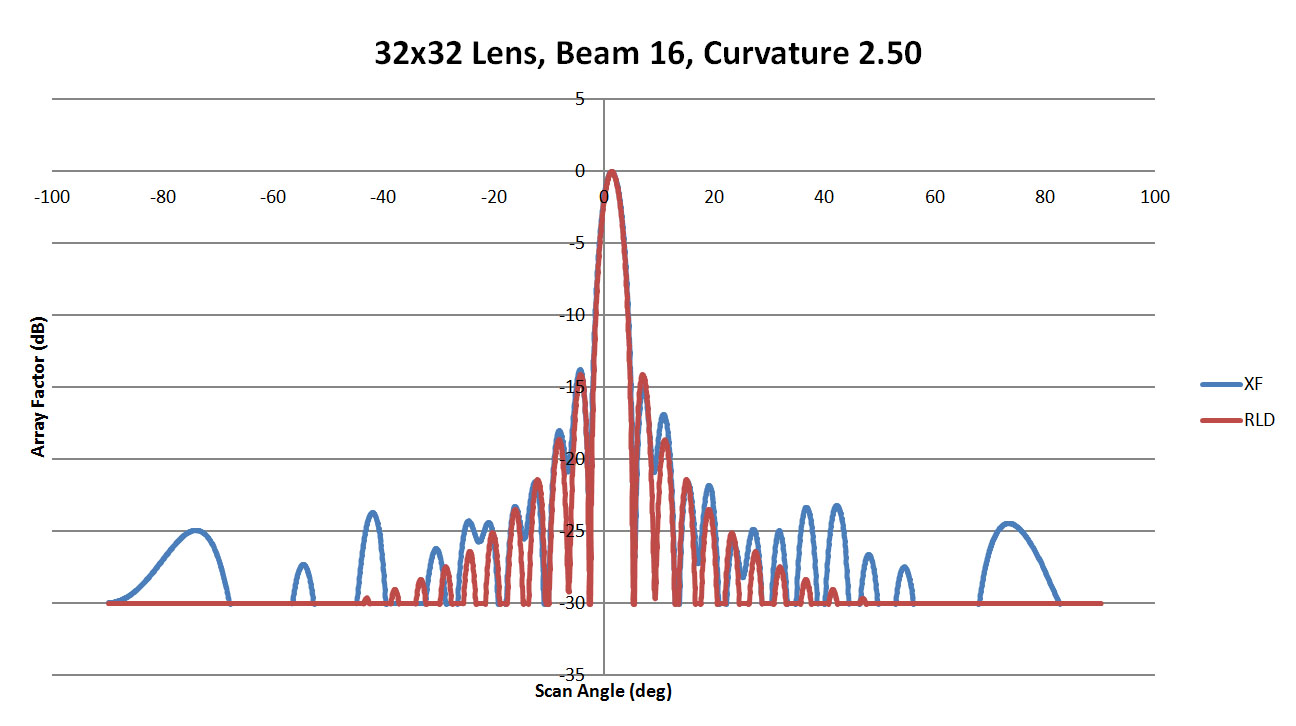
Figure 50: Shown is a comparison of the beam 16 patterns from XFdtd and RLD for a sidewall curvature of 2.5
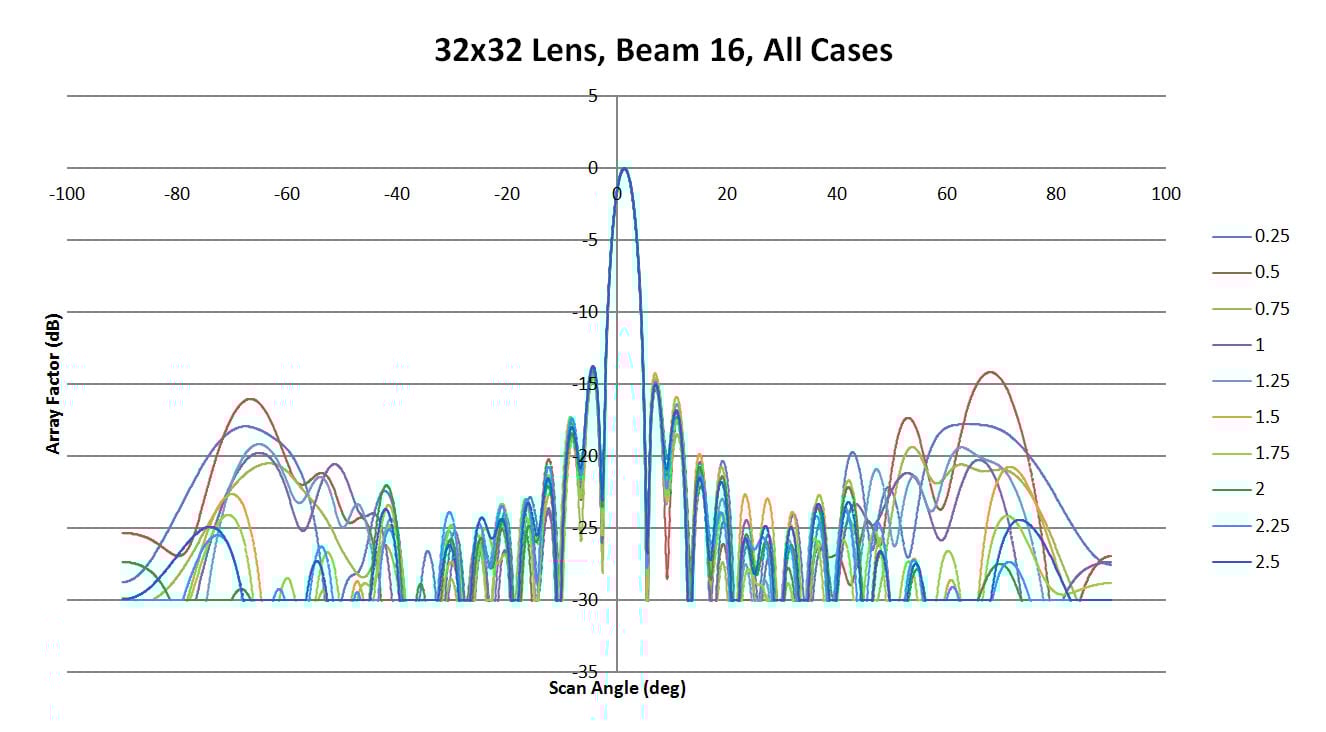
Figure 51: Shown are all the patterns generated for beam 12 by XFdtd for the different sidewall values
The peak side lobe levels for all beams simulated are shown in Figure 52. As with prior lenses, the higher scan angle beams produce larger side lobes. The side lobe peaks don't show great variation with sidewall curvature though but rather remain fairly consistent for each beam. Finally in Figure 53 the offset of the main beam from the ideal RLD case can be seen to have very little dependence on the sidewall curvature. There is a fixed error in the results for each beam which appears unrelated to the sidewalls. This is investigated further in other examples.
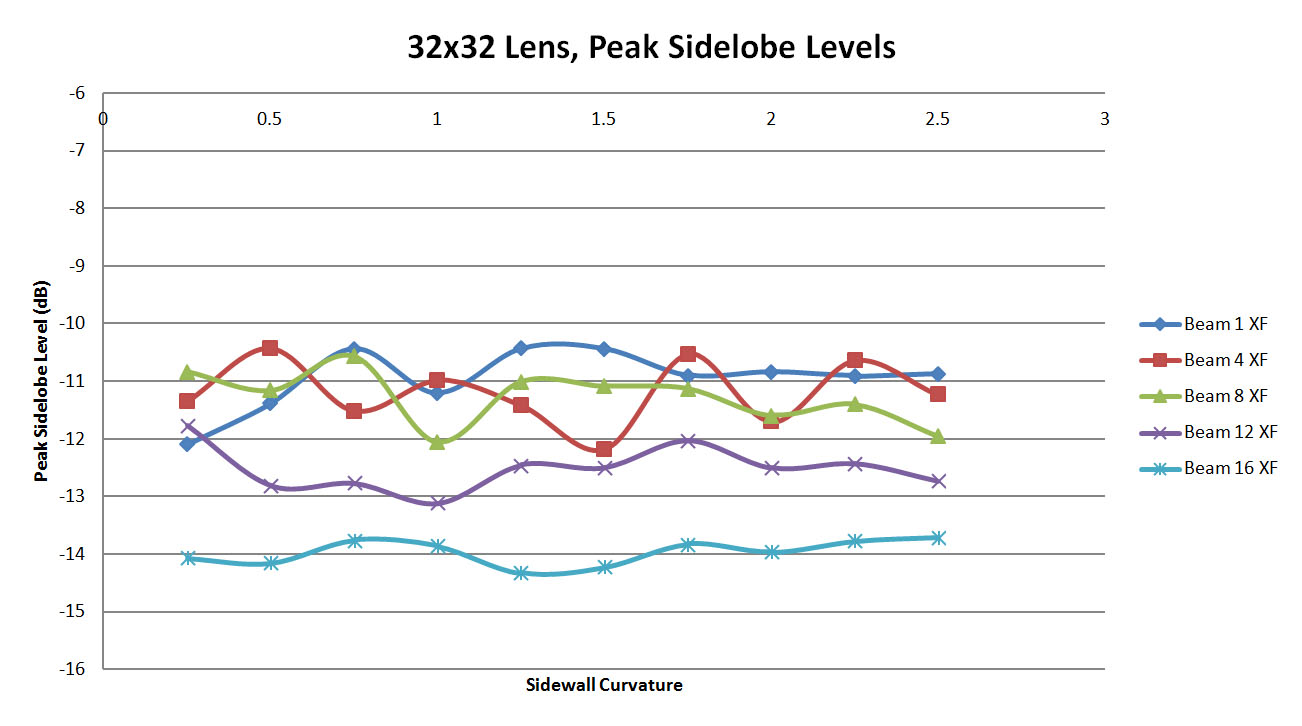
Figure 52: Shown are the peak side lobe levels generated for each case by XFdtd. The RLD levels are omitted for clarity. There is little variation in the peak levels with sidewall curvature indicating that the sidewalls are less of a factor for this larger lens
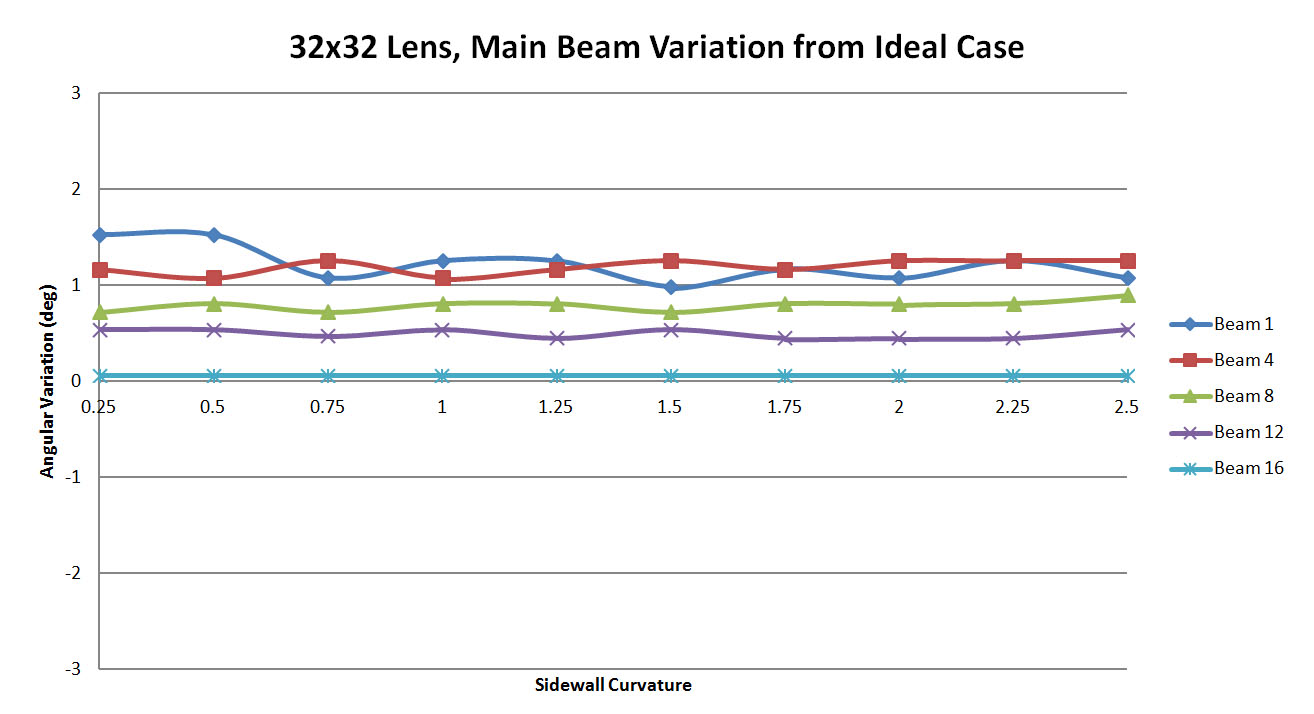
Figure 53: A plot of the offset in the XFdtd generated beam as compared to the RLD beam. For each case there appears to be a fixed offset which is not impacted by the sidewall curvature
Conclusion
In this example several Rotman lenses were simulated with varying sidewall curvature to gauge the impact of the curvature on the beam pattern results generated in a full wave solver as compared to the ideal beams produced by the RLD software. For the smaller lenses it was clear there is some variation in results that is strongly tied to the sidewall curvature. As the lenses became large, the beams became fairly independent of the sidewalls. Of course there were variations in the side lobes produced in every case; in general they were always of a relatively low level. Certainly in cases where the side lobe level must be lower, an appropriate lens design would be selected.
This example focused on the beam pattern generated by the lens as a function of the sidewall curvature and did not account for other effects in the design or output. It was found that a curvature around 2 was best for smaller lenses while the larger lenses performed similarly for any sidewall value.
Reference
-
Rotman, W. and R. Turner, "Wide-Angle Microwave Lens for Line Source Applications," IEEE Transactions on Antennas and Propagation, vol. 11, no. 6, pp. 623-632, Nov. 1963.
-
Hansen, R. C., "Design Trades for Rotman Lenses," IEEE Transactions on Antennas and Propagation, vol. 39, no. 4, pp. 464-472, April 1991.