Antenna Performance Simulation of a Probe for Thermal Ablation
A double slot choked antenna developed for hepatic microwave ablation (tumor treatment) is simulated in XFdtd to determine antenna performance and the effectiveness of the device for treating deep-seated tumors. The study is based on the published paper by Bertram et. al. [1] which described the return loss and SAR distribution of the antenna while in bovine liver tissue. In addition to repeating those results, the thermal solver of XF is used to determine the temperature rise of the liver tissue caused by radiation from the antenna.
The antenna is a probe intended to be inserted into a liver for the purpose of burning tumor tissue that is difficult or impossible to remove by other means. The antenna consists of a coaxial line with two slots near the tip and a copper choke which acts as a balun. The entire antenna is covered by a dielectric catheter. The CAD representation of the antenna is shown in Figure 1, where the catheter is semi-transparent to show the detail of the copper parts below. In Figure 2, a cross-sectional view of the antenna is shown as it is defined using PrOGrid Project Optimized Gridding in XF.
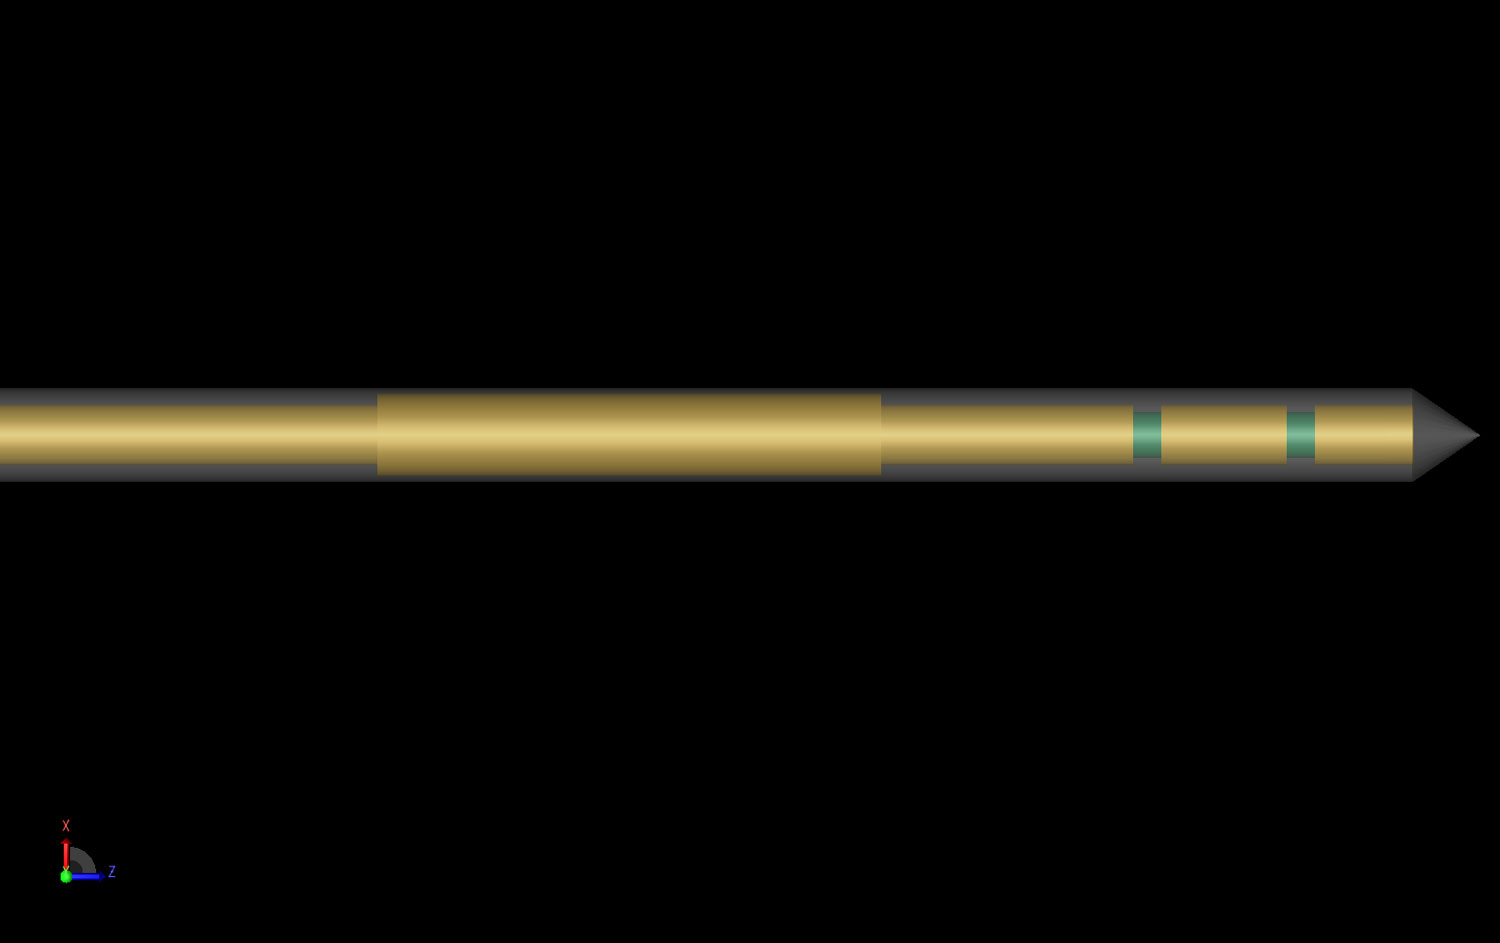
Figure 1: Shown is the CAD representation of the double slot choked antenna. The dielectric catheter is shown semi-transparent to allow viewing of the internal structure.
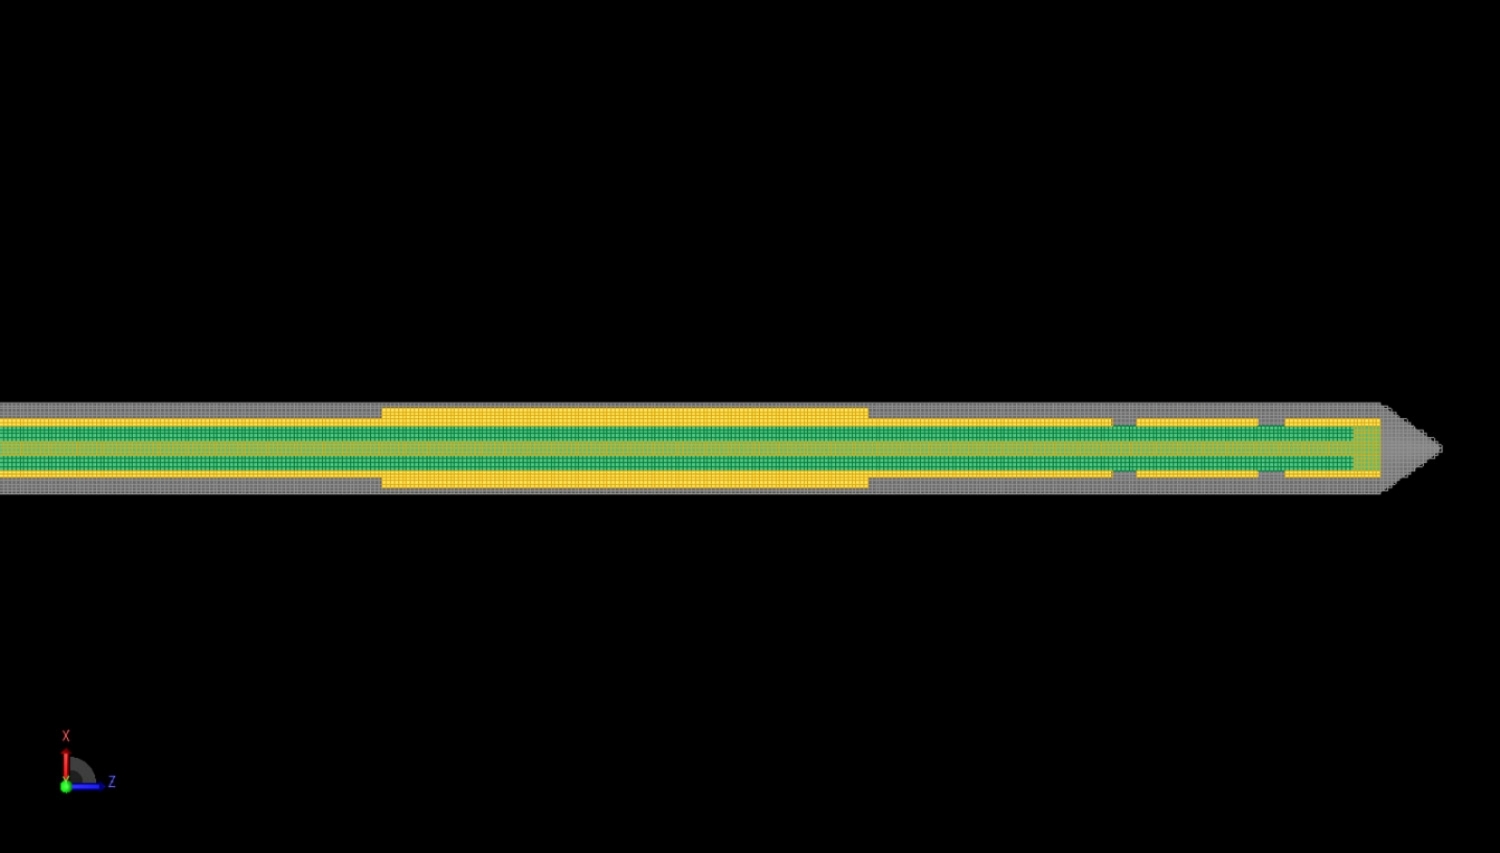
Figure 2: A cross-sectional view of the interior of the antenna is shown with the FDTD mesh displayed. Here the gridding is determined by PrOGrid.
The measured liver tissue electrical parameters were provided as two plots of conductivity and permittivity from 0 to 20 GHz. The discrete data points were digitized and input into the Dispersive Material Calculator feature in XF. This tool converts the measured conductivity and permittivity to a dispersive material profile for use in the electromagnetic simulation. The menu and plots of the input data and resulting curve fit for an XF material are shown in Figure 3.
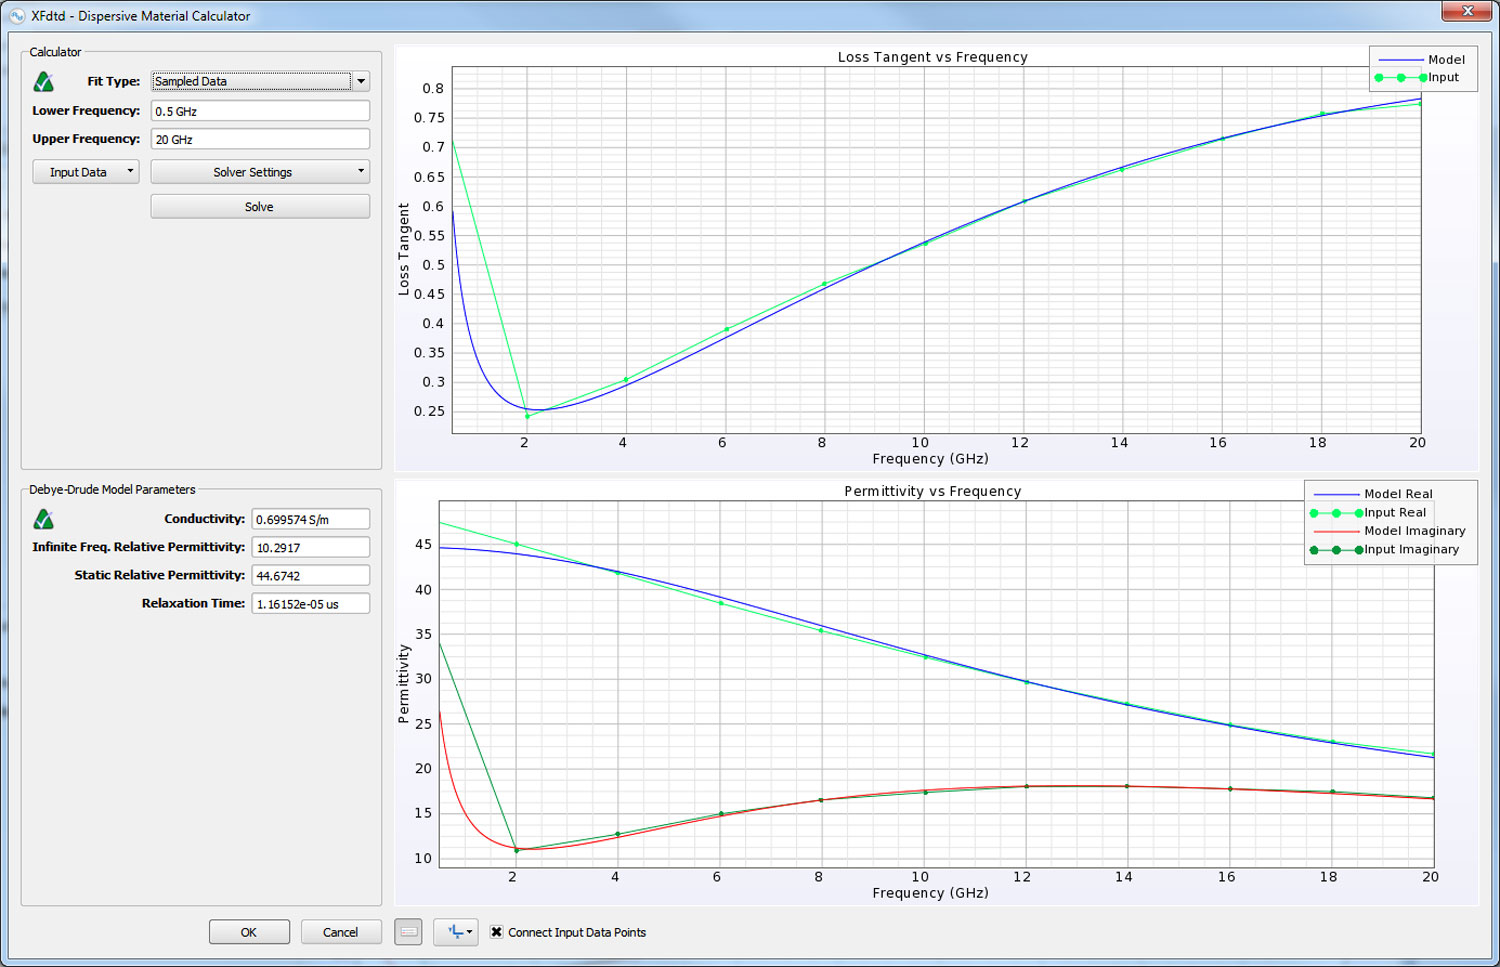
Figure 3: The Dispersive Material Calculator tool is shown with the parameters of the frequency dependent material for the liver tissue displayed. The liver conductivity and permittivity versus frequency are input into the tool and a dispersive material model usable in XF is defined using a curve-fitting algorithm.
The antenna is excited by applying a TEM mode source across the coaxial line. It is then placed in the center of a block of liver tissue with the parameters defined by the Dispersive Material Calculator. The simulated geometry is shown in Figure 4. Following a broadband simulation, the return loss shows an acceptable match at the design frequency of 2.45 GHz as shown in Figure 5.
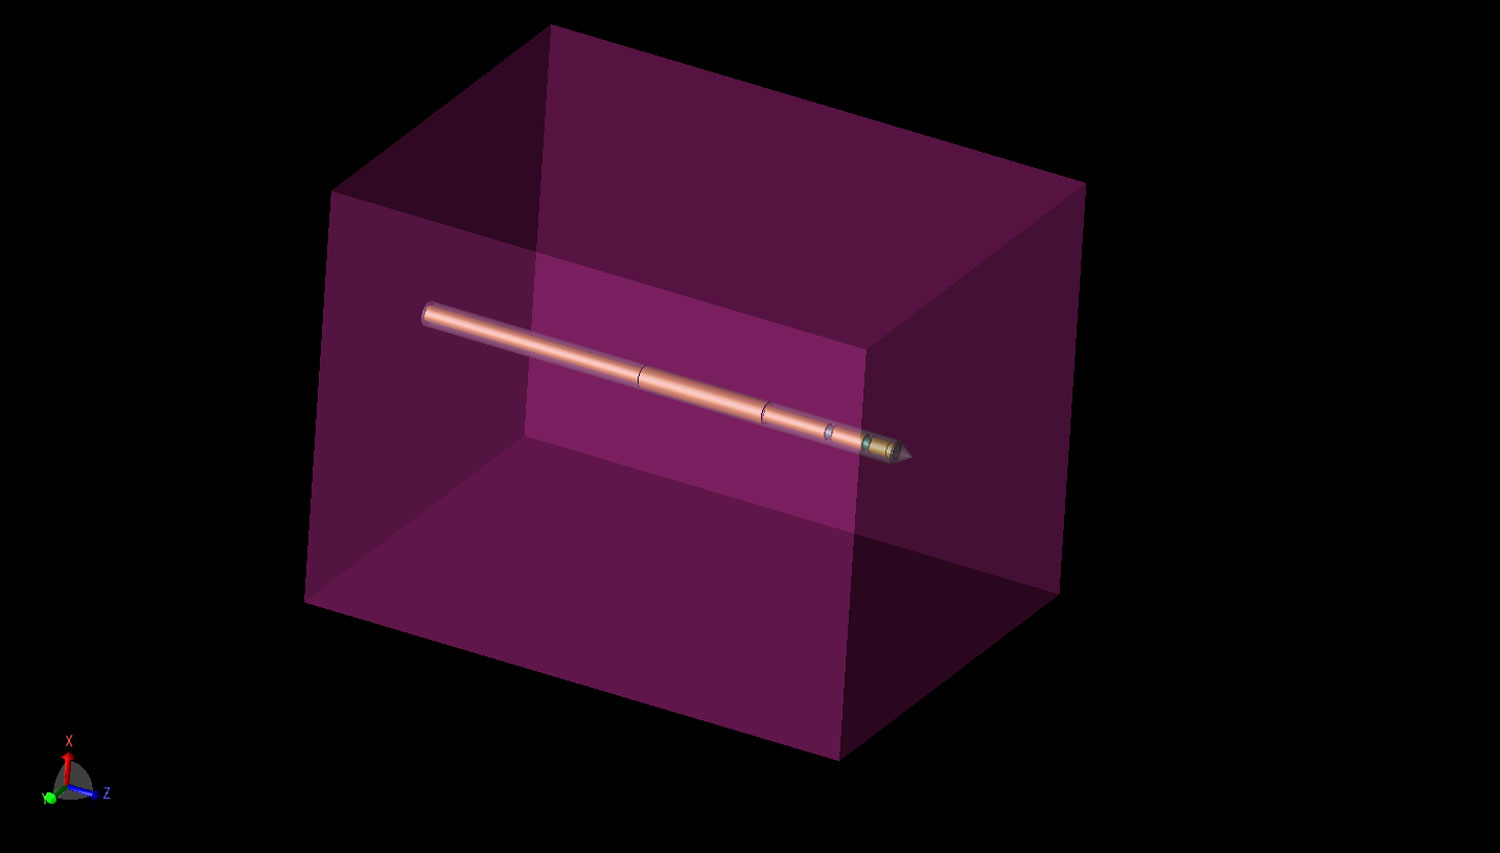
Figure 4: Shown is the entire geometry simulated, including the antenna and the surrounding liver tissue.
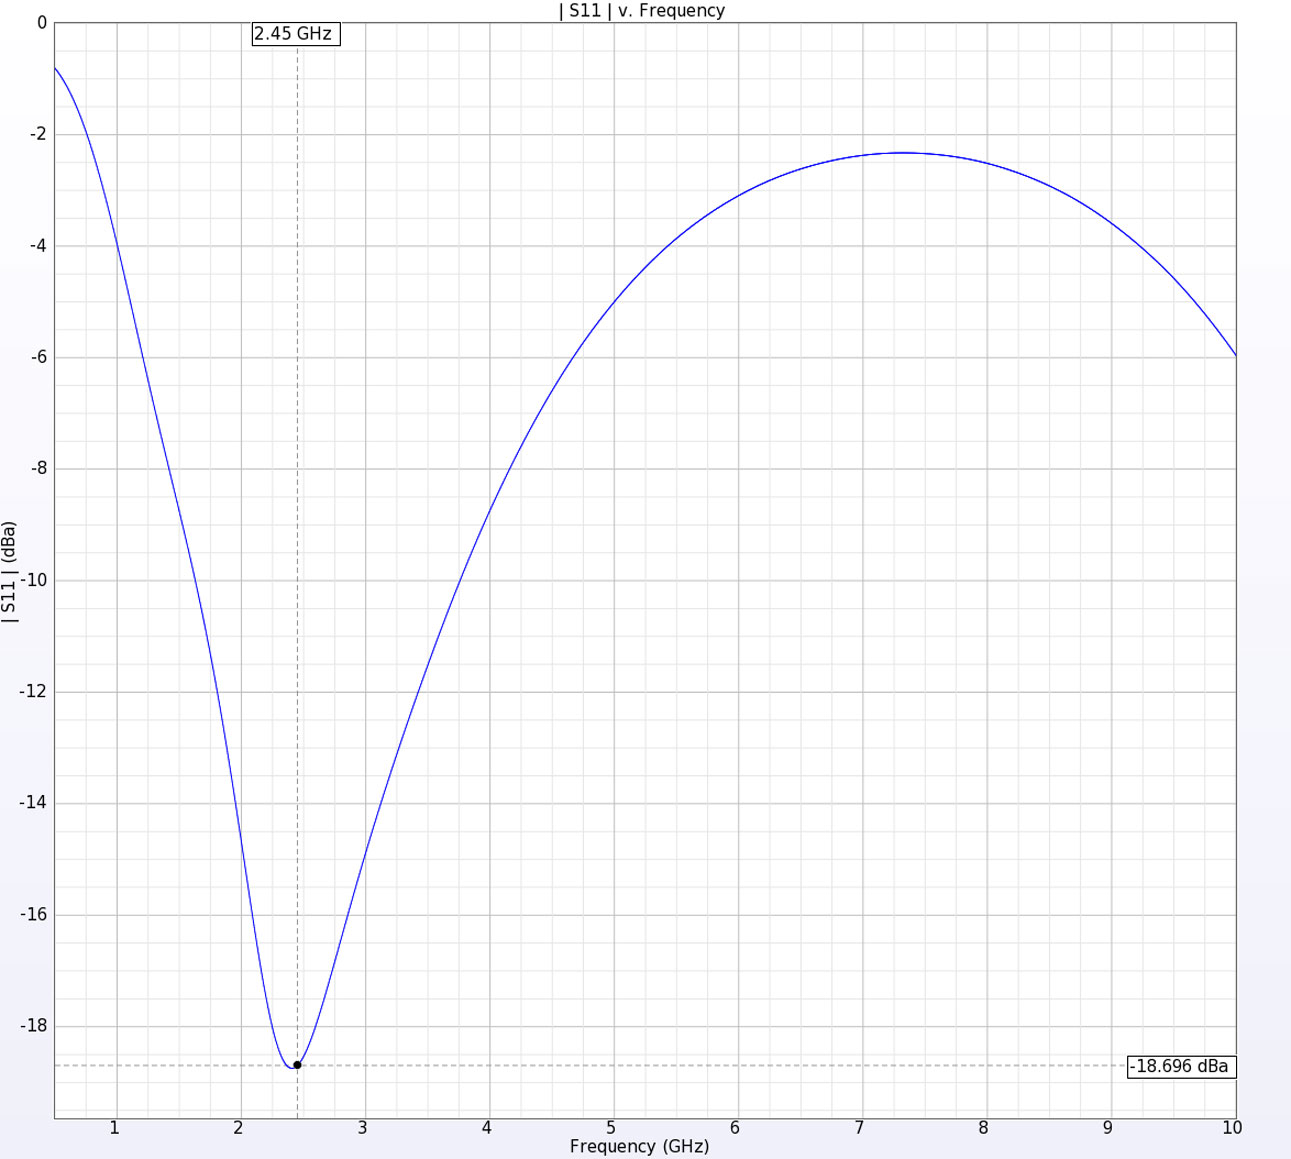
Figure 5: The return loss for the antenna shows acceptable performance at the intended design frequency of 2.45 GHz.
With the antenna design validated, a second simulation is performed at 2.45 GHz and the Specific Absorption Rate (SAR) data and the temperature rise are computed. The SAR indicates the amount of power absorbed in the tissue, in this case for 50 W of input power. A plot of the SAR in the cross section of the antenna is shown in Figure 6 in a linear scale of Watts/kg. A second plot is shown in Figure 7 for the SAR in a logarithmic scale showing 5 dB variation regions.
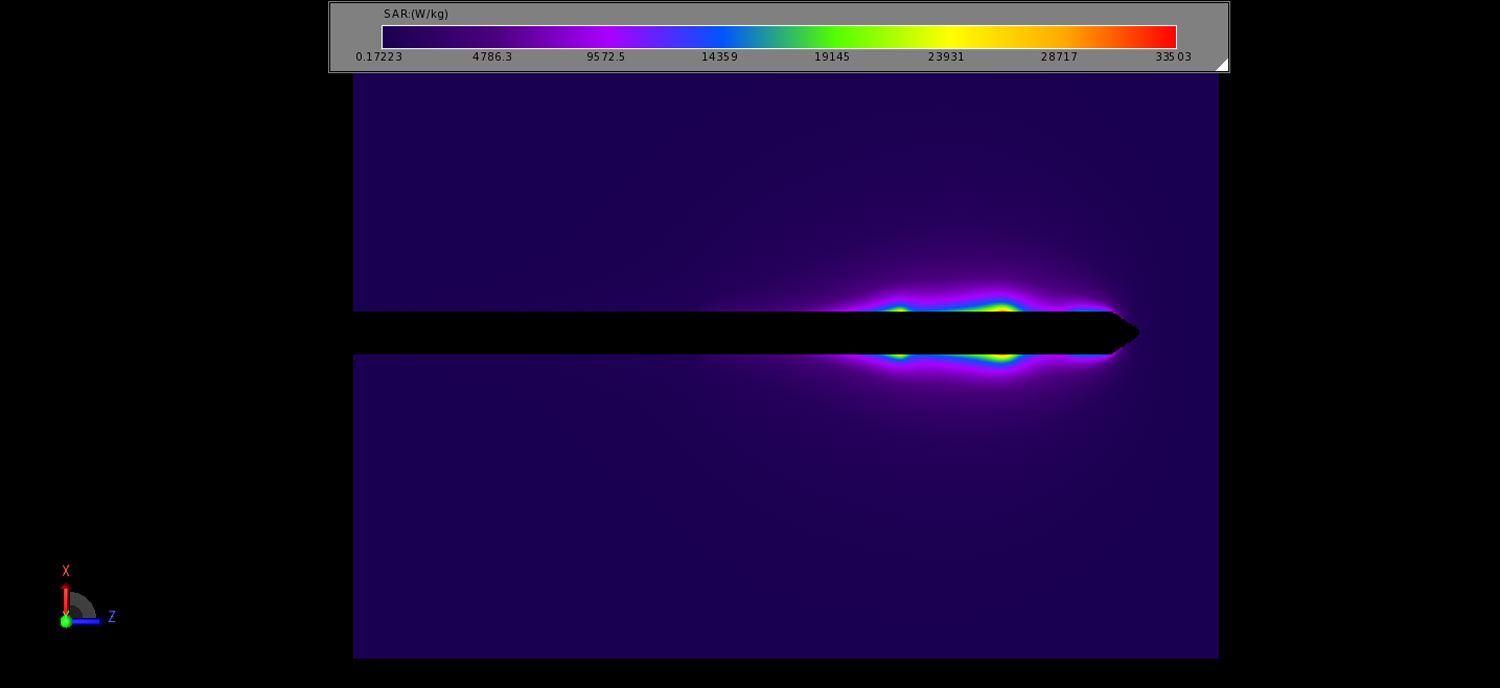
Figure 6: The Specific Absorption Rate (SAR) in the liver tissue for 50 W input power to the antenna is shown in a linear scale of Watts/Kg. The power absorbed is tightly bound to the radiating apertures of the antenna
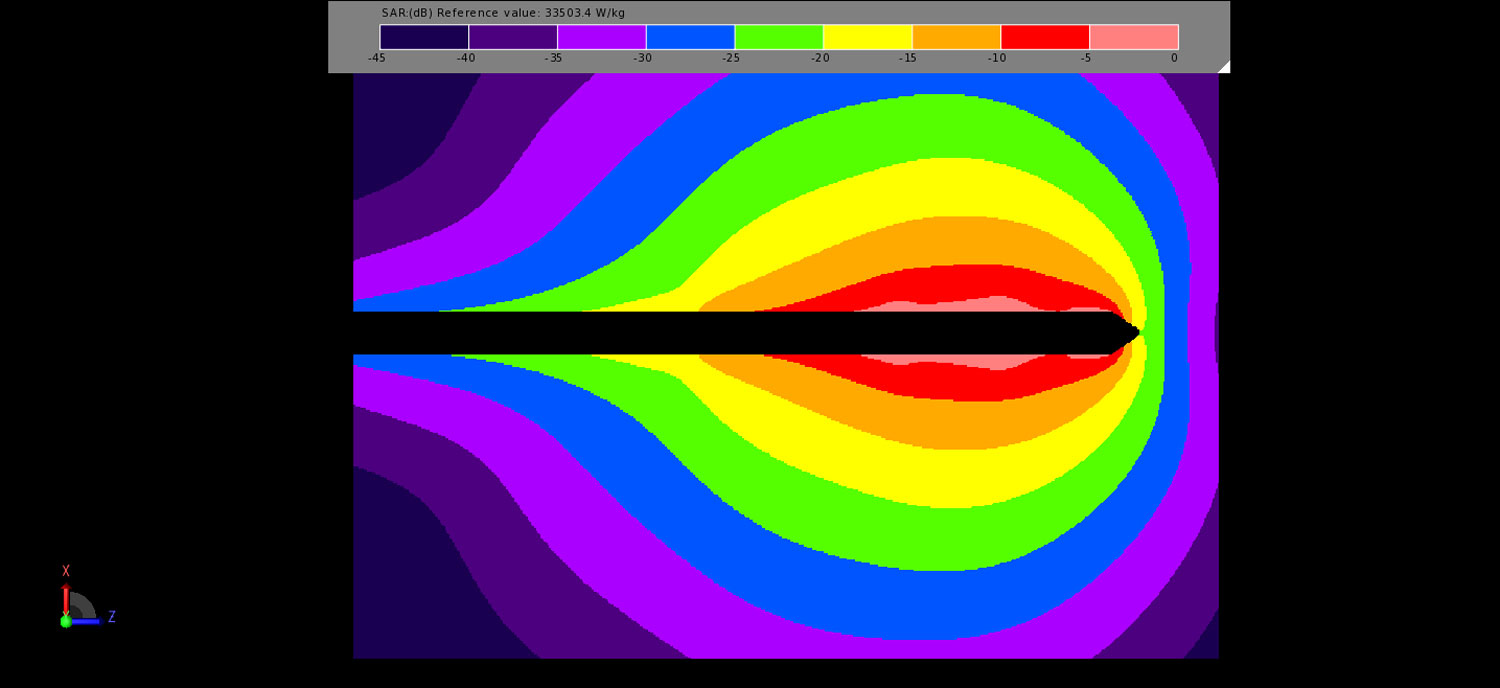
Figure 7: The Specific Absorption Rate (SAR) in the liver tissue for 50 W input power to the antenna is shown in a logarithmic scale where each color band represents a 5 dB drop.
The thermal simulation computes the temperature rise in the tissue from the absorbed power and includes the effects of conductive heat transfer between thermally connected materials, blood perfusion, metabolic processes, and general RF heating. In this example, the liver tissue is non-living and so the blood perfusion and metabolic processes are not included. The temperature rise from the 50 W source is plotted in Figure 8 and shows intense heating near the tip of the probe.
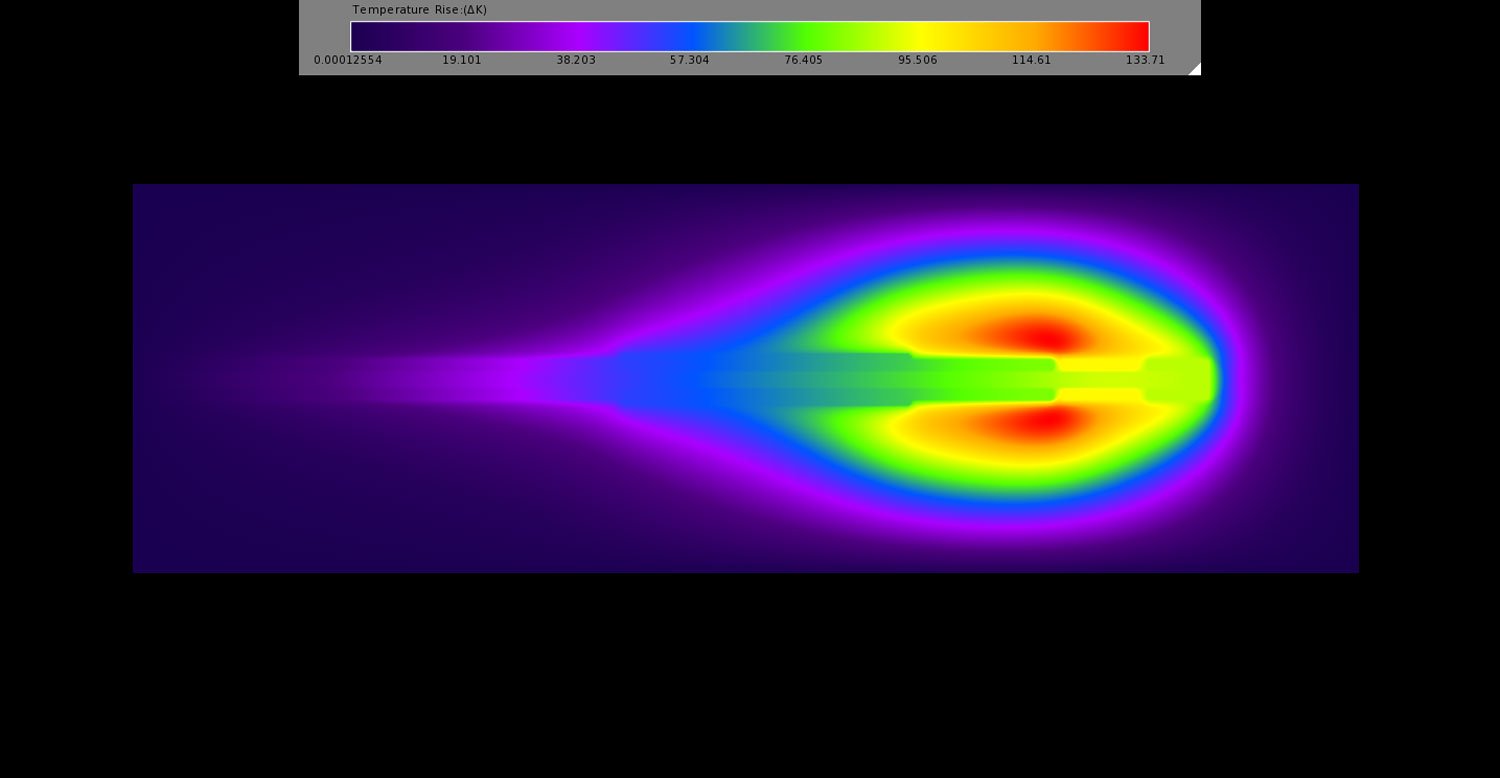
Figure 8: The temperature rise in the liver tissue for 50 W input power is shown. The maximum temperature increase appears near the tip of the antenna.
Reference
-
J.M. Bertram, D. Yang, M.C. Converse, J.G. Webster, and D.M. Mahvi, "Antenna design for microwave hepatic ablation using an axisymmetric electromagnetic model," BioMedical Engineering OnLine, 2006, 5:15.
