Introduction
There is an increasing demand for connectivity as networking capabilities are added to devices used in and around today’s homes. To maintain all the various connections, particularly in environments where signal-blocking obstacles might be moving through communication links, it is useful to have beamforming capabilities in network equipment to steer the signal path to one with better connectivity. Here a wireless fidelity smart speaker type of device for home networking is explored to demonstrate how different combinations of arrayed antennas at multiple frequencies may be used to beam steer patterns and maintain the best signal path. The MU-MIMO WiFi router explored will make use of arrays in the 2.4 and 5 GHz range typical of most 802.11a/b/g/n/ac devices and will also add coverage from 6 to 7 GHz for 802.11ax and the WiFi 6E band.
Device Design and Simulation
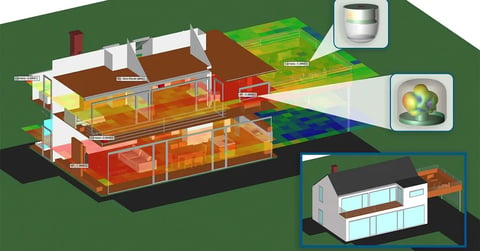
The generic example WiFi router discussed here uses a combination of four 5 GHz antennas arrayed in a circular arrangement and two dual frequency 2.4/6-7 GHz elements. The antennas are enclosed in a smart speaker case which would have other circuit boards and speaker parts that are simplified to a few component parts here. The basic design of the device is shown in Figure 1 and is approximately 100 mm tall and 50 mm in radius. In Figure 2, the outer parts of the device are removed to show the antenna array elements inside. There are four planar dipole antennas tuned for 5 GHz (shown in Figure 3) which are arrayed in a circular fashion with a radius of 30 mm. Additionally, there are two similar antennas which are tuned for dual frequency use at 2.4 and 6-7 GHz that are rotated 45 degrees about the central axis of the 5 GHz array to reduce blockage. The two-element array is separated by 60.5 mm. The return loss for the two elements of the 2.4/6-7 GHz array is shown in Figure 4 to be below -10 dB at the frequencies of interest. Similarly, the return loss for each of the 5 GHz elements is shown in Figure 5 and again is less than -15 dB at 5 GHz.
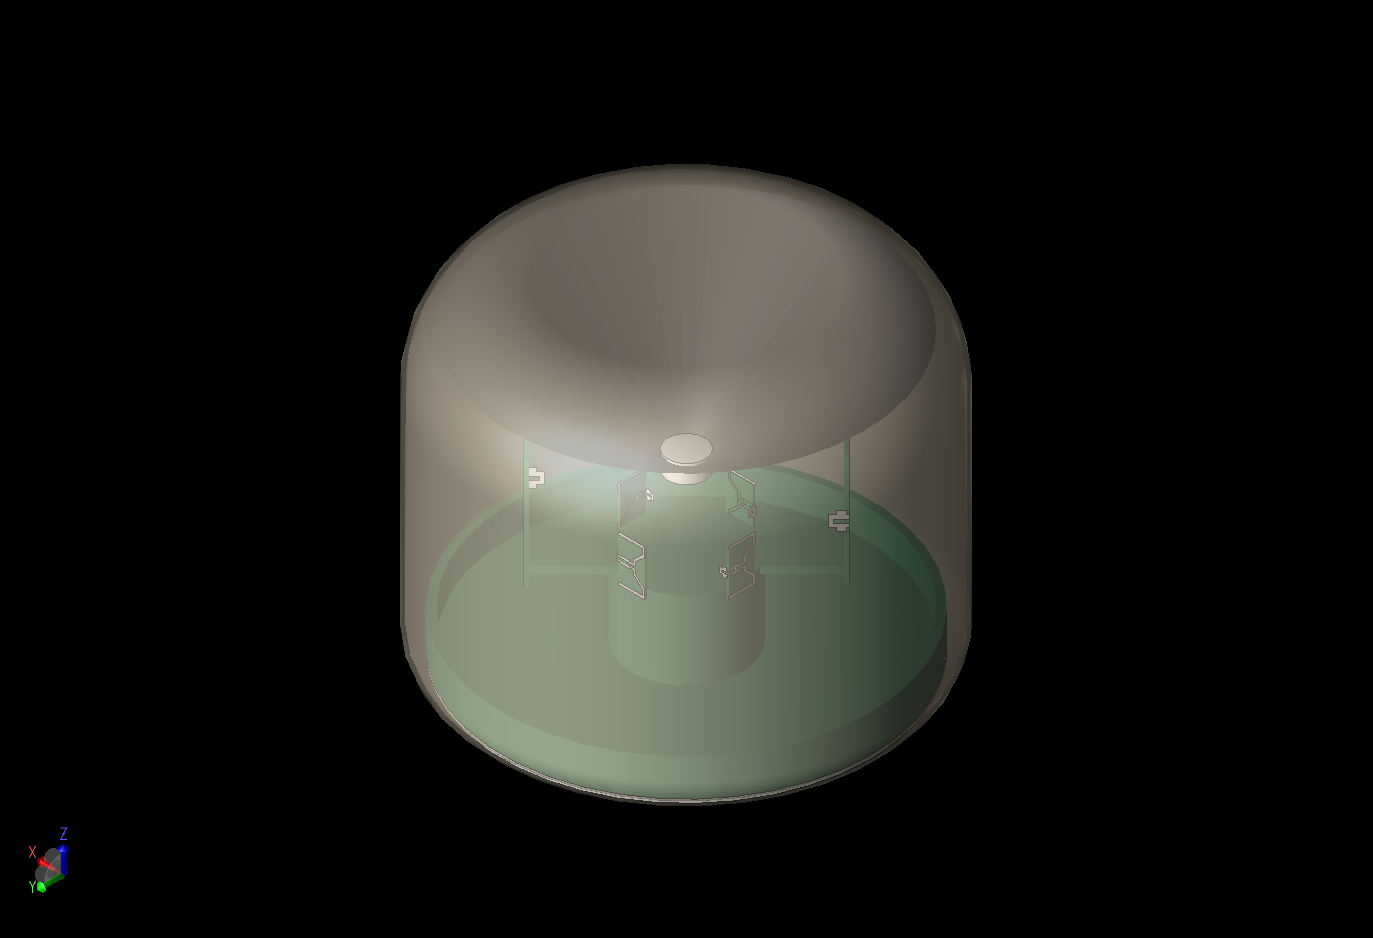
Figure 1: A three-dimensional view of a generic WiFi router device is shown with the internal antenna arrays partially visible through the cover.
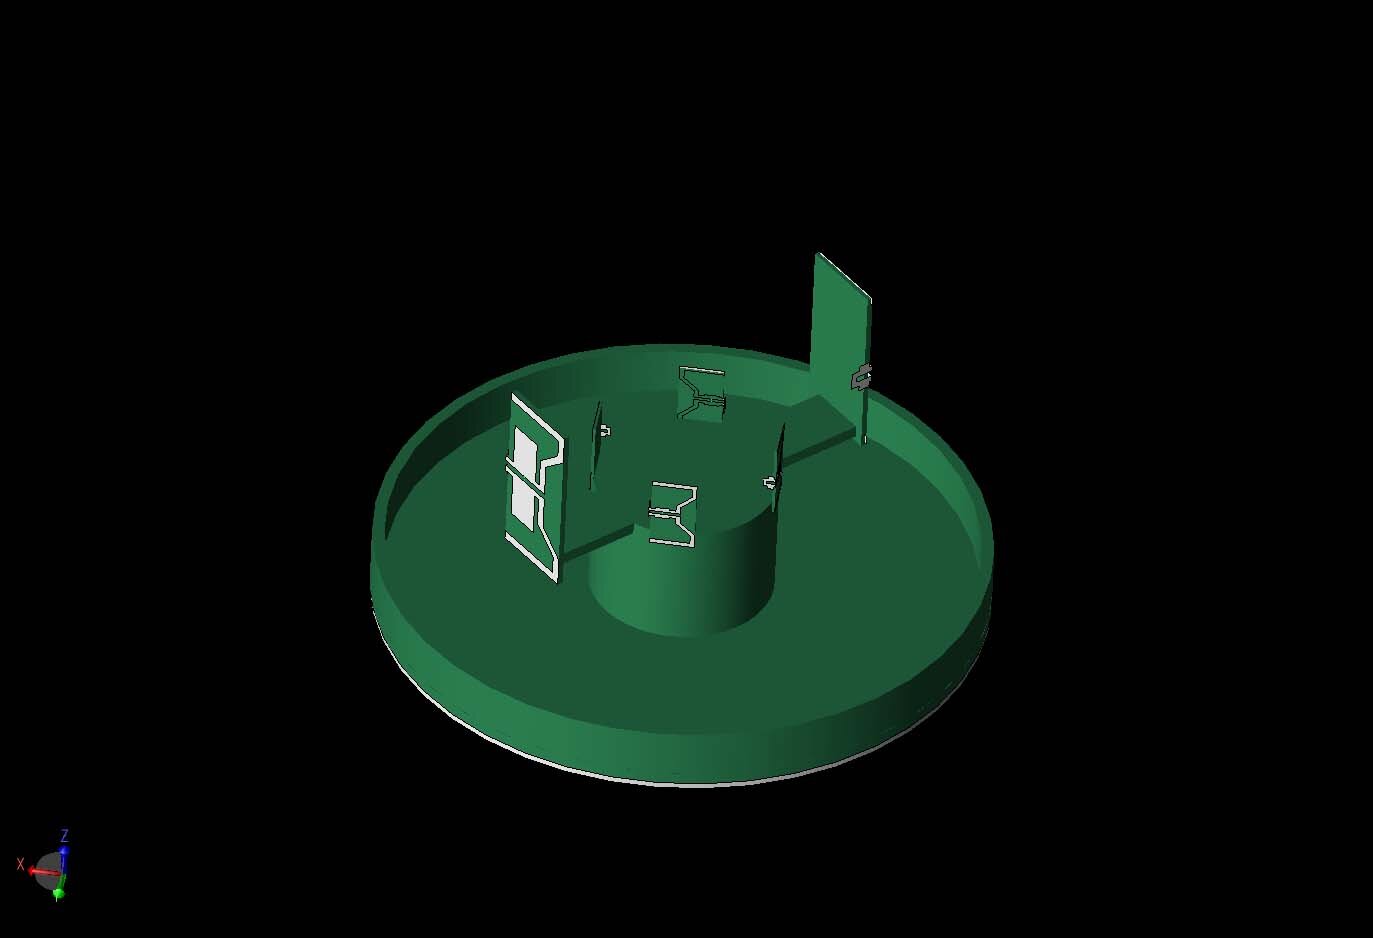
Figure 2: The internal antenna arrays of the WiFi router are shown with covering parts removed.
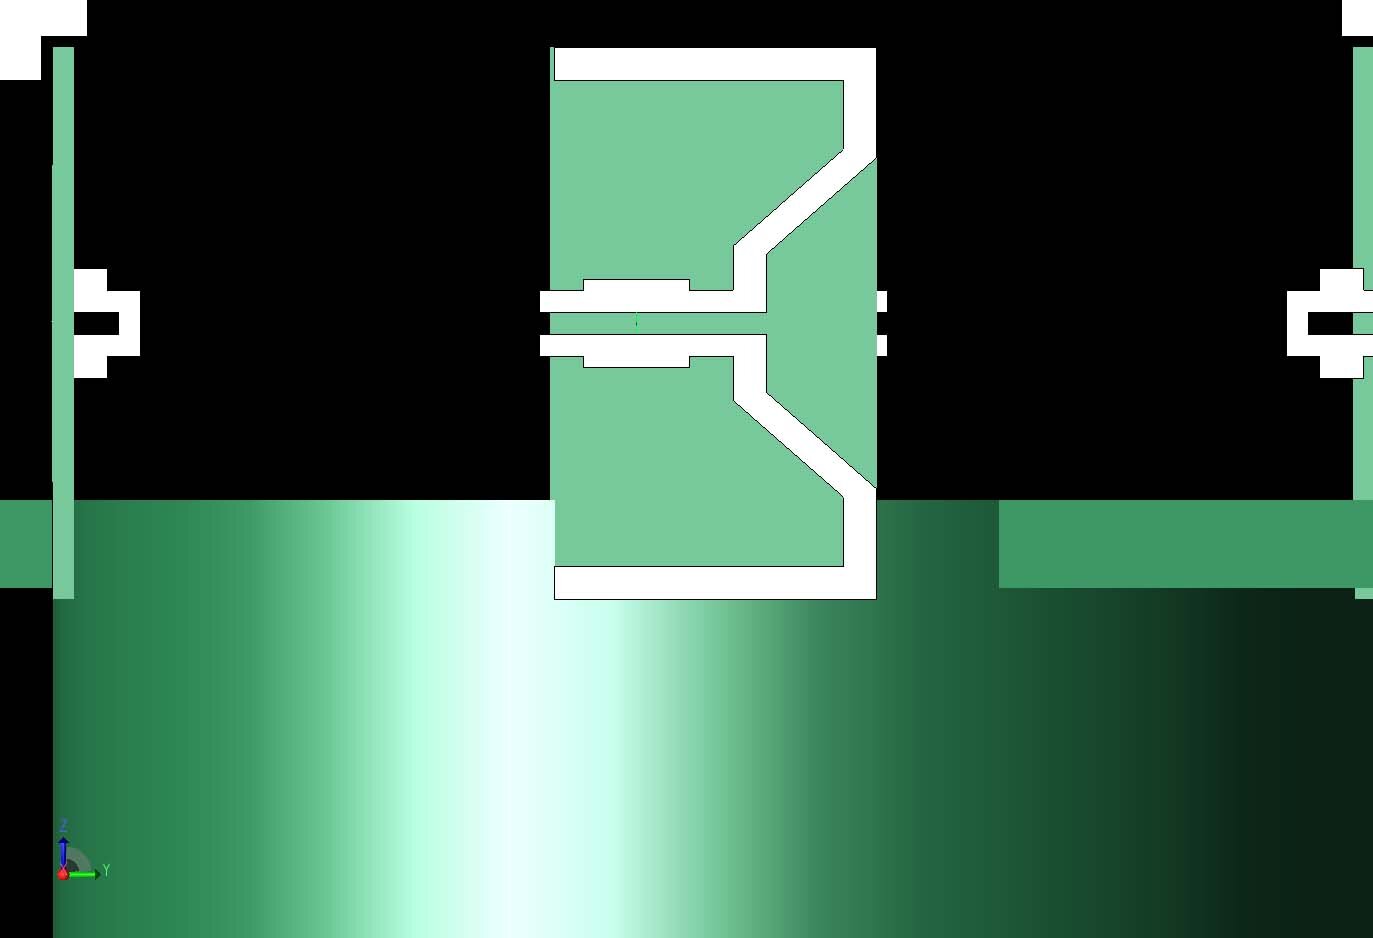
Figure 3: A closer view of one of the 5 GHz antennas is shown. The 2.4/6-7 GHz antennas have a similar design.
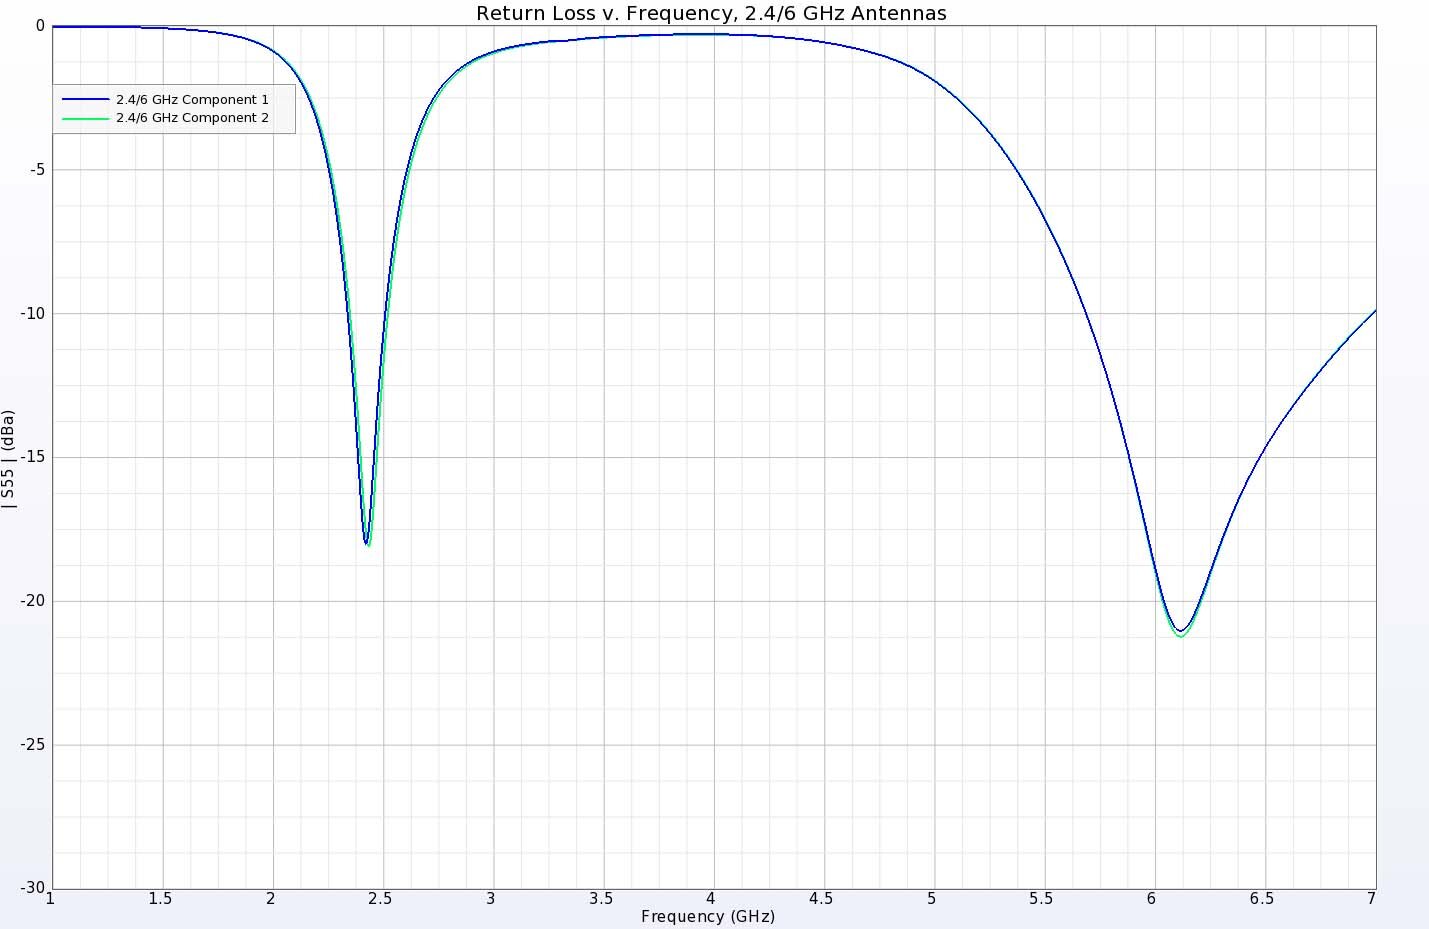
Figure 4: The return loss for the 2.4/6-7 GHz antenna elements shows values below -10 dB at the desired frequency bands.
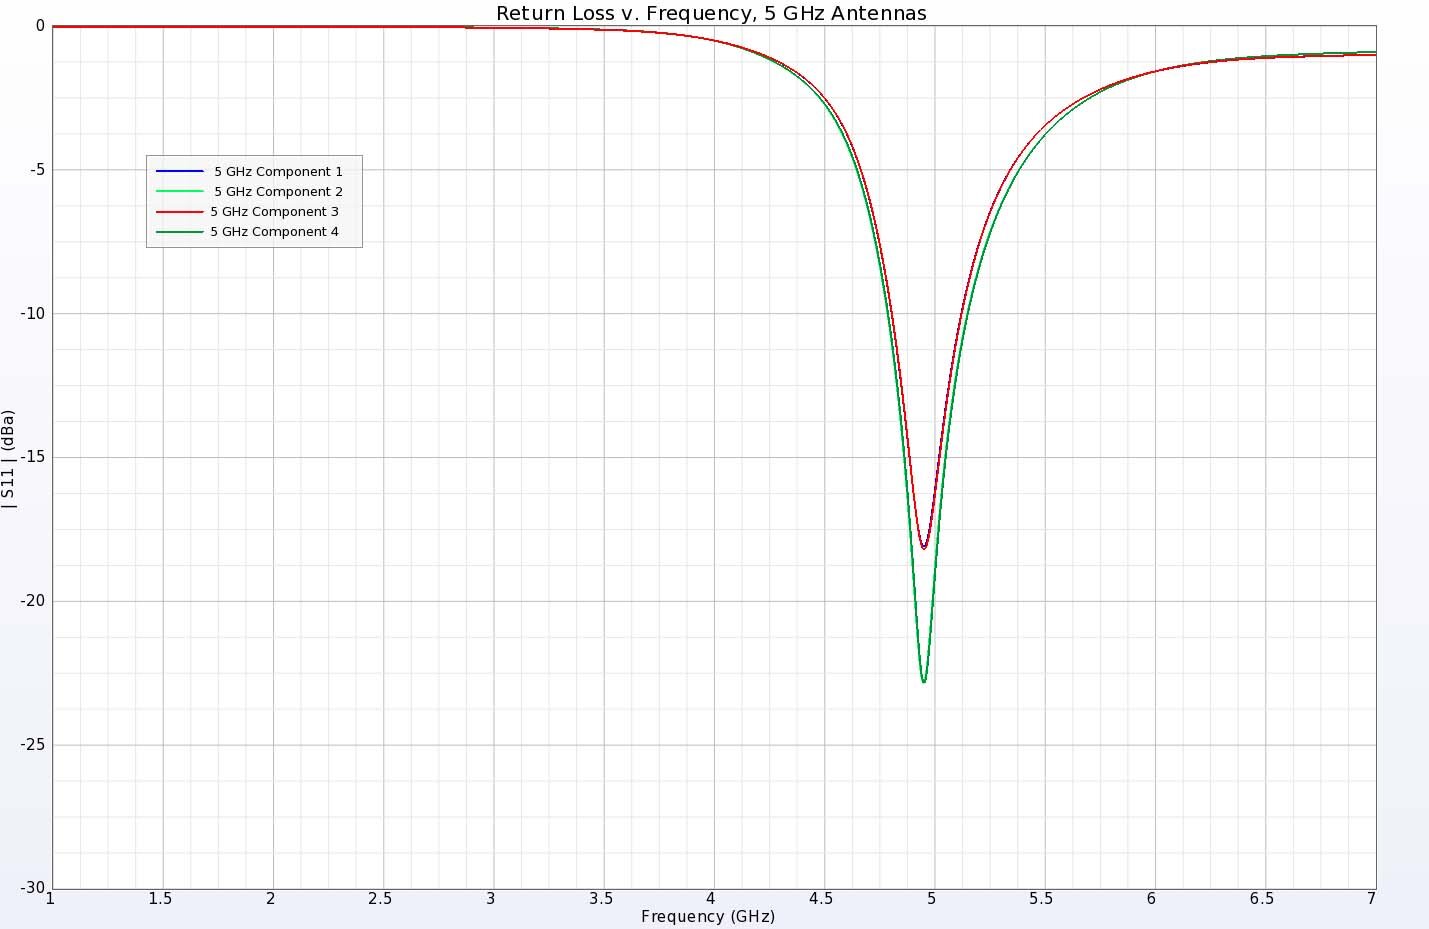
Figure 5: The return loss for the 5 GHz antenna elements shows values below -15 dB at the desired frequency.
In free space, each of the antenna elements creates a spherical pattern typical of a dipole antenna. However, in the environment of the WiFi router with adjacent elements, conducting circuit boards, and other parts nearby, the patterns change significantly. For the 2.4 GHz element, a typical pattern is shown in Figure 6 where there are two main lobes radiating from the long ends of the rectangular antenna. The coverage of the two elements acting independently is shown in Figure 7, where the four lobes are displayed. For the 5 GHz elements, the pattern created by a single element is a single lobe that points normally out of the large planar face of the antenna, as shown in Figure 8. The four elements in the array produce four independent lobes covering each of the quadrants surrounding the device, as shown in Figure 9.
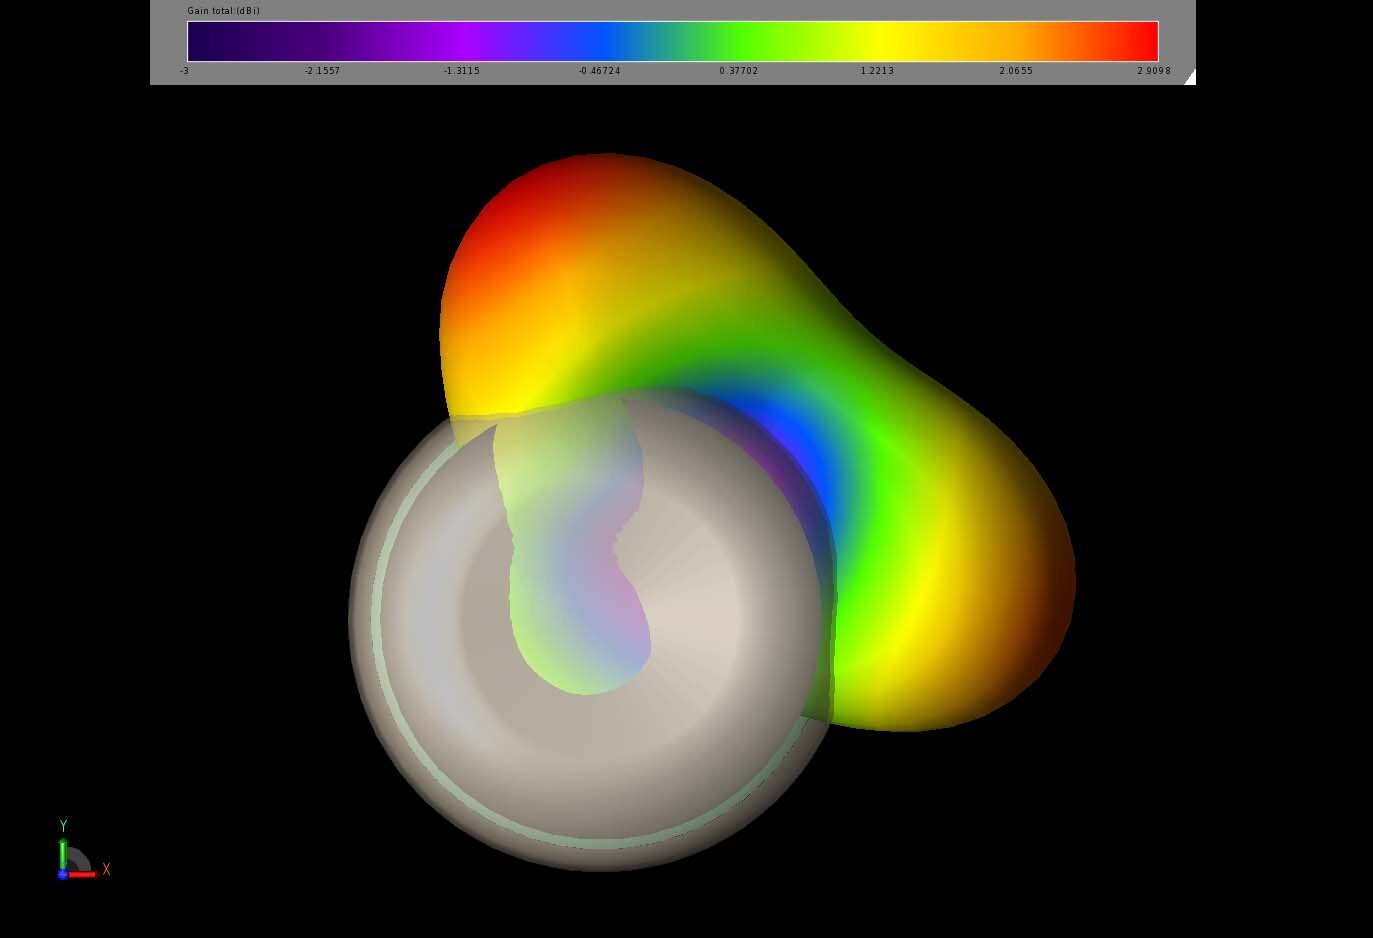
Figure 6: Shown is a top view of the three-dimensional pattern of one element of the 2.4 GHz antenna array. The pattern has two lobes that are focused in the horizontal plane.
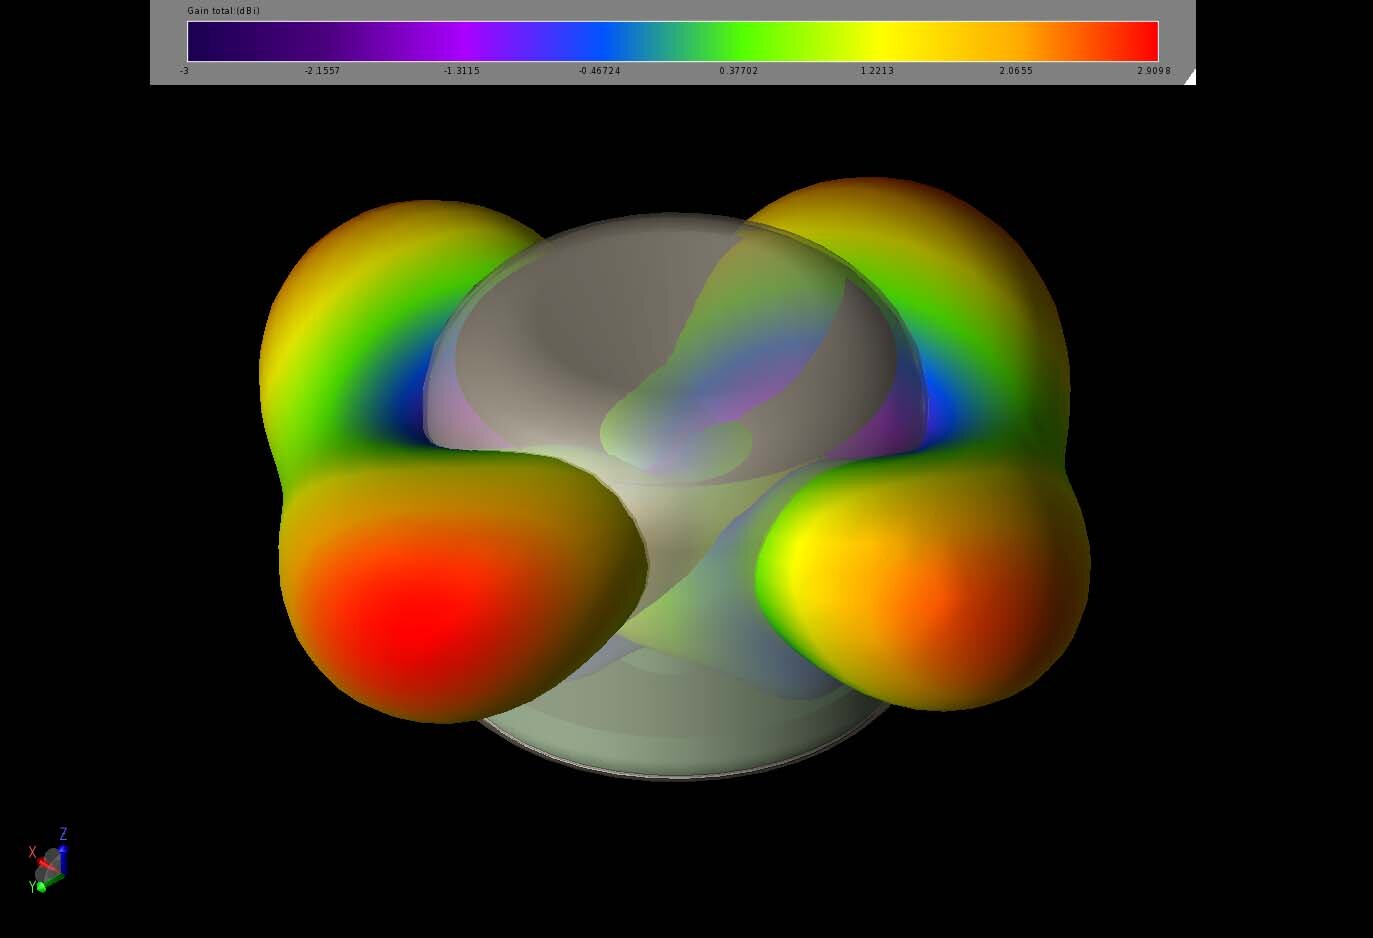
Figure 7: A three-dimensional view of the gain patterns of both elements of the 2.4 GHz array.
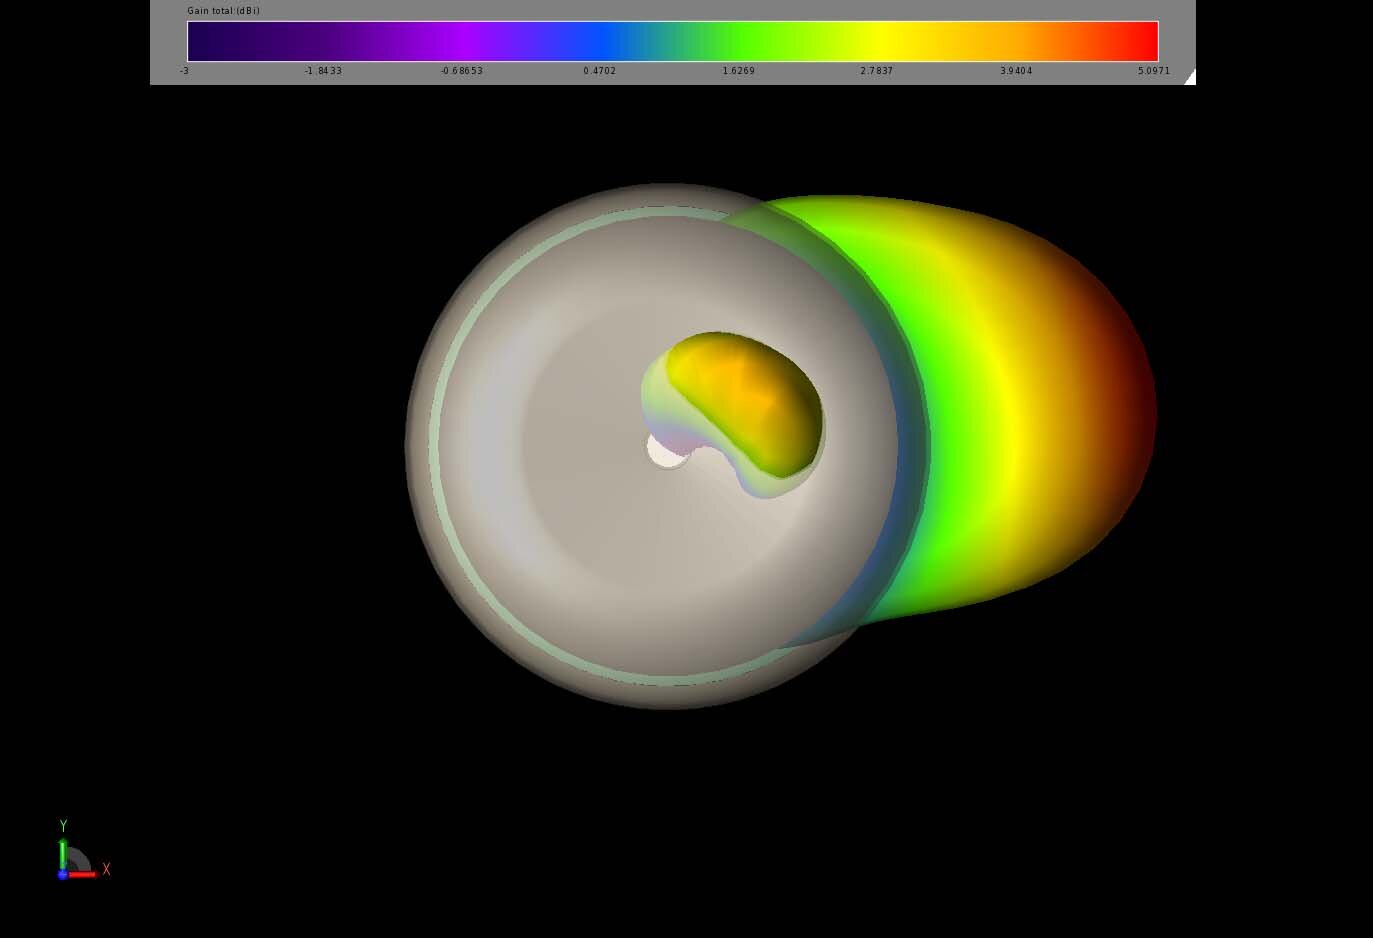
Figure 8: A top view of the three-dimensional gain pattern of one of the 5 GHz array elements shows a single beam radiating normally to the array element.
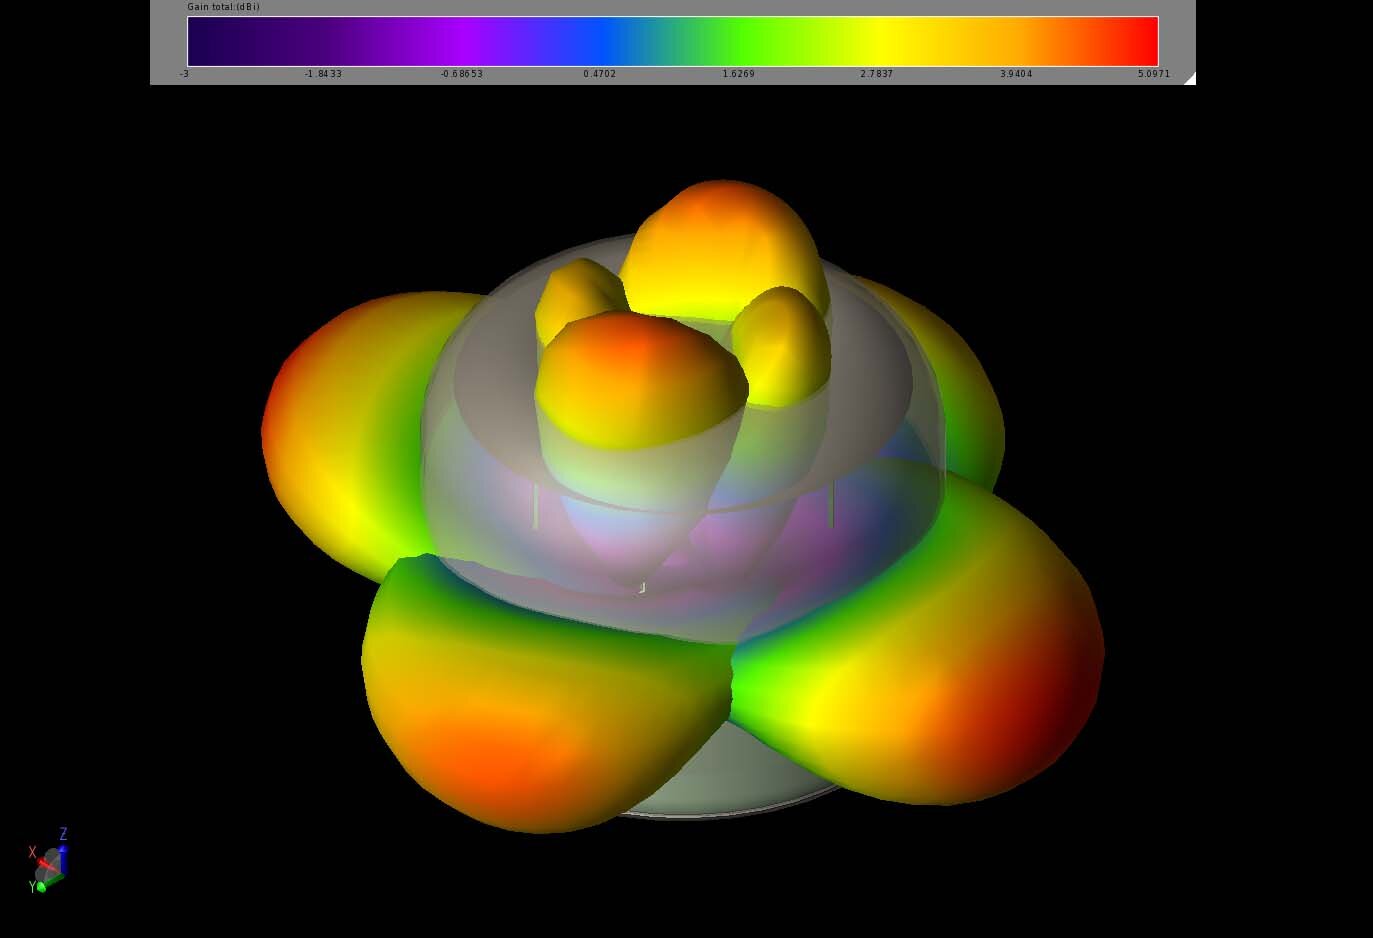
Figure 9: Shown are the four individual gain patterns for the elements of the 5 GHz array.
Using the Array Optimization features in XFdtd 3D EM Simulation Software, the performance of the arrays can be determined to find the full coverage possible. For the purposes of this WiFi router, the primary goal is to have good coverage in the horizontal plane surrounding the device, and the following analyses focus on optimization in that plane. For the 2.4 GHz array of two elements, the maximum coverage possible, or Maximum EIRP, in the horizontal plane is shown in Figure 10 and can be seen to be circular around the device. A two-dimensional polar plot of the pattern in the horizontal plane is shown in Figure 11, and fairly even gain over the full 360 degrees surrounding the device is obtained. At 5 GHz, the four elements can be used either all together or in different groups of two or three. Figure 12 shows the Maximum EIRP for the four elements all acting together as an array, and the pattern covers the full 360 degrees surrounding the horizontal plane of the router. In Figure 13, a polar plot shows the four patterns possible when using two adjacent elements together, and these are shown to produce more focused beams that cover about a 90 degree region around the device. One of the beams possible using two adjacent elements of the 5 GHz array is shown in Figure 14, which shows a fairly narrow beam pointing at about 105 degrees in the XY plane. The Maximum EIRP pattern at 6 GHz (Figure 15) is tilted higher out of the horizontal plane, but still produces sufficient gain at all angles around the horizontal plane of the router, as shown in Figure 16.
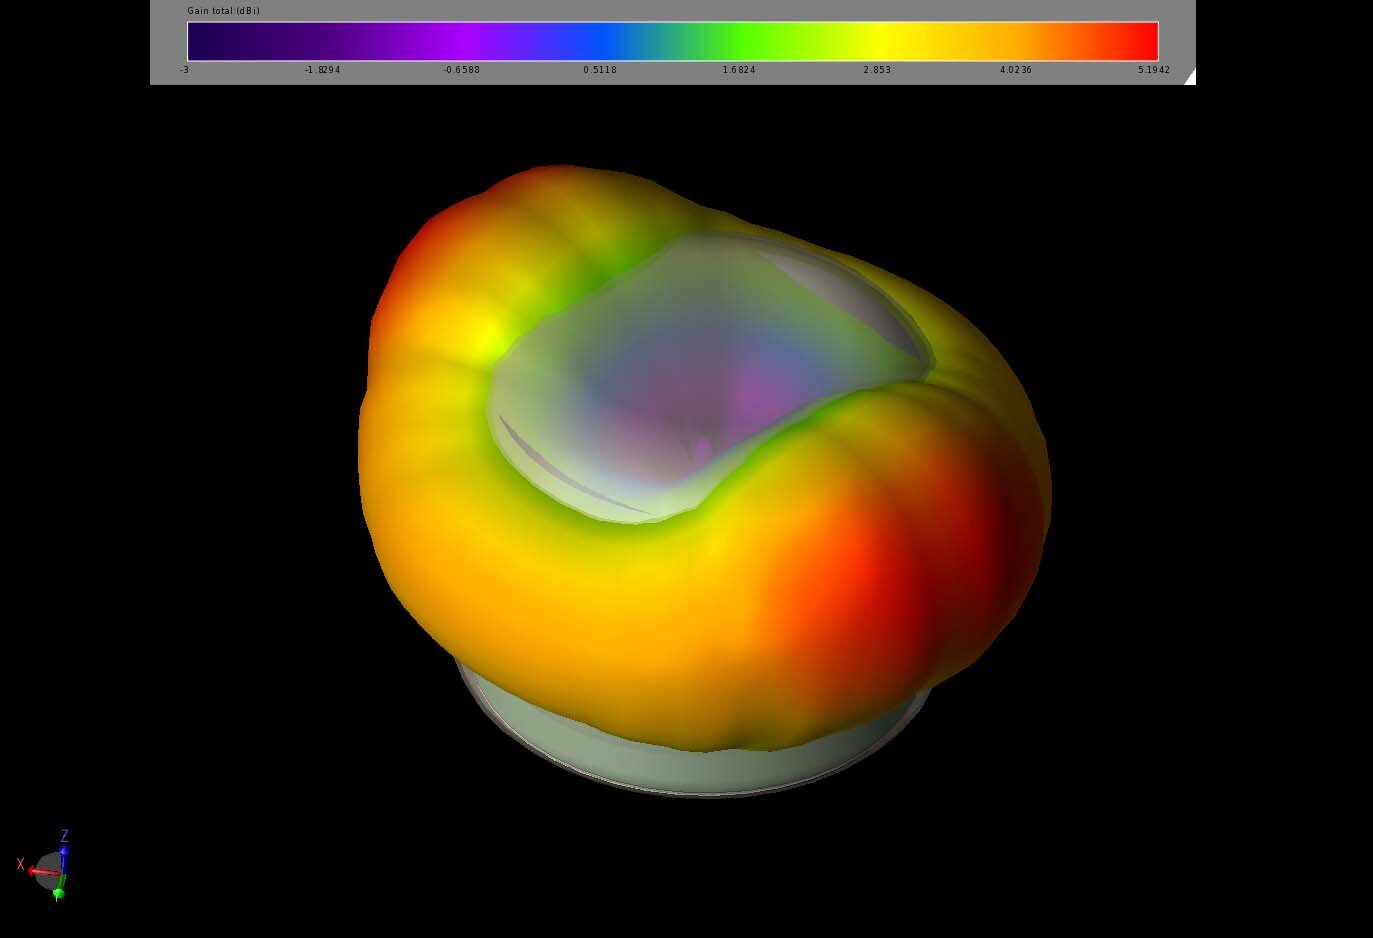
Figure 10: The Maximum EIRP pattern in the horizontal plane for the 2.4 GHz antenna array shows nearly even coverage surrounding the WiFi router.
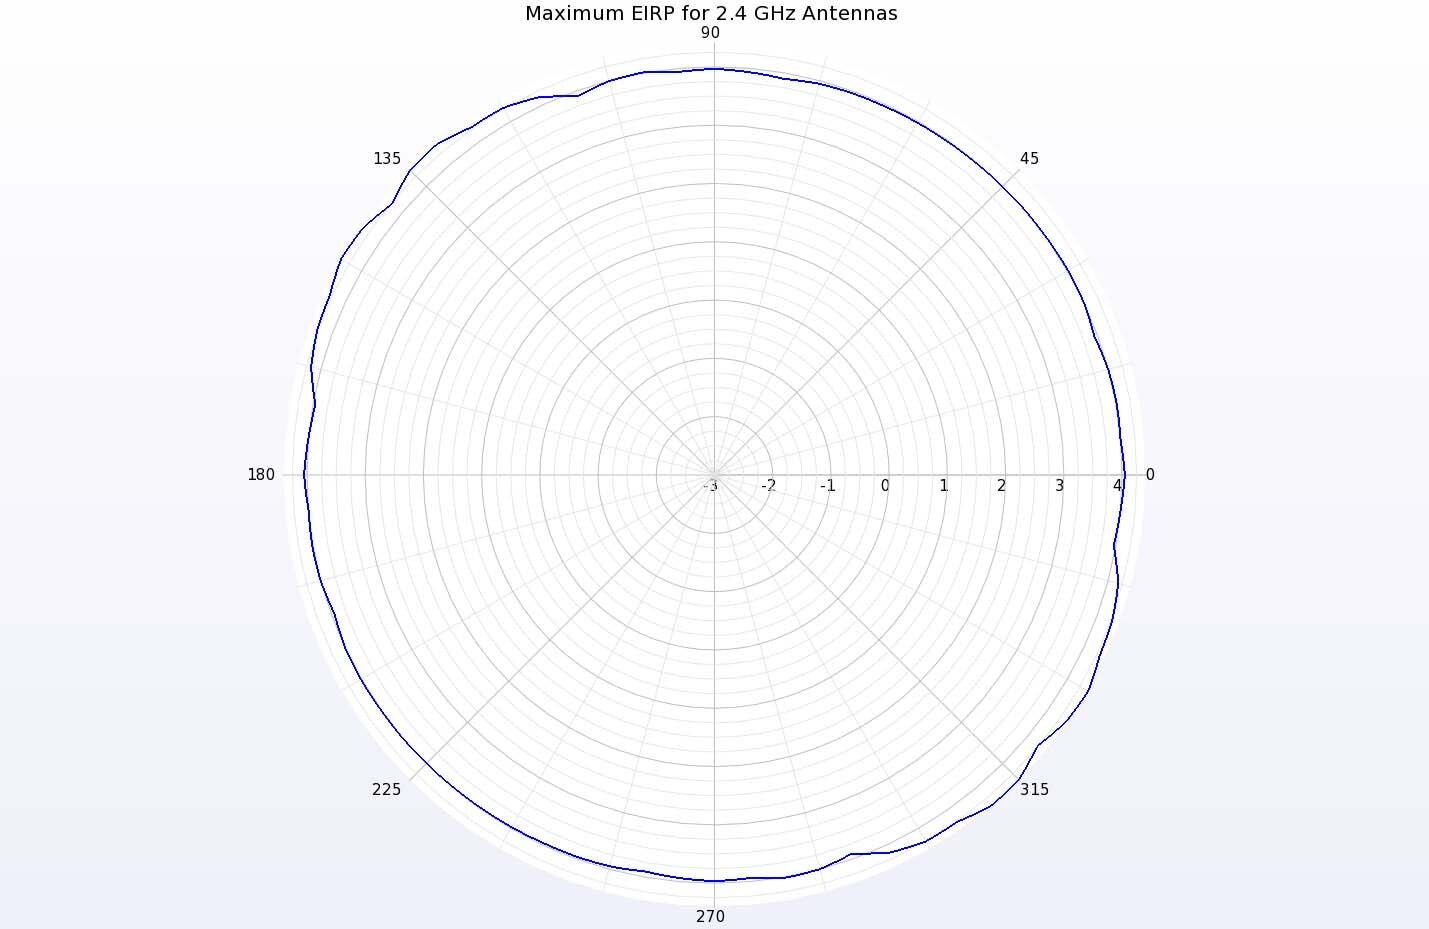
Figure 11: A polar plot of the Maximum EIRP in the horizontal plane shows gain of about 4 dBi in all directions.
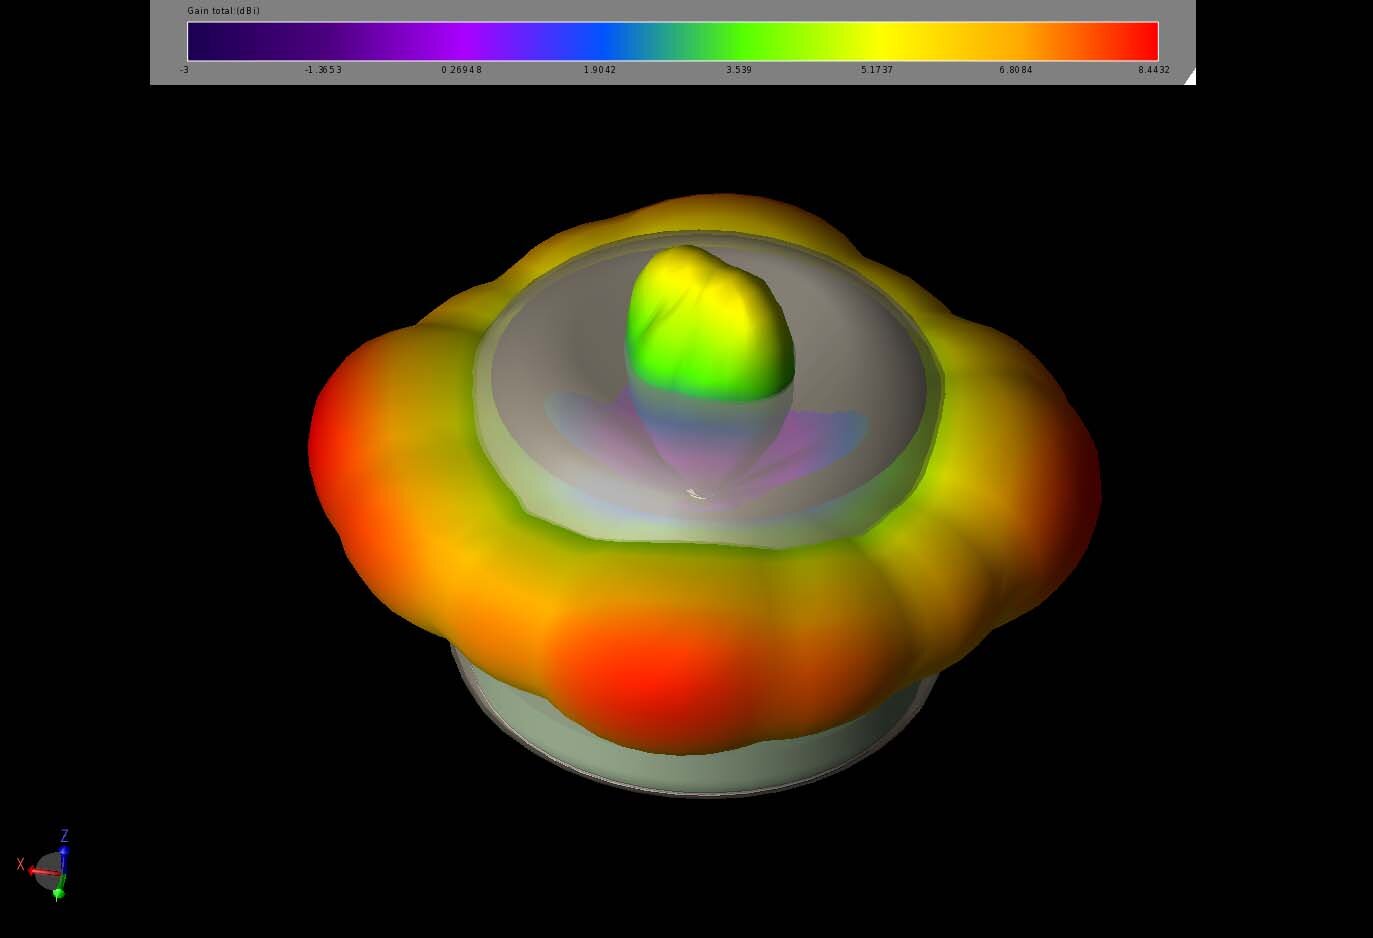
Figure 12: The Maximum EIRP pattern for the four elements of the 5 GHz array is shown for the horizontal direction.
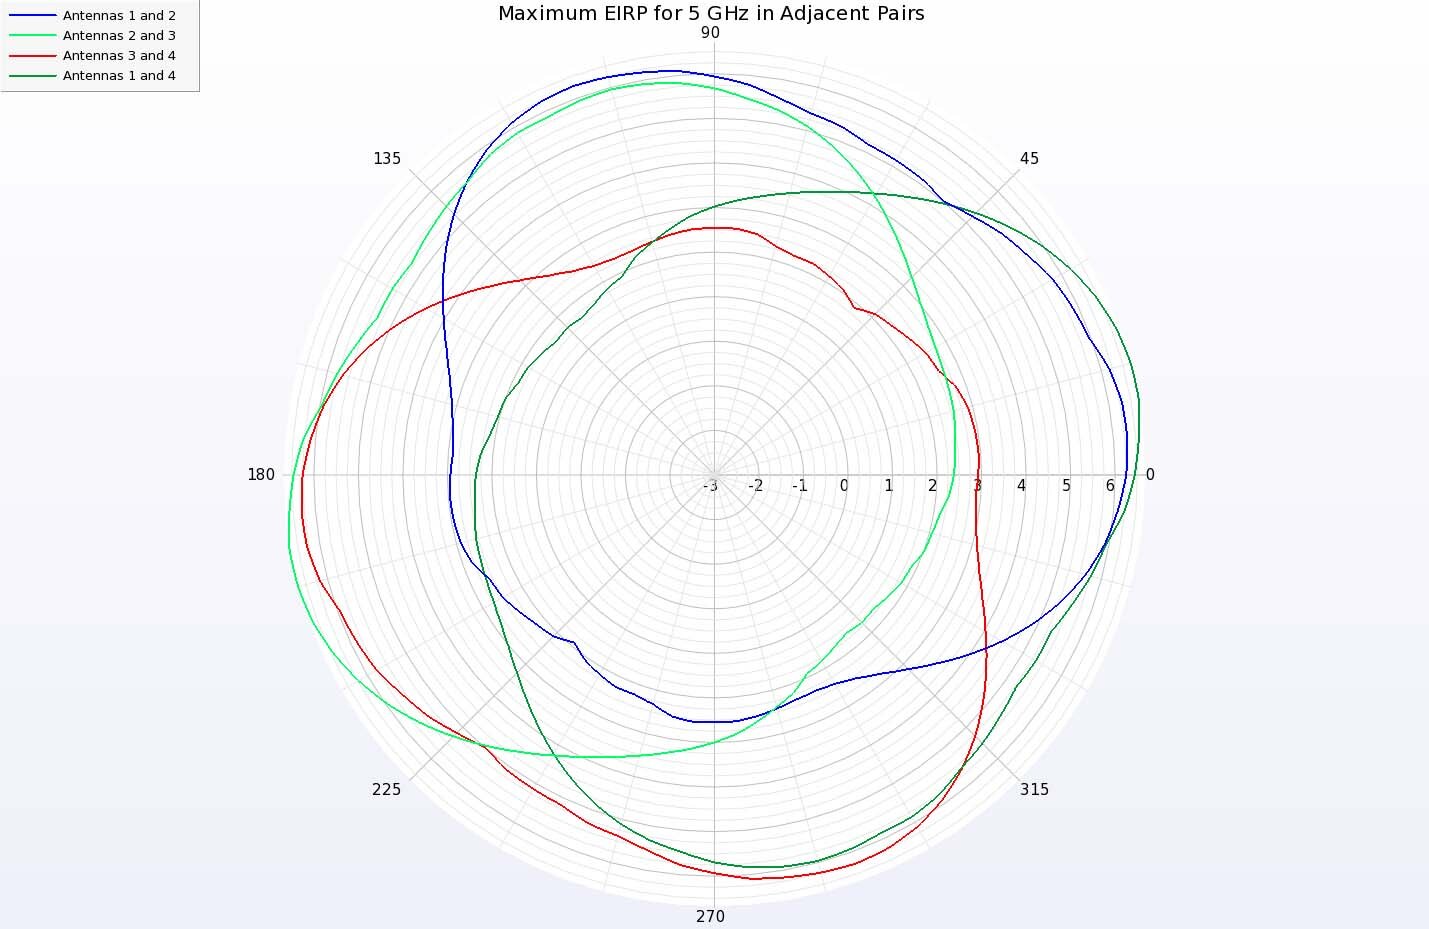
Figure 13: Polar plots of the Maximum EIRP for two-element arrays using adjacent antennas at 5 GHz. Each two-element array provides good coverage over a quadrant of the region surrounding the device.
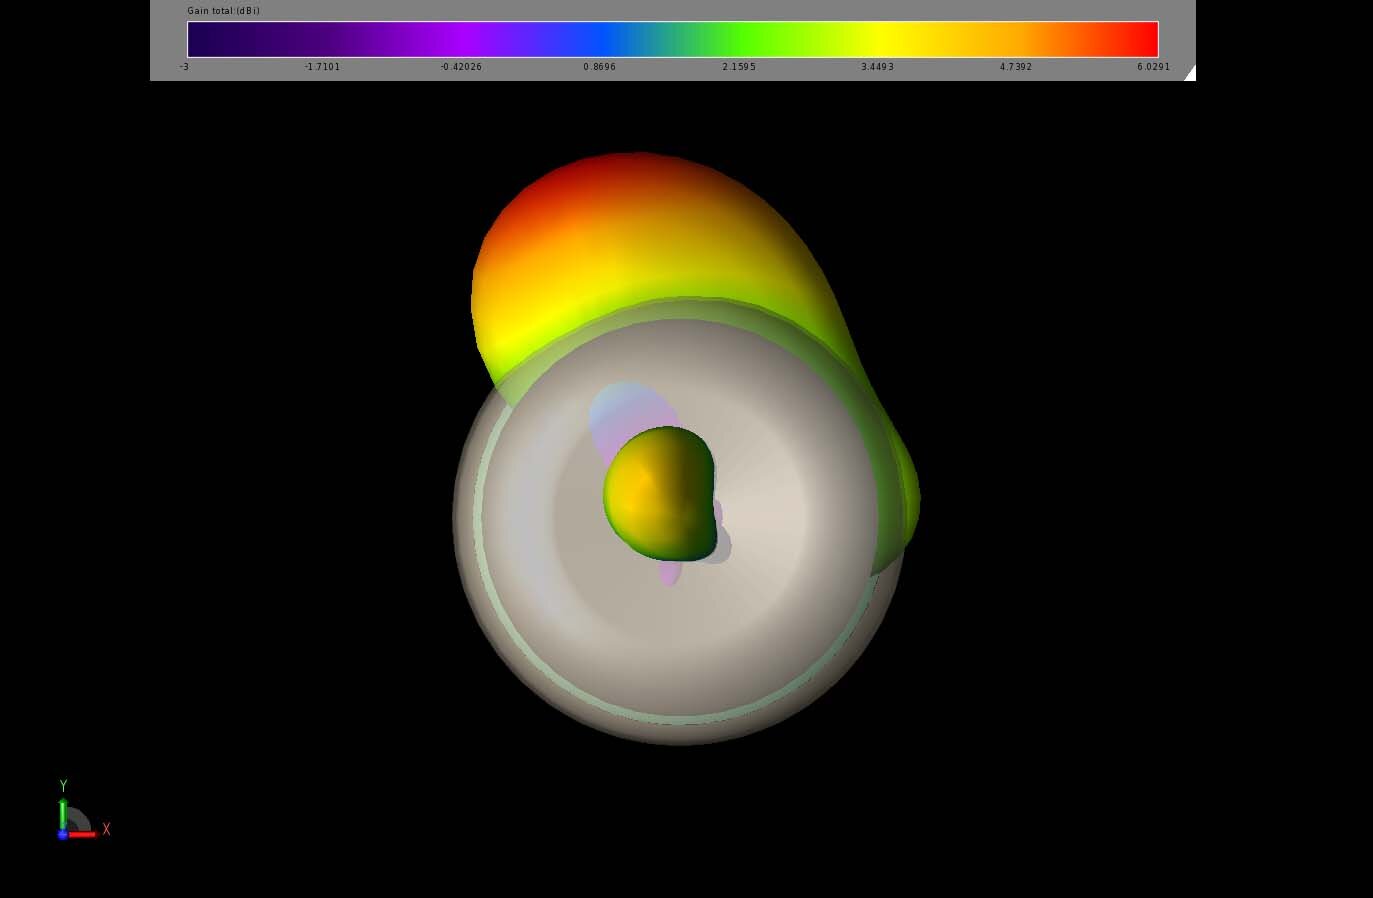
Figure 14: A beam pattern for one of the two-element 5 GHz arrays is shown with a pattern focusing a beam at about 105 degrees.
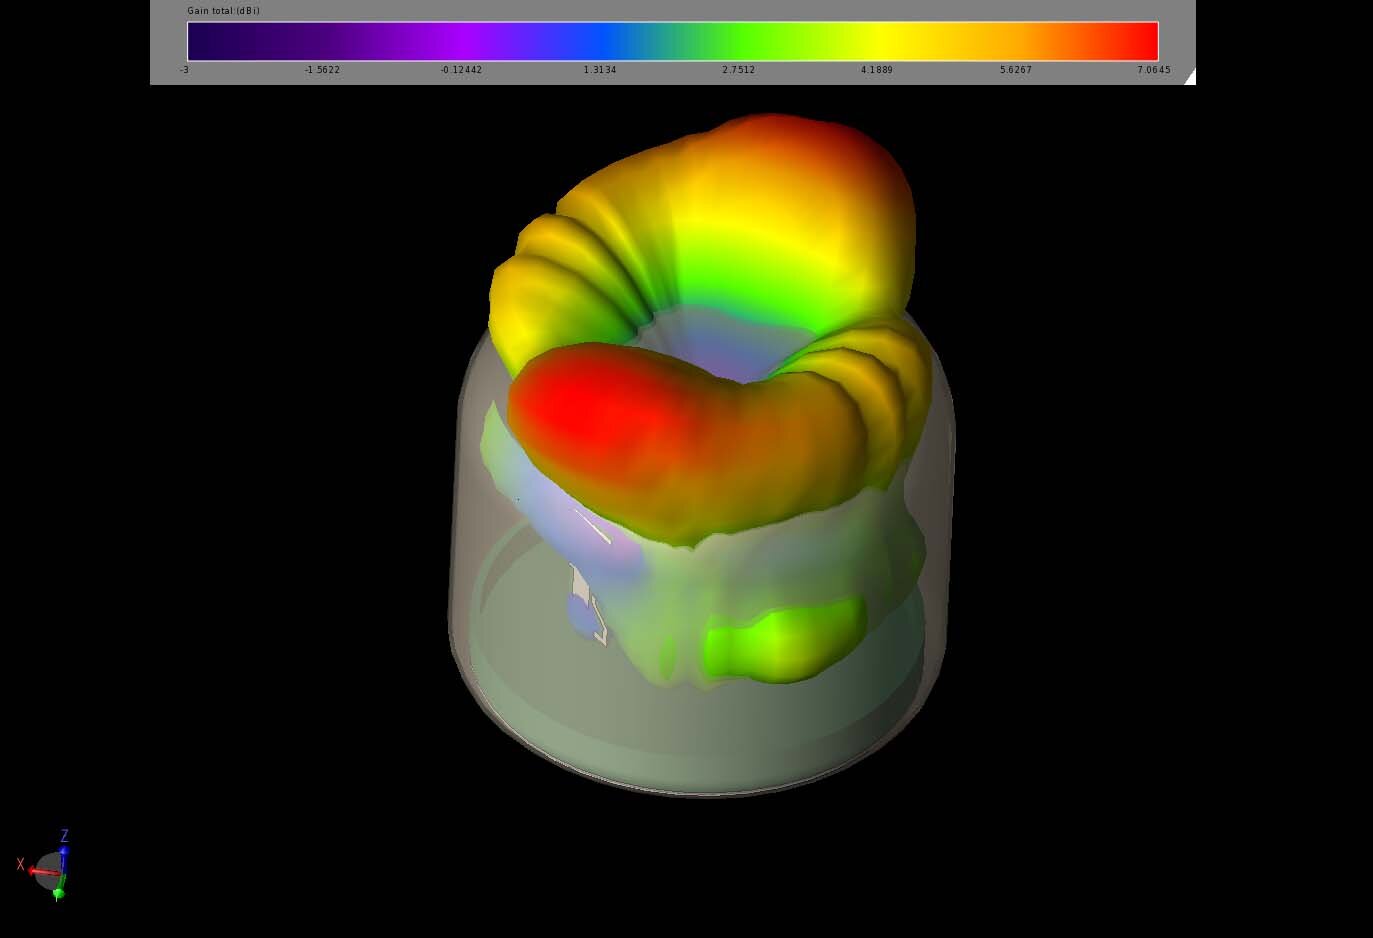
Figure 15: The Maximum EIRP pattern for the two 6-7 GHz elements at 6 GHz shows beams that are tilted above the horizontal axis, but positive gain is still possible surrounding the device.
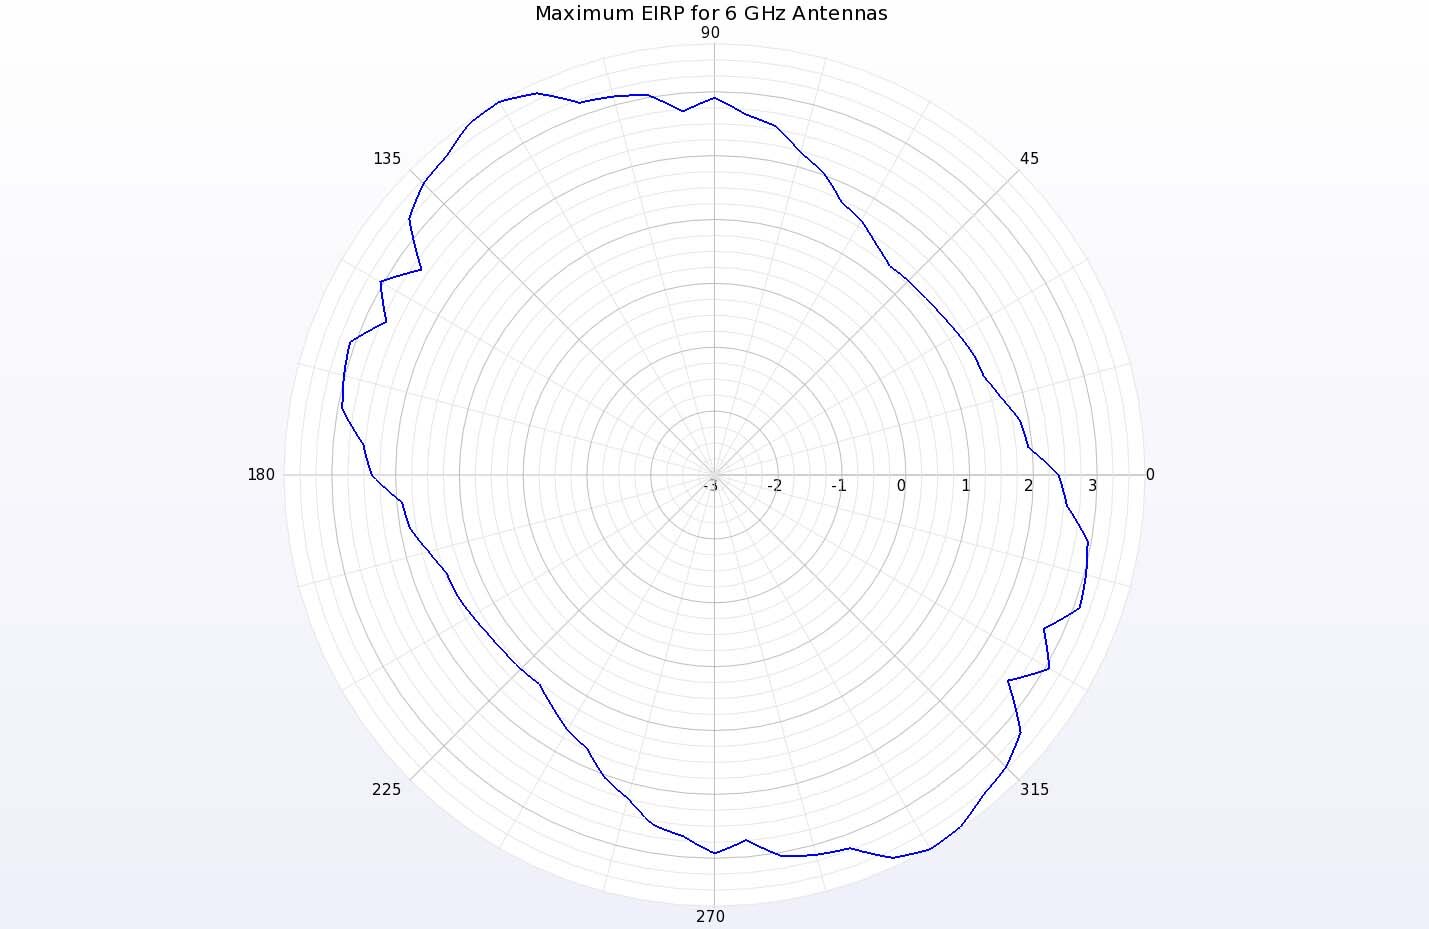
Figure 16: A polar plot of the Maximum EIRP at 6 GHz for the two-element array shows that in the horizontal plane, gain between 1 and 3 dBi is possible.
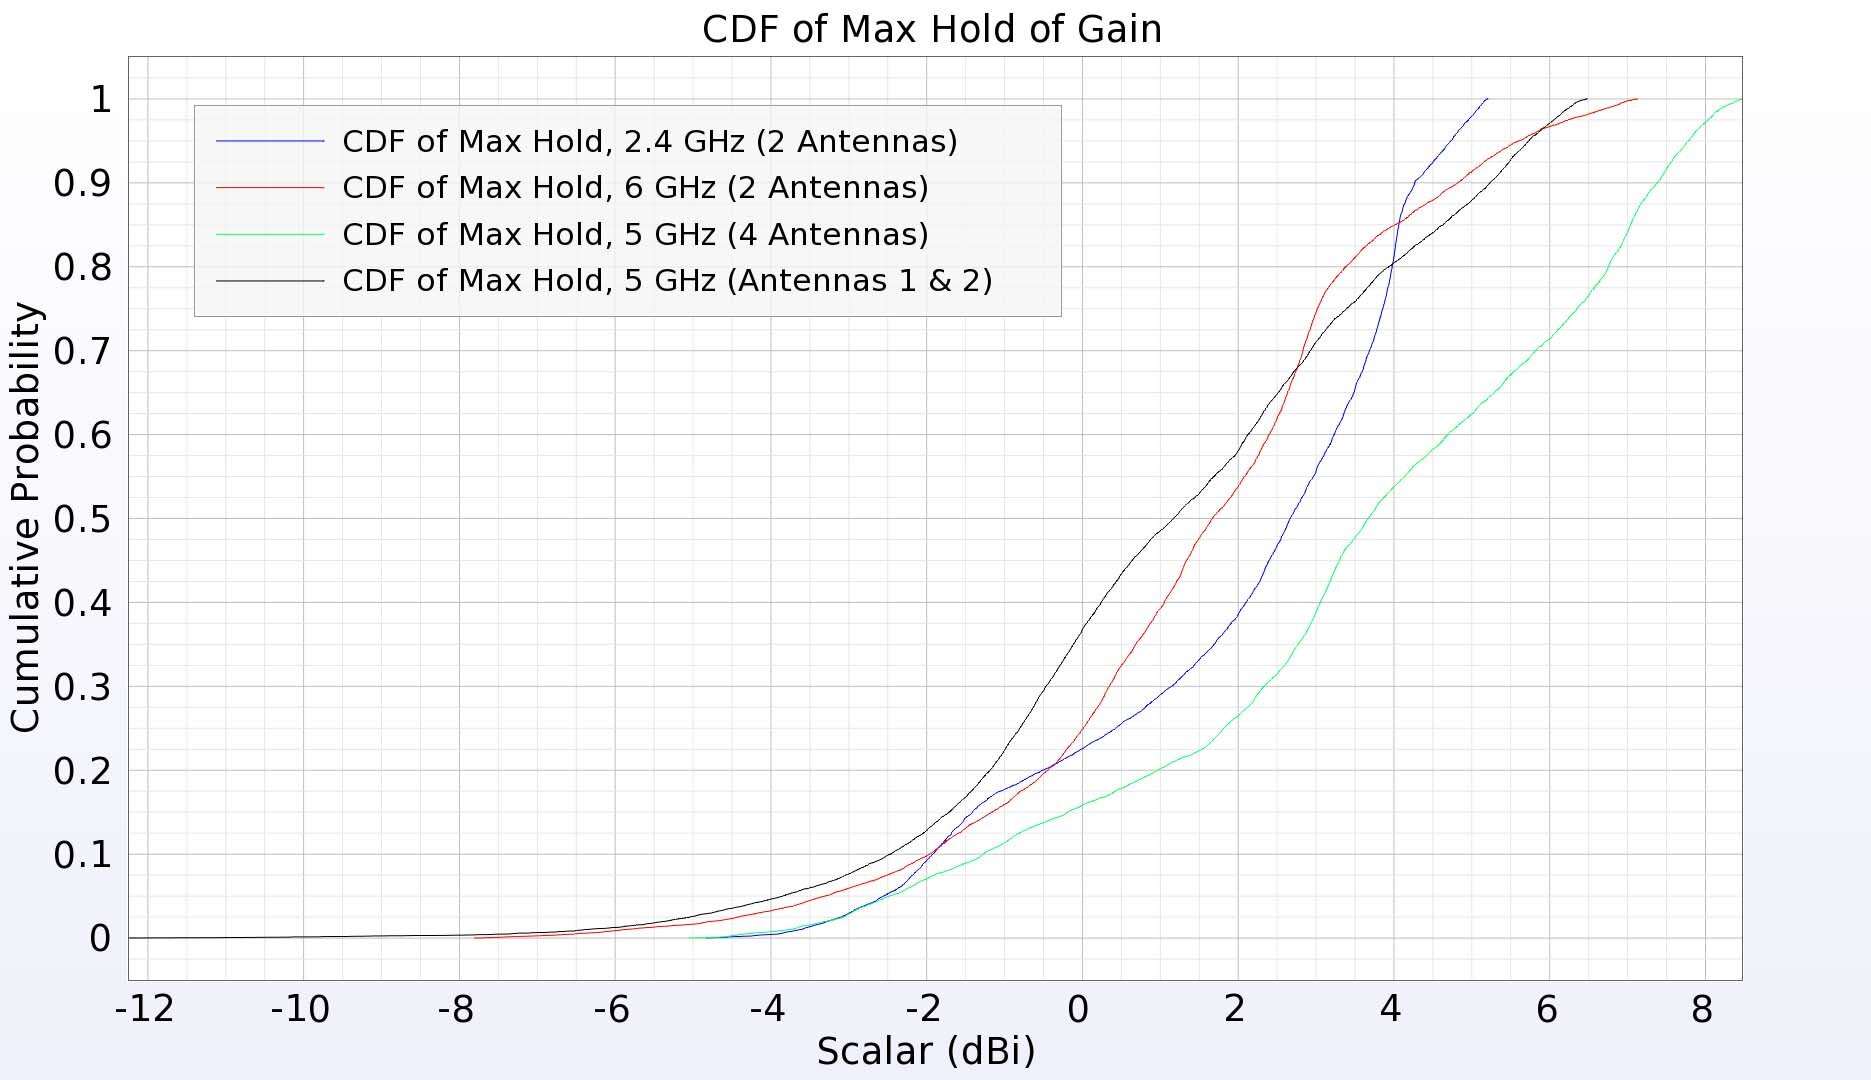
Figure 17: The CDF of EIRP plot for multiple array configurations.
By creating a cumulative distribution function of the EIRP, it is possible to compute the maximum coverage over the full three-dimensional sphere surrounding the device. In Figure 17, the CDF of EIRP plot shows that for all possible phasing relationships of the 2.4 GHz array elements, positive gain is possible for nearly 78% of the directions. At 5 GHz, the combination of two adjacent elements gives a CDF plot with over 60% coverage while with all four elements, over 83% of directions have positive gain. Finally, for the two 6-7 GHz elements, about 75% of the directions may have positive gain.
Conclusion
The array analysis using the tools in XFdtd has shown that this WiFi router device is capable of producing good gain over the full range of desired angles with focused beams possible to track moving targets and find better paths in a dynamic environment.