3D far-field gain pattern at 60.48 GHz computed by XFdtd showing the broadside lobe of a 1x4 aperture-coupled array.
Introduction
Designing a high-gain phased array for the 60 GHz WiGig band requires accurately capturing the full electromagnetic behavior of a multilayer, aperture-coupled structure—including S-parameter coupling between elements, far-field radiation patterns, and beam-steered EIRP coverage. XFdtd’s full-wave FDTD solver, combined with its superposition and array optimization post-processing capabilities, addresses each stage of this workflow efficiently.
This example models a dual-array, 8-element (2×4) aperture-coupled patch antenna operating in the WiGig channel 2 band centered at 60.48 GHz (frequency range of interest: 55–65 GHz). Two orthogonally oriented 1×4 arrays are mounted on a shared L-frame structure. The simulation characterizes individual element patterns, mutual coupling (S-parameters), superposed beamforming states, and beam-steered EIRP—culminating in a CDF of EIRP for each array and a composite max-hold plot showing total spatial coverage.
Full-Wave FDTD Simulation of a Multilayer mmWave Structure
The antenna uses a three-layer dielectric stackup with copper radiating patches and a stripline feeding network shown in Figure 1. XFdtd imports the full CAD geometry from a .stp file and user-defined materials are assigned to each part.
Each of the eight feed points is excited by a modal waveguide interface as shown in Figure 2 for the patches in the top array. XFdtd simulations for each of the eight ports (one active at a time) are performed to compute the full S-parameter matrix. The S-parameter data for port 1 are shown in Figure 3 while the three-dimensional gain patterns for each individual patch are displayed in Figure 4. This simulation data provides the complete inter-element coupling data required for superposition and array optimization post-processing.


 Figure 3: The complete S-parameter results for one of the end patches of the top (+Z) 1x4 array. The return loss (S11) at 60 GHz is around -18 dB while the coupling between all other patches is less than -20 dB.
 Figure 4: The XFdtd simulation simulates each patch individually and generates a gain pattern for that patch which is later used, with the S-parameter data, by the superposition tool.
Superposition Simulation: Per-Array Beamforming
XFdtd’s superposition simulation combines steady-state FDTD results using specified per-port magnitude and phase weights, without re-running the FDTD solver. For this structure, two superpositions are defined—one for each four-element array—each with 23 dBmW available power per port. The definitions for a superposition of each patch having 0 degree phase are shown in Figure 5 and the resulting pattern generated is shown in Figure 6. Phase weights are adjustable in the superposition definition editor and can be swept through a variety of settings. This phase-adjustment workflow allows engineers to rapidly evaluate beamforming states in postprocessing without additional solver time.
 Figure 5: The Superposition Simulation menu is shown for a calculation involving the four patches on the +Z surface of the structure at 60.48 GHz with each patch given available power of 23 dBmW at a constant phase.
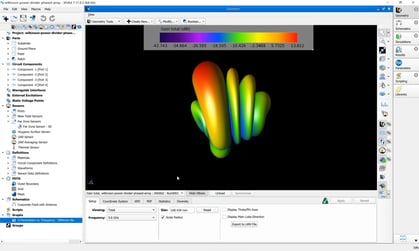
 Figure 6: With each patch in the +Z array fed at constant phase, the broadside pattern is generated with a peak gain of 12.4 dBi.
Array Optimization: Maximum EIRP Beam Synthesis
XFdtd’s array optimization feature applies the superposition principle to determine per-element excitation weights—magnitude and phase—that maximize EIRP in a specified direction. Unlike a manual superposition, the optimization solves for the excitation state required to produce a target beam, rather than requiring the user to specify it.
In Figure 7, Array 1 is optimized for five beam directions spanning −30° to +30° in elevation (Theta, at Phi = 90°), while in Figure 8, Array 2 is optimized across a range of azimuth cuts (Phi = 150° to 210°, at Theta = 90°). The two arrays are configured 90° offset from each other, enabling combined spatial coverage analysis.


CDF of EIRP and Max Hold Coverage Analysis
Array optimization results are visualized as cumulative distribution function (CDF) plots of EIRP, which characterize what fraction of directions exceed a given radiated power level. This is a standard figure of merit for spatial coverage in WiGig and 5G mmWave system design.
XFdtd generates per-beam CDF plots for each analysis direction, a max-hold pattern aggregating the best achievable EIRP across all beams, and a composite CDF combining both arrays. Figure 9 shows the CDF plots for Array 1 Boresight (all elements in phase) vs Array 1 Max Hold and then Array 1 and Array 2 combined Max Hold. The composite plot directly shows the total spatial coverage benefit of operating both arrays together, supporting system-level EIRP budget and link margin analysis.
 Figure 9: The CDF of EIRP plot shows the performance of the array for a given input power. Here the +Z array with all elements in phase (A1 Boresight) is compared to the Max Hold of the same array which includes all possible phase combinations of the elements in that array. The combination of the two arrays creates even better coverage as shown in the A1+A2 plot which has the best performance at 23 dBmW.
Conclusion
Phased array antennas operating in the 60 GHz WiGig band (IEEE 802.11ad/ay, channels 1–4; channel 2 center: 60.48 GHz) are used in multi-Gbps short-range wireless links, including laptop-to-dock connectivity, wireless docking stations, AR/VR headsets, and fixed wireless access points. High-gain arrays are required to overcome the elevated free-space path loss at millimeter-wave frequencies relative to sub-6 GHz bands.
System designers need to verify not only that each element achieves the target radiation pattern, but also that the array achieves adequate EIRP in the intended coverage zone when beamformed—including worst-case and best-case directions. The CDF of EIRP analysis in XFdtd maps this coverage directly.
Accurate modeling of the antenna geometry and dielectric stackup—including frequency-dependent loss tangent—and realistic S-parameter coupling between elements is essential for predicting beamforming fidelity. XFdtd’s full-wave FDTD approach captures both without simplifying approximations, making it suitable for final design validation prior to prototype fabrication.
For more supporting resources, please see the accompanying tutorial on the Remcom Support website.