Learn more about our antenna simulation software…
Introduction
In this example, a satellite antenna originally designed for X-band operation [1] is modified in XFdtd to reduce the overall size, allowing it to fit on a mobile device. This is accomplished by shifting its operating frequency to the Ku-band at 12.5 GHz. The antenna consists of a 4x4 array of elements, each containing four rotated patch elements. The four patch elements are fed with phase adjustments of 0, 90, 180, and 270 degrees to produce a circularly-polarized field. The array produces a main beam with gain of over 20.7 dBi which can be steered over a wide field of +/- 60 degrees. The performance of the array in this configuration is investigated to determine the feasibility of such an application.
Device Design
Single Element
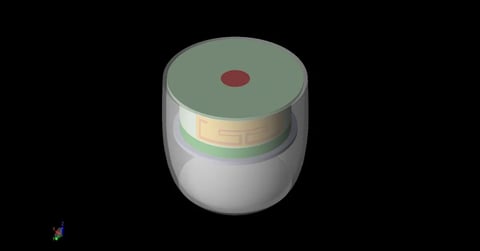
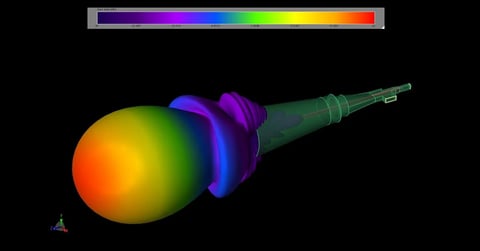
The antenna array consists of 64 small patch antennas. Each patch antenna is constructed with a square excitation element and a smaller rectangular coupled resonating element, as shown in Figure 1. Shorting pins are placed on both the excitation and coupling elements to improve the bandwidth of the antenna. The copper patches are placed on a 1.8 mm thick substrate with a dielectric constant of 4. The square patch dimension is 5.66 mm while the coupling patch is 2.15 x 5.09 mm with a separation distance of 1.2 mm. The single element has a broad operating range from around 11.795 to 14.492 GHz as shown in the return loss plot of Figure 2. The patch produces a somewhat semi-spherical gain pattern with peak gain of 5.7 dBi at 12.5 GHz as shown in Figure 3.
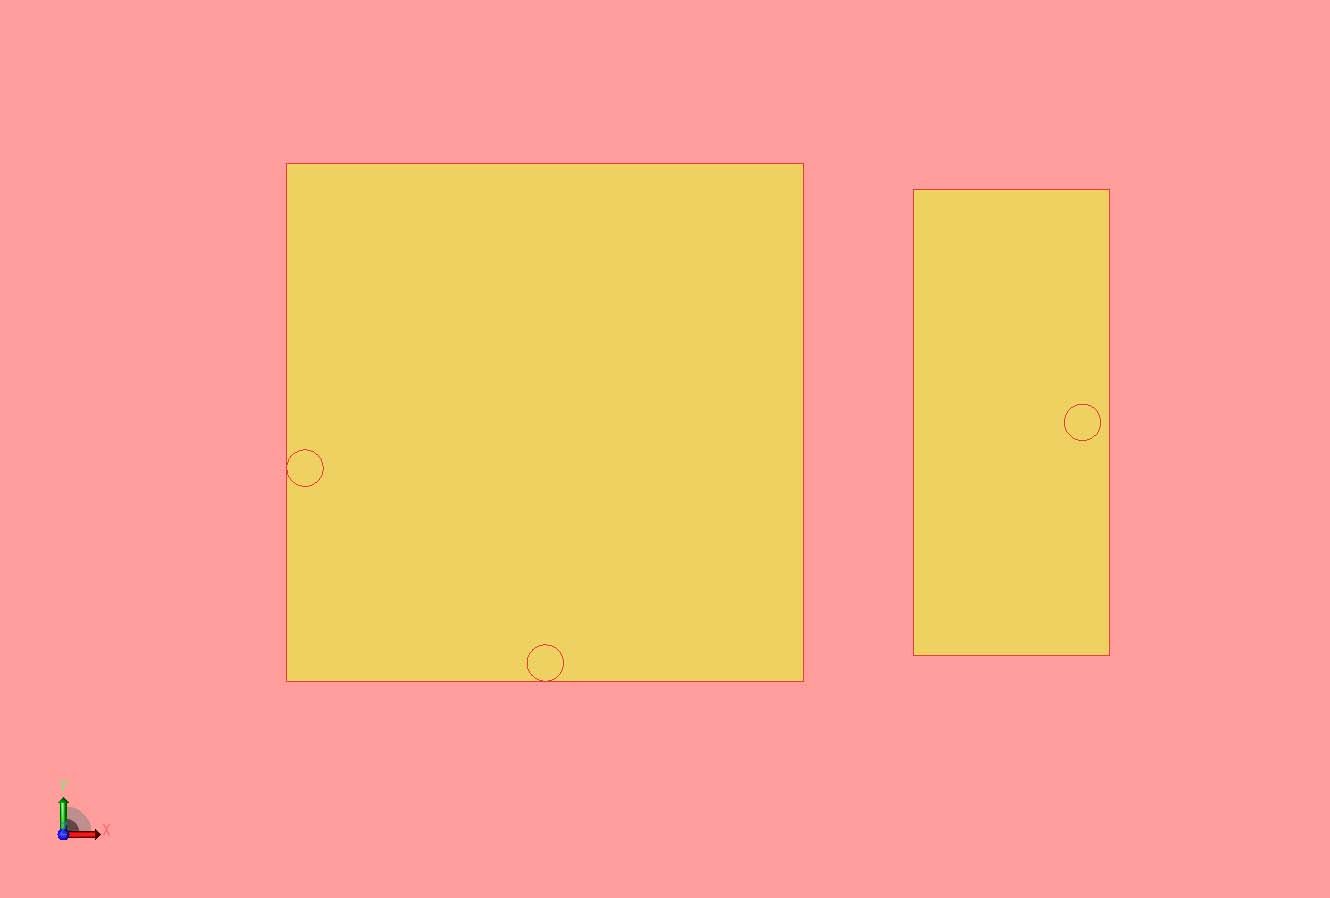
Figure 1: A CAD representation of the two-patch single element radiator with a square-fed patch and a smaller coupling patch.
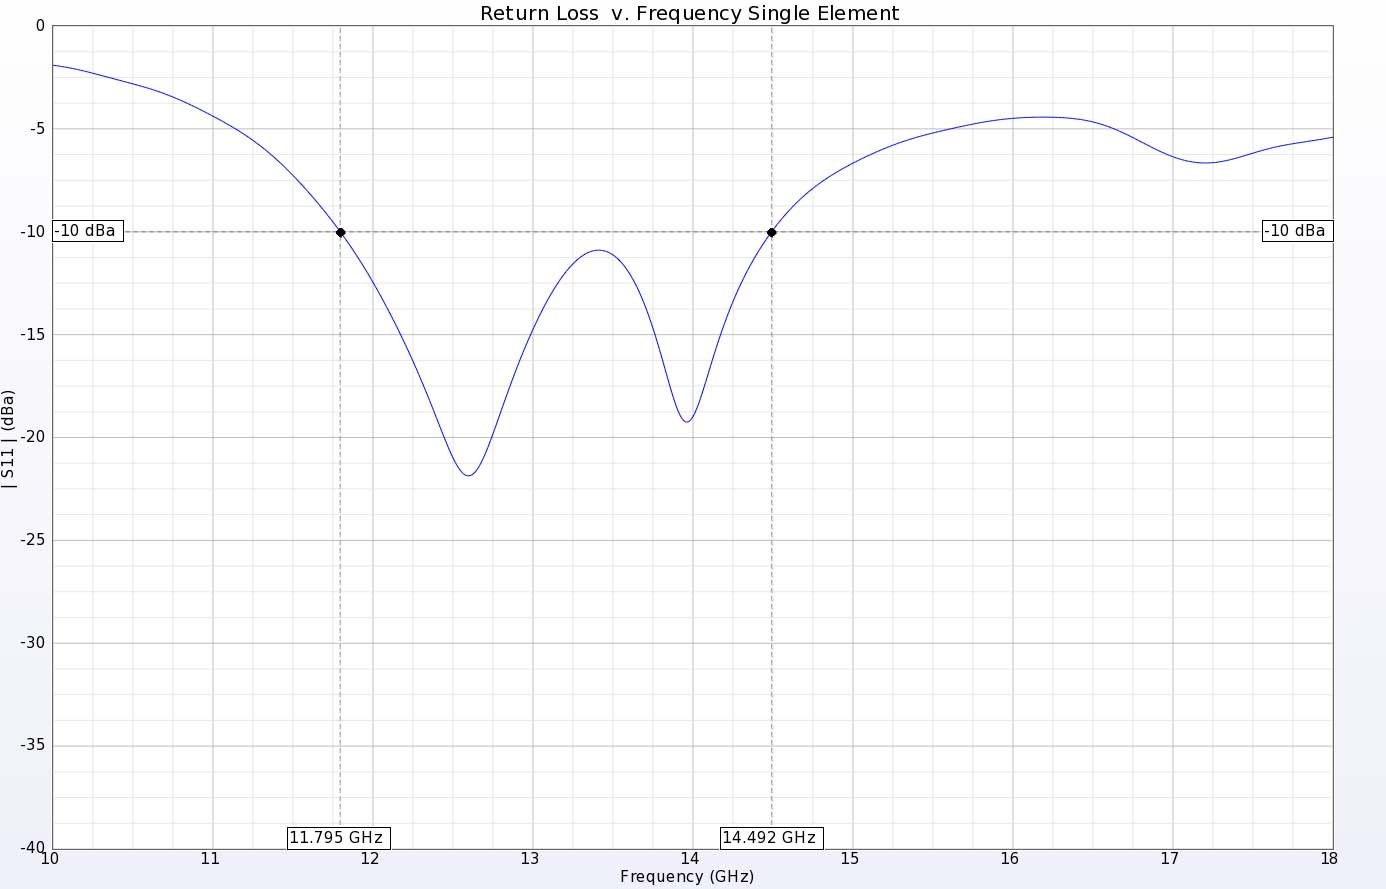
Figure 2: The return loss for the patch antenna shows good performance between 11.8 and 14.5 GHz.
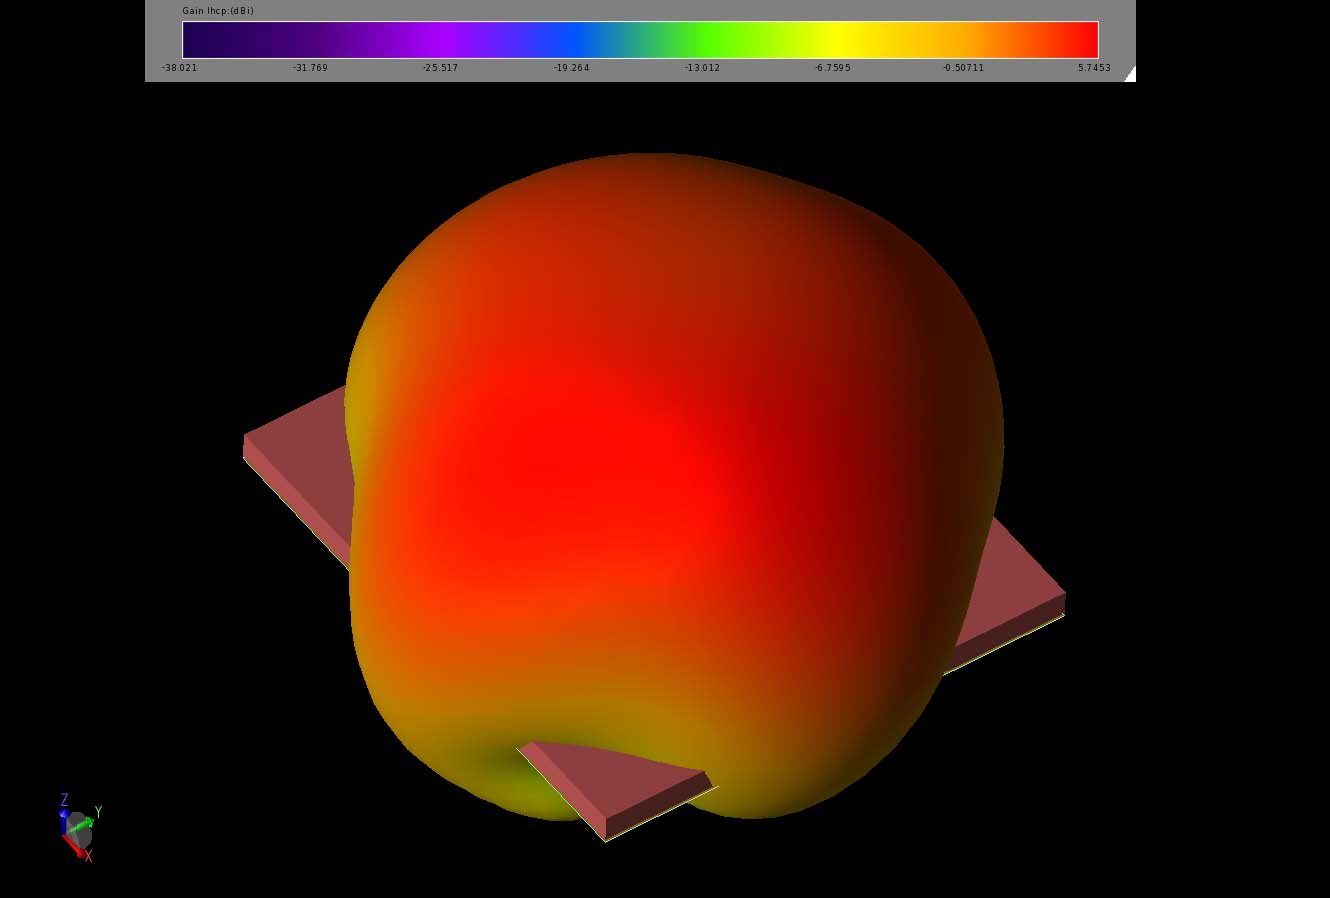
Figure 3: The gain pattern for the patch antenna has a uniform pattern above the substrate and a peak gain of 5.7 dBi.
Array Element
Each of the 4x4 elements of the large array consist of four single elements that are each rotated 90 degrees consecutively around a center point with a separation of 0.448 mm as shown in Figure 4. In this configuration, the antenna is tuned to operate over a band from about 11.35 to 14.7 GHz as shown in Figure 5 where each element has an identical return loss plot. The elements are fed with a sinusoidal source at 12.5 GHz with a 90-degree phase difference that increases with each element in a counterclockwise direction, resulting in a left-hand circular polarized gain pattern. Figure 6 shows the resulting symmetrical pattern with a peak gain of 9.5 dBi.
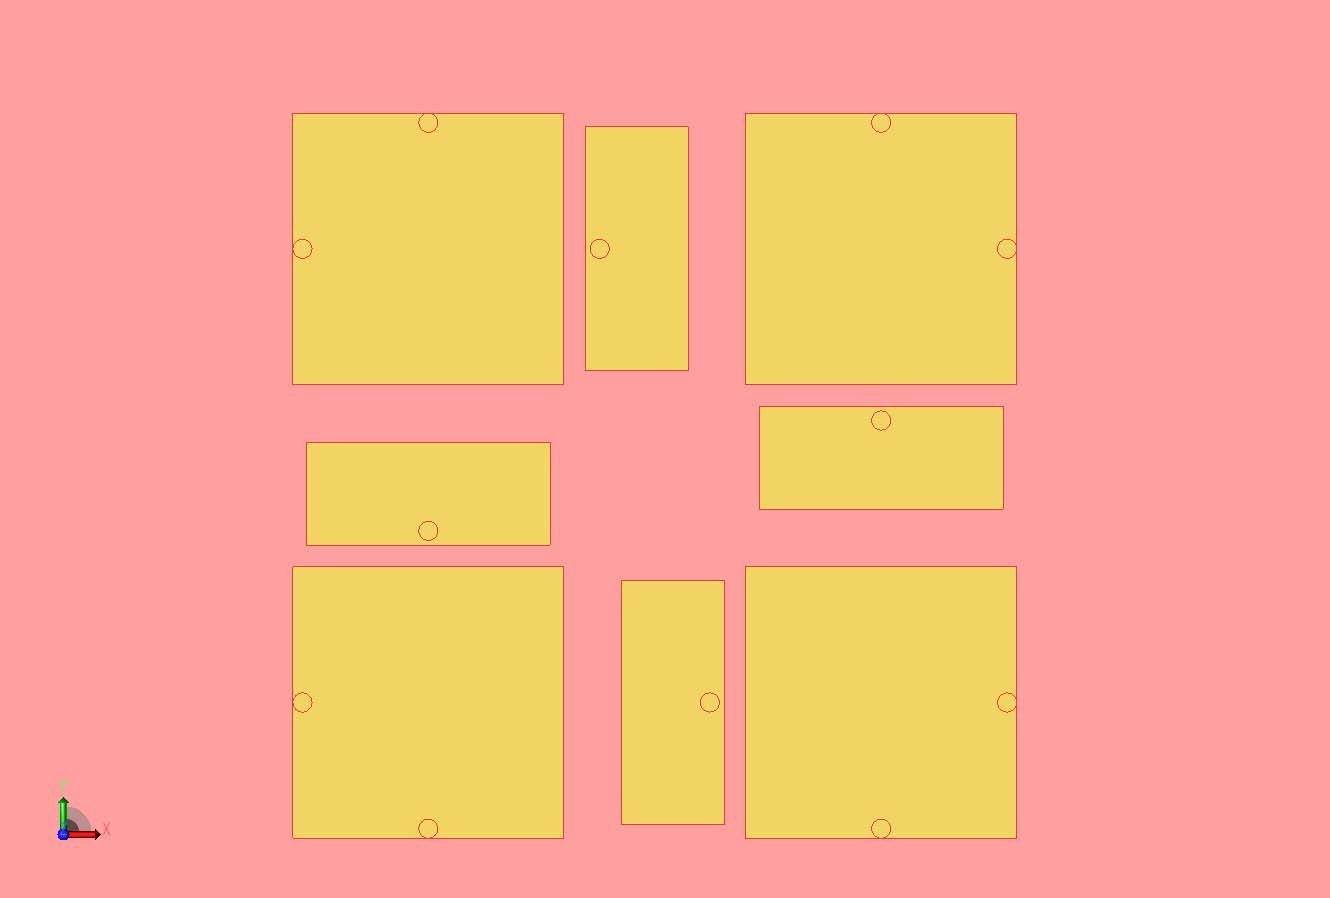
Figure 4: An array element is formed by combining four of the patch antennas into a square pattern with each patch rotated by 90 degrees.
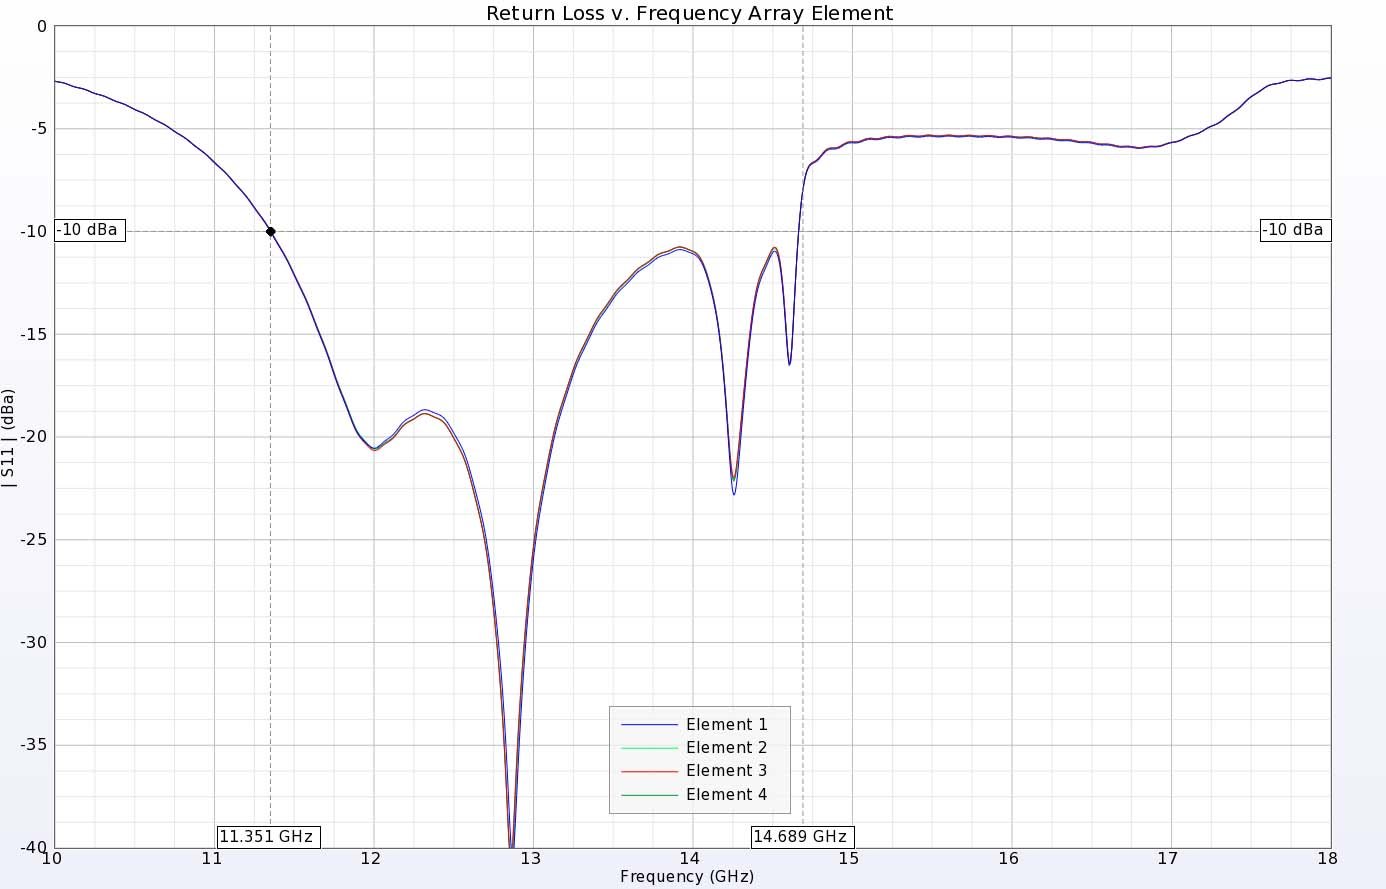
Figure 5: The return loss for the array element shows good performance between 11.3 and 14.7 GHz.
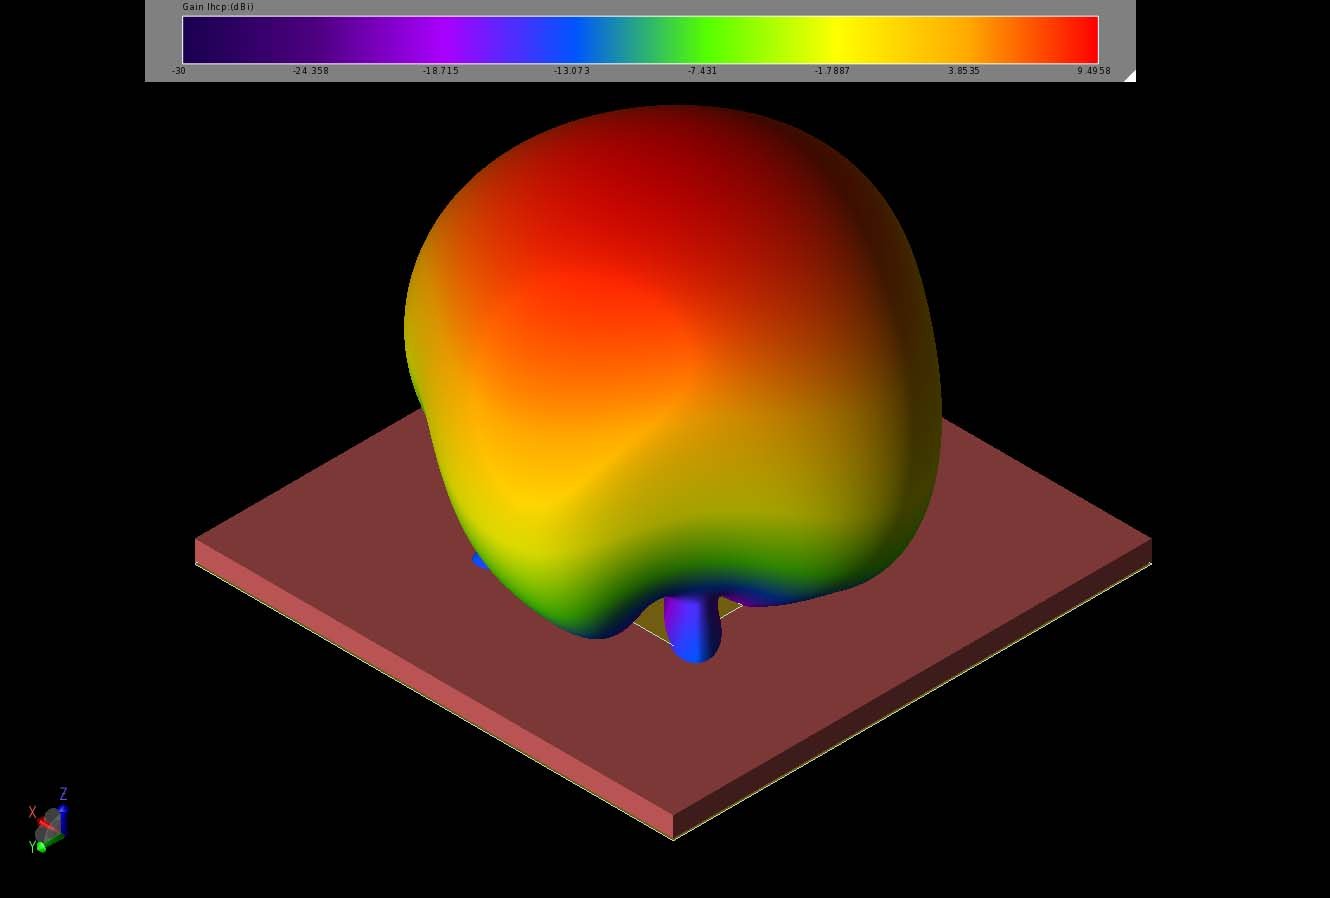
Figure 6: The array element has four patches that are fed with a phase shift that is increased by 90 degrees around the square. The resulting pattern has left hand circular polarization and a peak gain of 9.5 dBi.
Full Array
To form the full array, the array elements are laid out in a 4x4 pattern with a separation of 5.376 mm as shown in Figure 7. The array is first simulated on a larger substrate and ground plane to reduce the impact of edge effects on the performance. Due to the finite size of the ground plane, there are some effects in the return loss of the elements which are more sizeable on the array elements near the edges. In Figure 8, the return loss of the four patches of one of the center elements is shown with some variation visible and a rise in the level above -10 dB above the 12.5 GHz design frequency. Figure 9 shows more variation between the four elements for a corner element of the array that is near the ground plane edges but the performance at 12.5 GHz remains acceptable. The array produces a strong beam with gain of nearly 22 dBi and a 3 dB beamwidth of 15 degrees. The sidelobes are at least 12 dB less than the main beam.
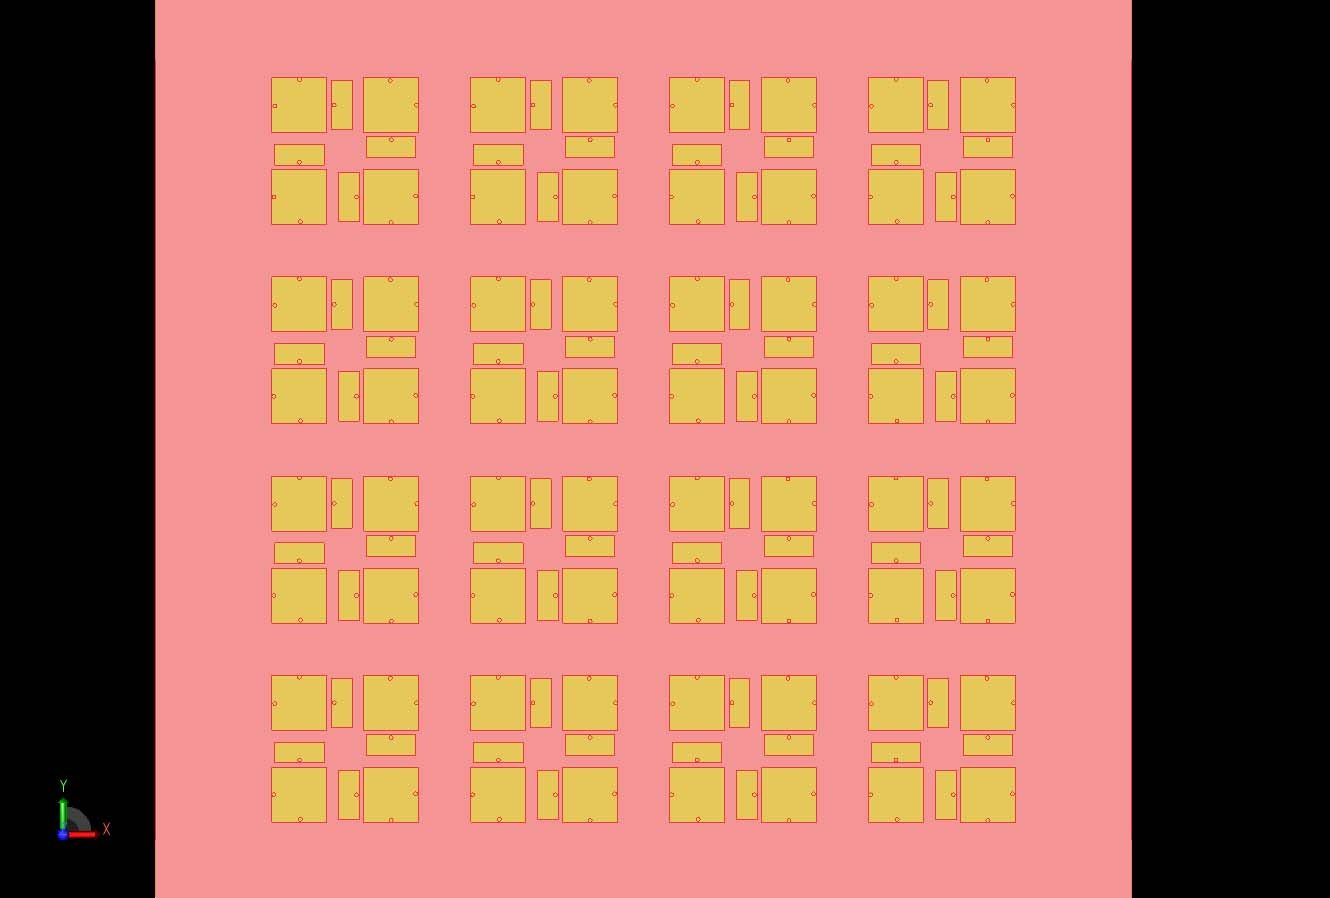
Figure 7: The array elements in a 4x4 configuration on a large ground plane are shown in a CAD representation.
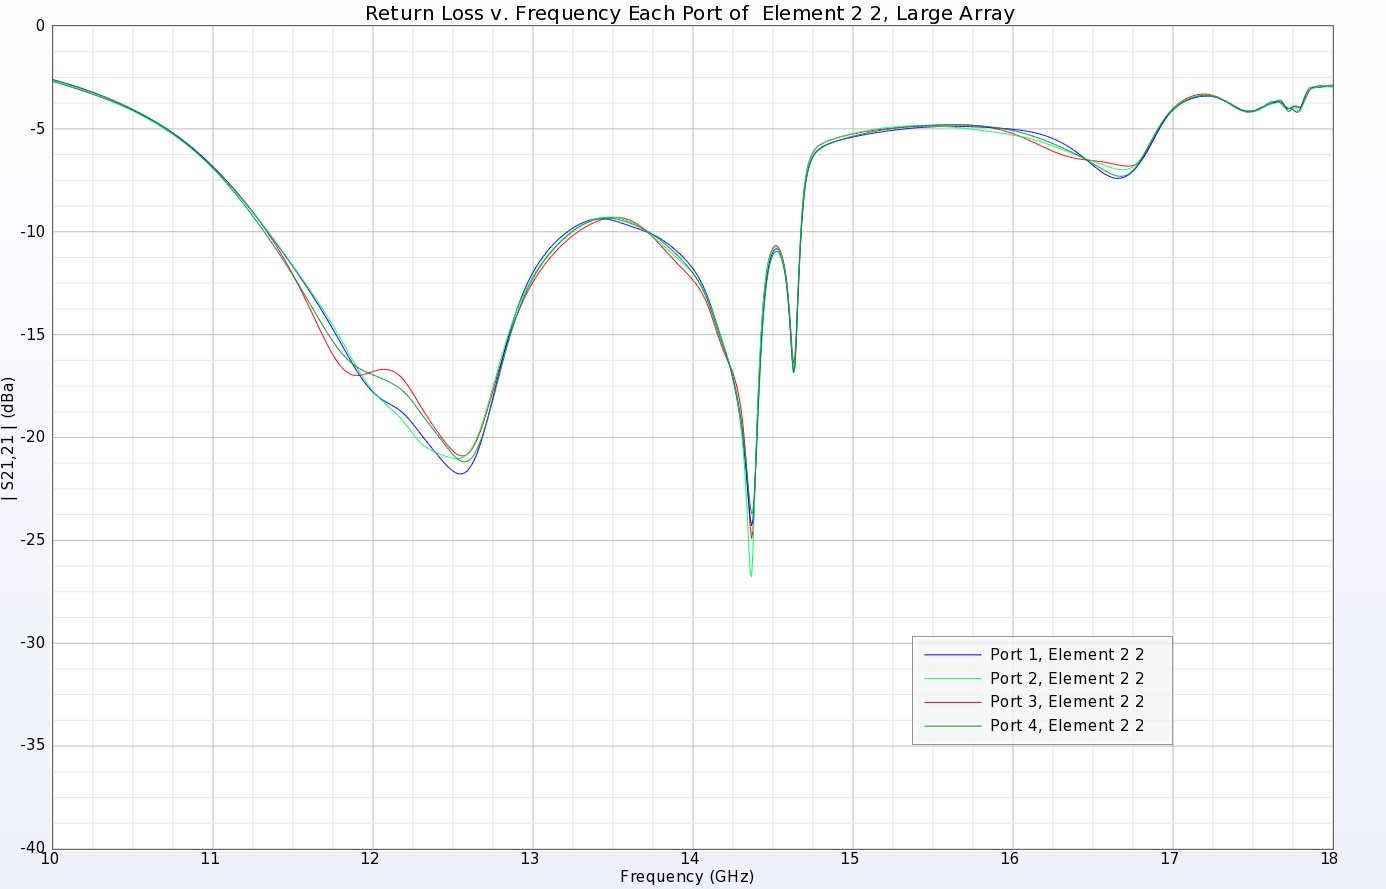
Figure 8: The return loss for one of the center array elements shows similar return loss for each of the four patches with only slight variations caused by adjacent elements and the ground plane edges.
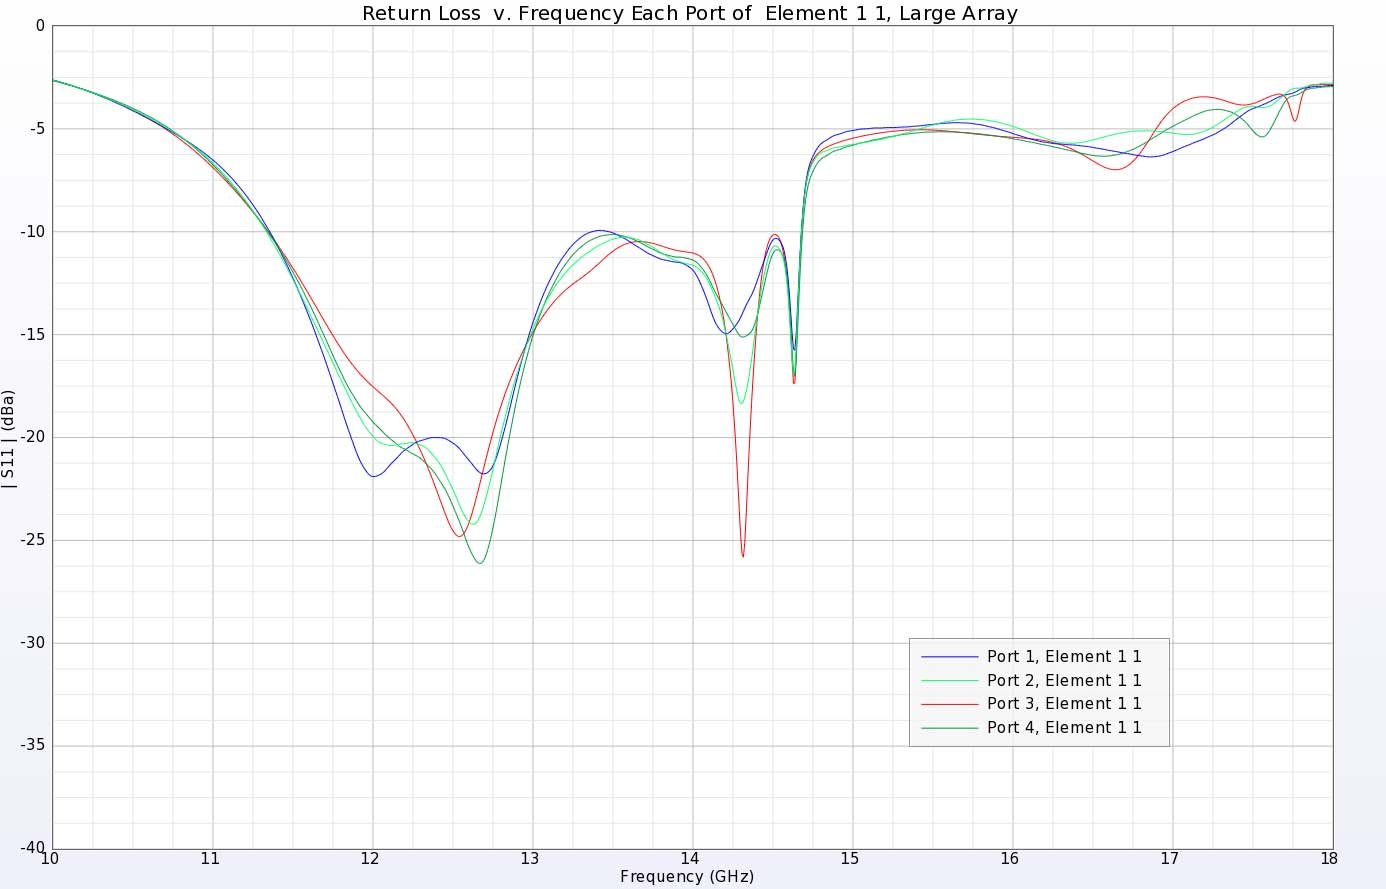
Figure 9: The return loss for a corner element of the array shows larger variations due to the edge effects from the ground plane. The performance is still good over the design frequency of 12.5 GHz.
Array on Device
For the proposed application of this example, the array is placed on a platform similar to a mobile device to gauge the performance. The dimensions of a typical mobile phone are smaller than the full array size of 76.5 x 76.5 mm. Here the width of the mobile device has been set at 79.5 mm to allow enough room to install the array and have a minimal separation distance between the edge of the device and the patches as shown in Figure 11. As was seen for the full array results, the presence of the ground plane edge will have an impact on the device performance. For the center elements of the array, the impact is not significant, as shown in Figure 12 where the variation in return loss between the patches is only slight. Figure 13 shows the greater impact on the return loss for the corner element of the array where wide variations are visible. At the design frequency of 12.5 GHz, the return loss is well below -10 dB for all elements, so the performance should not be impacted. The array produces a similar beam pattern in the mobile device configuration compared to the full array on a large ground plane, with slightly less gain of around 20.8 dBi as shown in Figure 14. When compared to the beam produced by the full array on a large ground plane, it can be seen that the sidelobes are also shifted and are generally larger on the mobile device platform. A polar plot of the gain in a cut through the long dimension of the device is shown in Figure 15 while a plot across the width of the phone is shown in Figure 16. While the edges of the device do reduce the performance of the array, there is still sufficient gain, low sidelobes, and good return loss over the frequency range of interest.
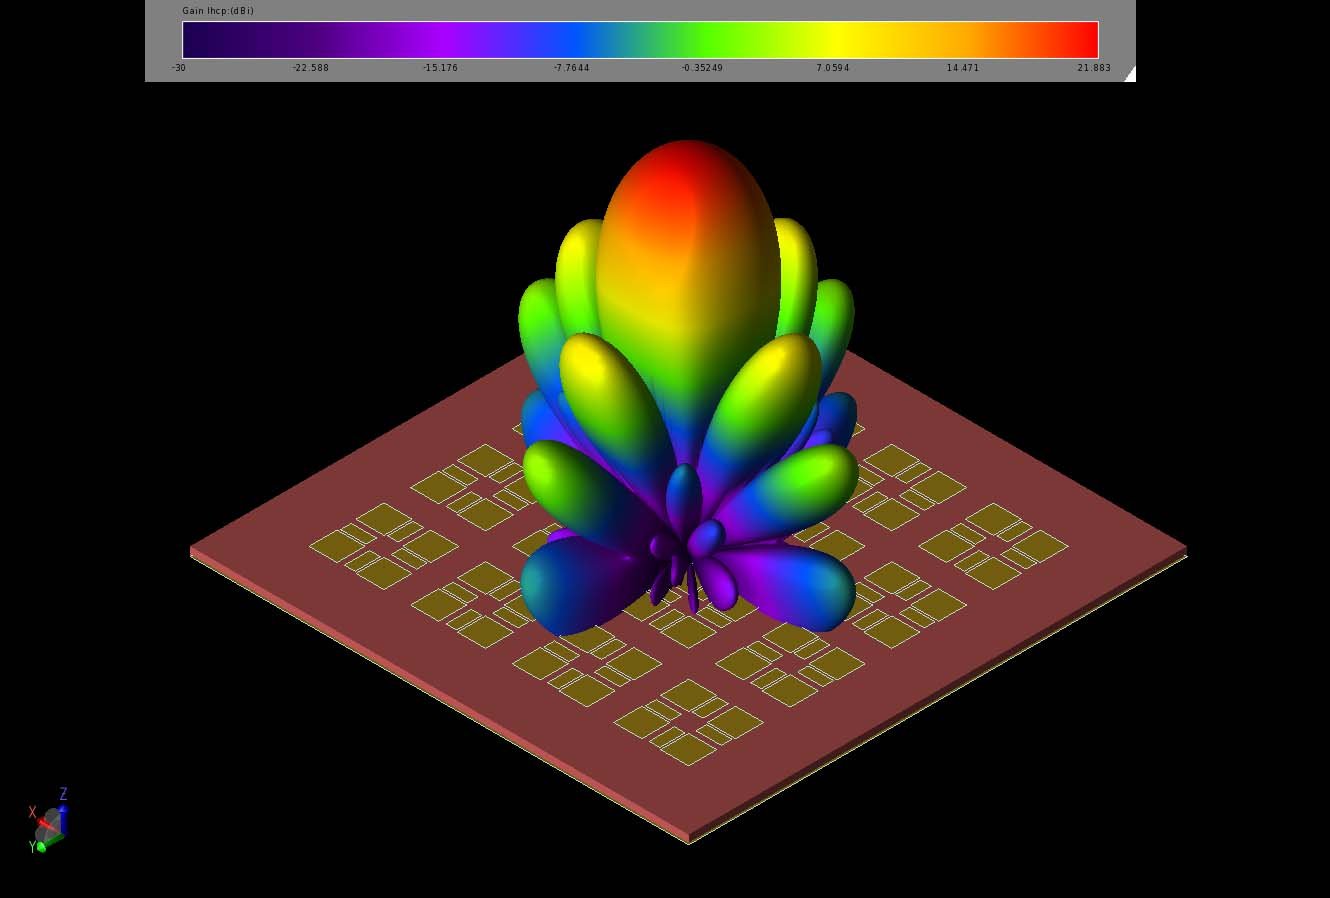
Figure 10: The 4x4 array produces a strong main beam with gain of 21.9 dBi.
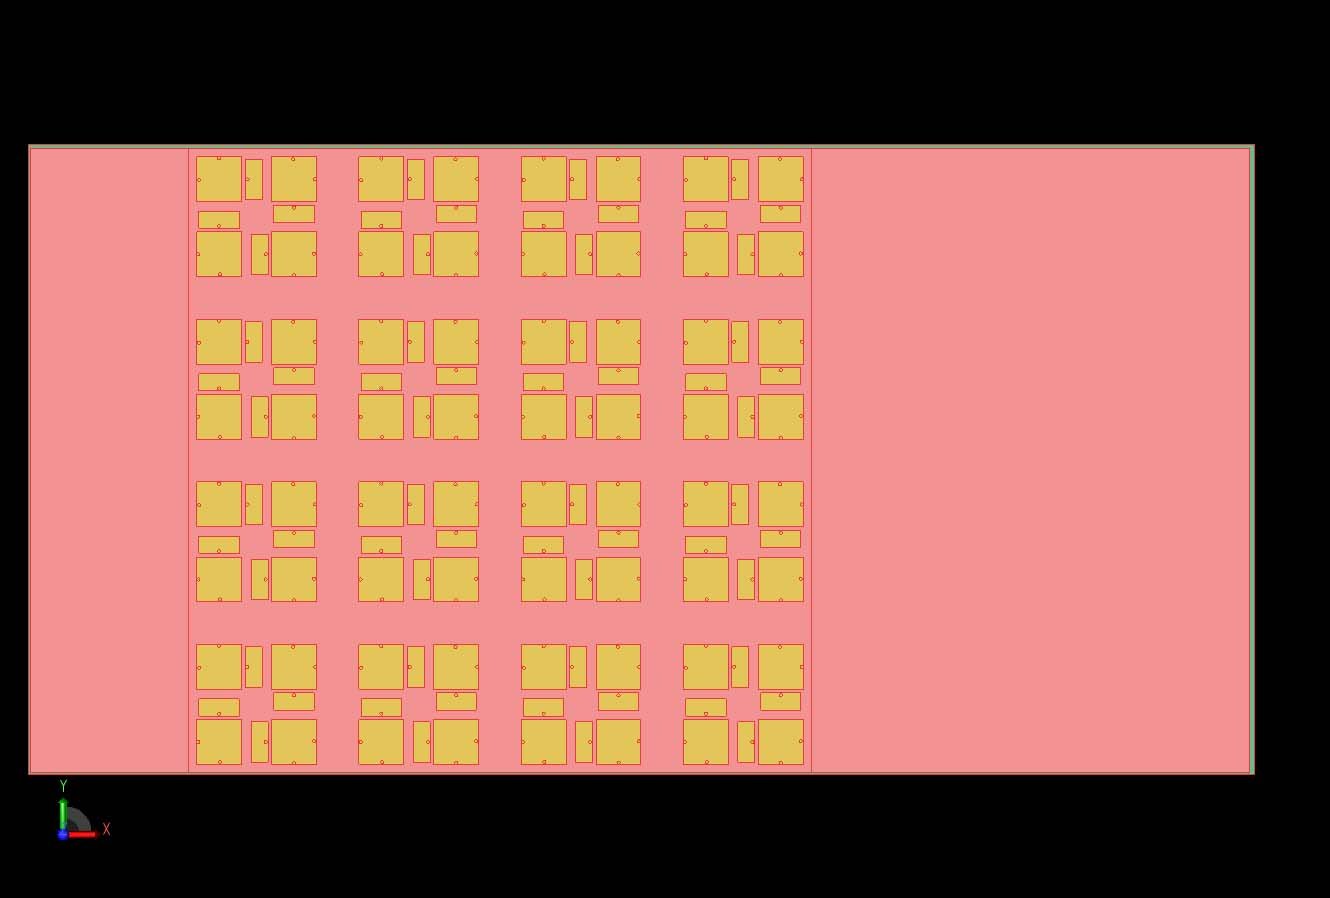
Figure 11: The 4x4 array is shown mounted on a mobile device with very limited separation between the frame of the phone and the array in the width dimension.
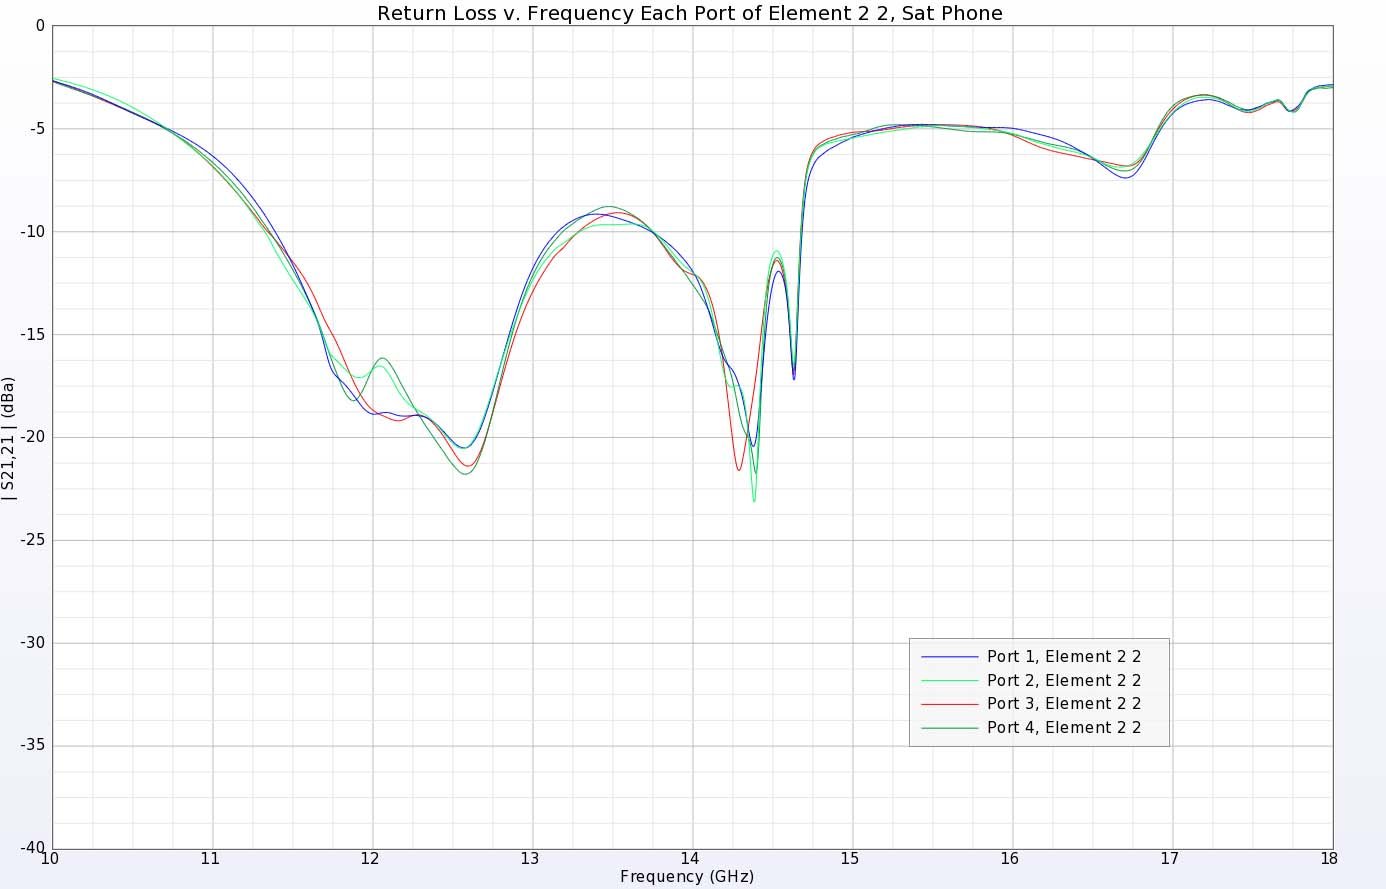
Figure 12: The return loss for a center element of the array shows some effects from the adjacent elements and the phone edges but still has good performance at the design frequency of 12.5 GHz.
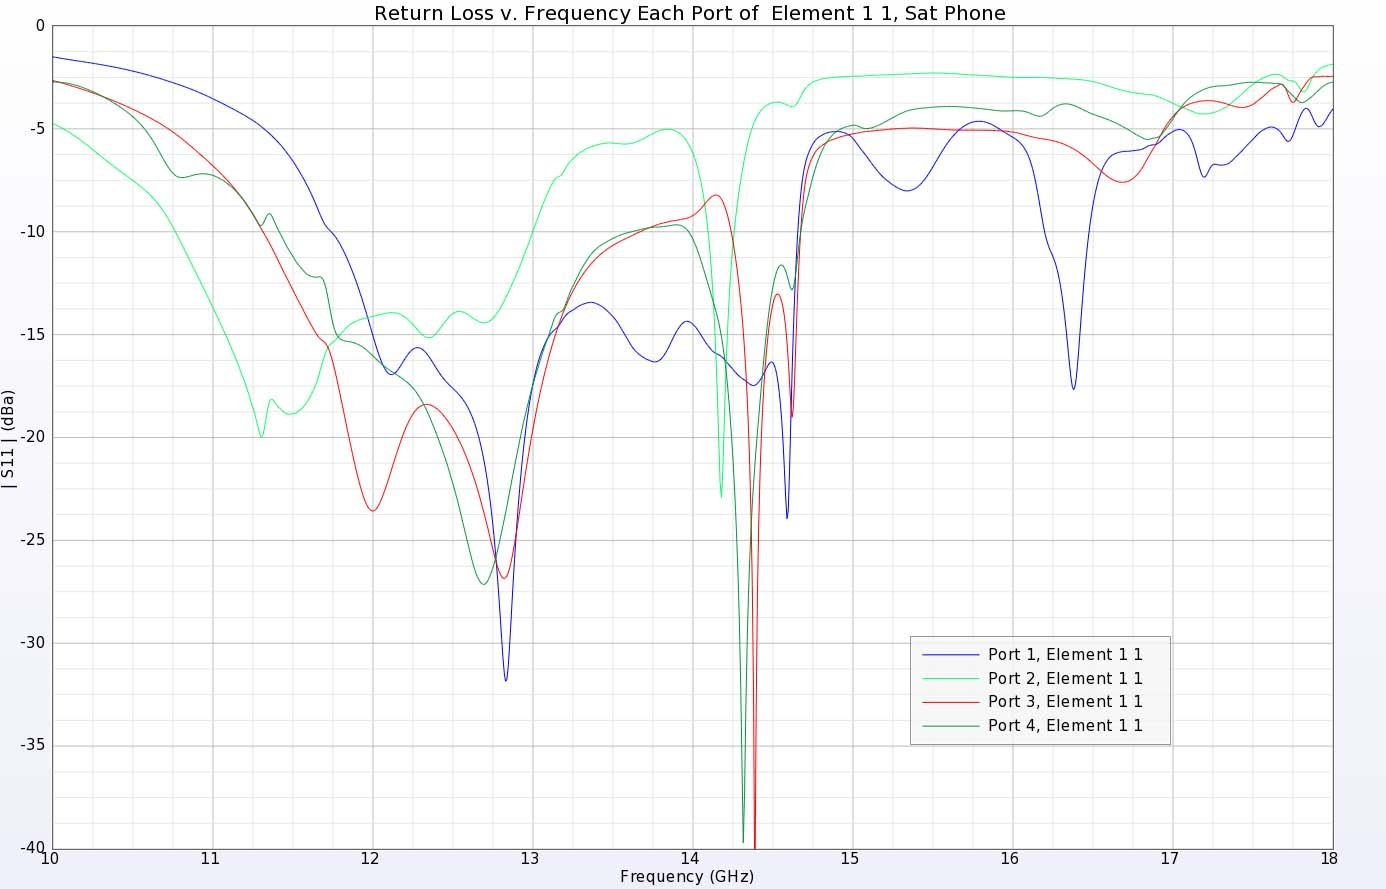
Figure 13: The corner elements show much larger impact from the edge effects of the phone frame but still maintain good performance at the design frequency of 12.5 GHz.
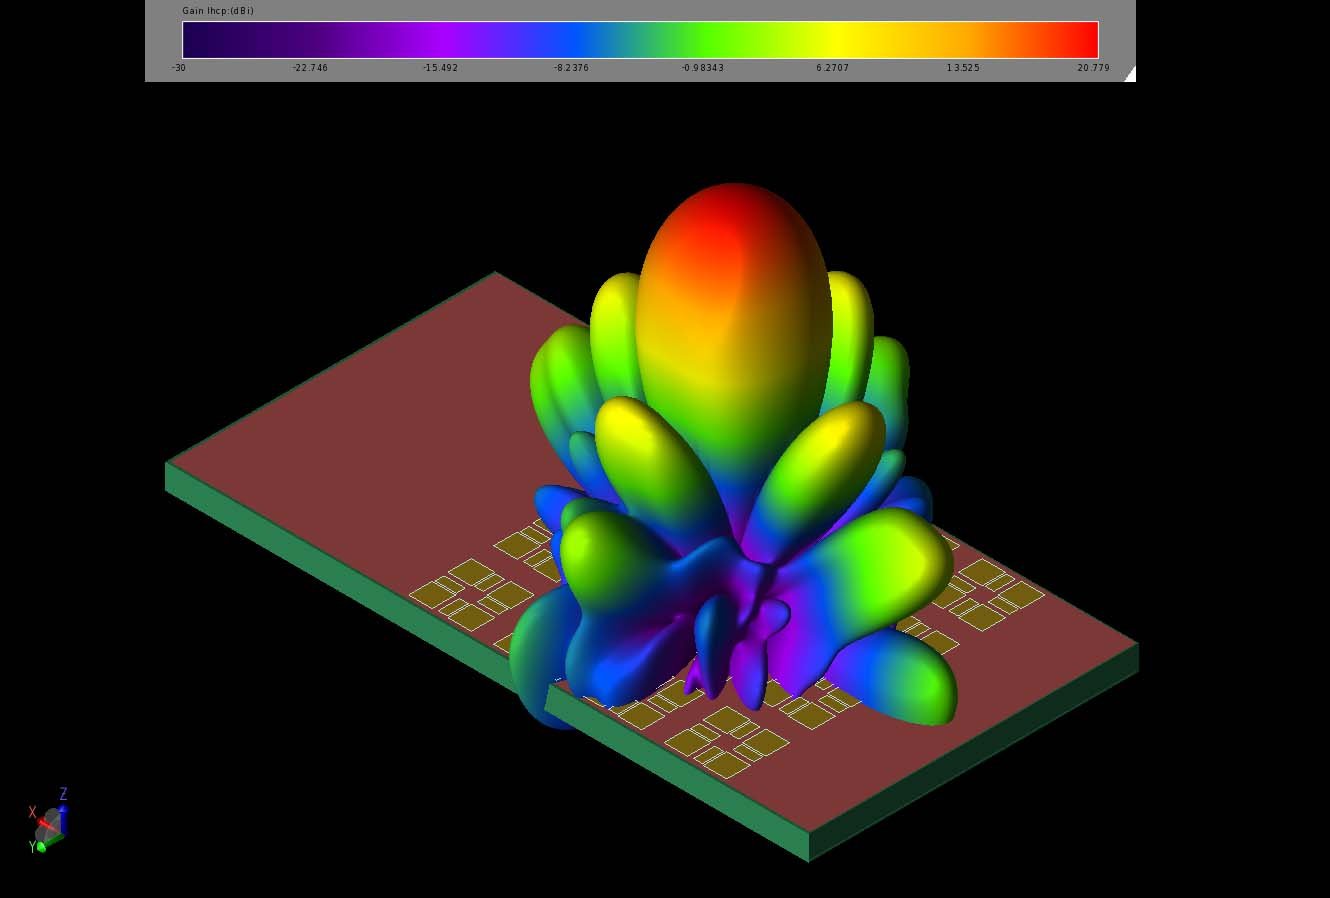
Figure 14: The gain pattern produced by the array is very similar when mounted on the phone versus on the larger ground plane. There are some changes in the gain level and the sidelobes though.
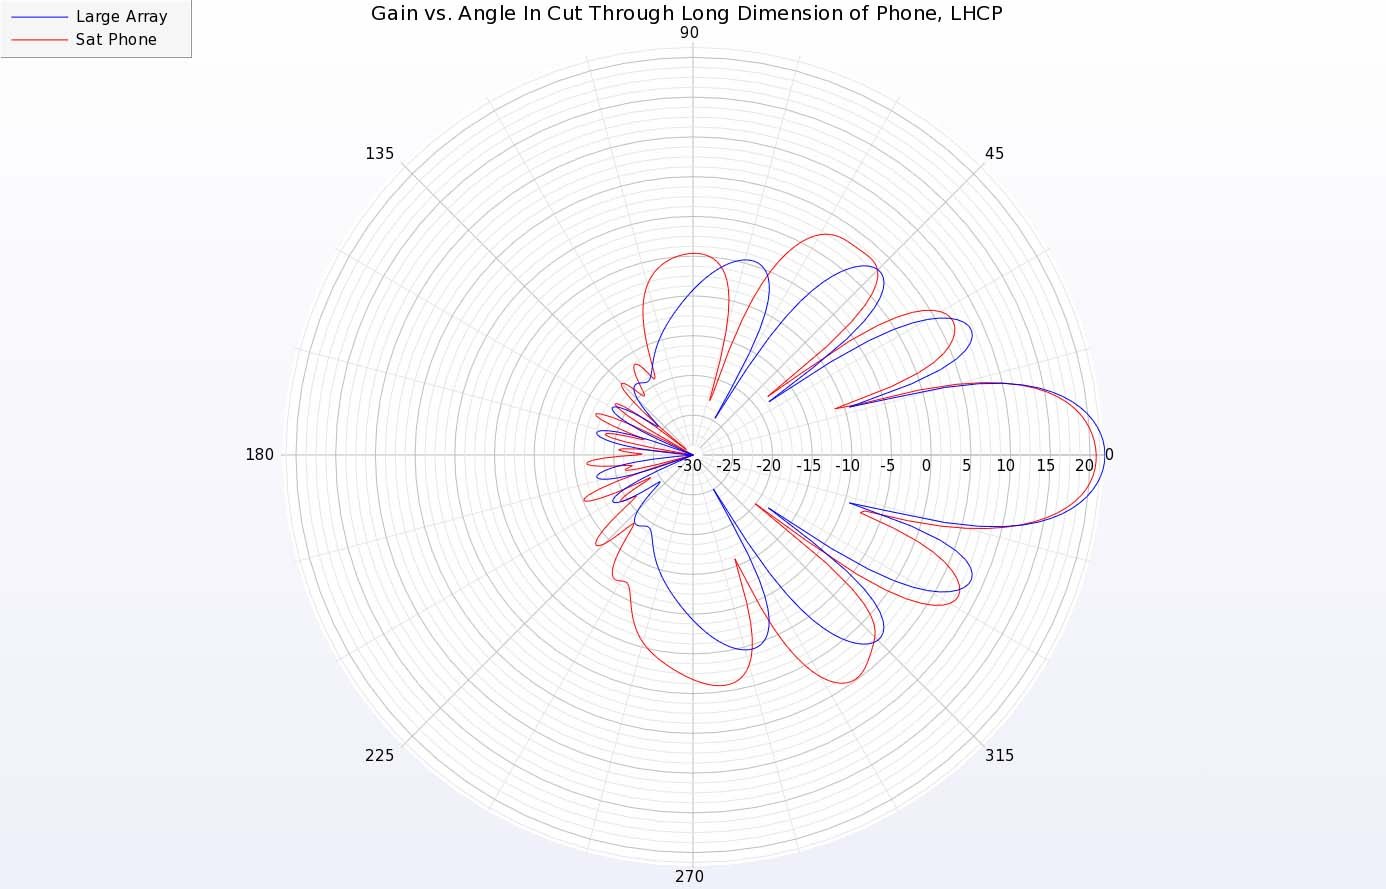
Figure 15: A polar plot of the gain patterns of the array on the large ground plane compared with the configuration on the mobile device shows the variations in the sidelobe levels and positions. This plot is a cut through the long dimension of the phone body. There is also a slight drop in gain of the main beam when mounted on the smaller phone platform.
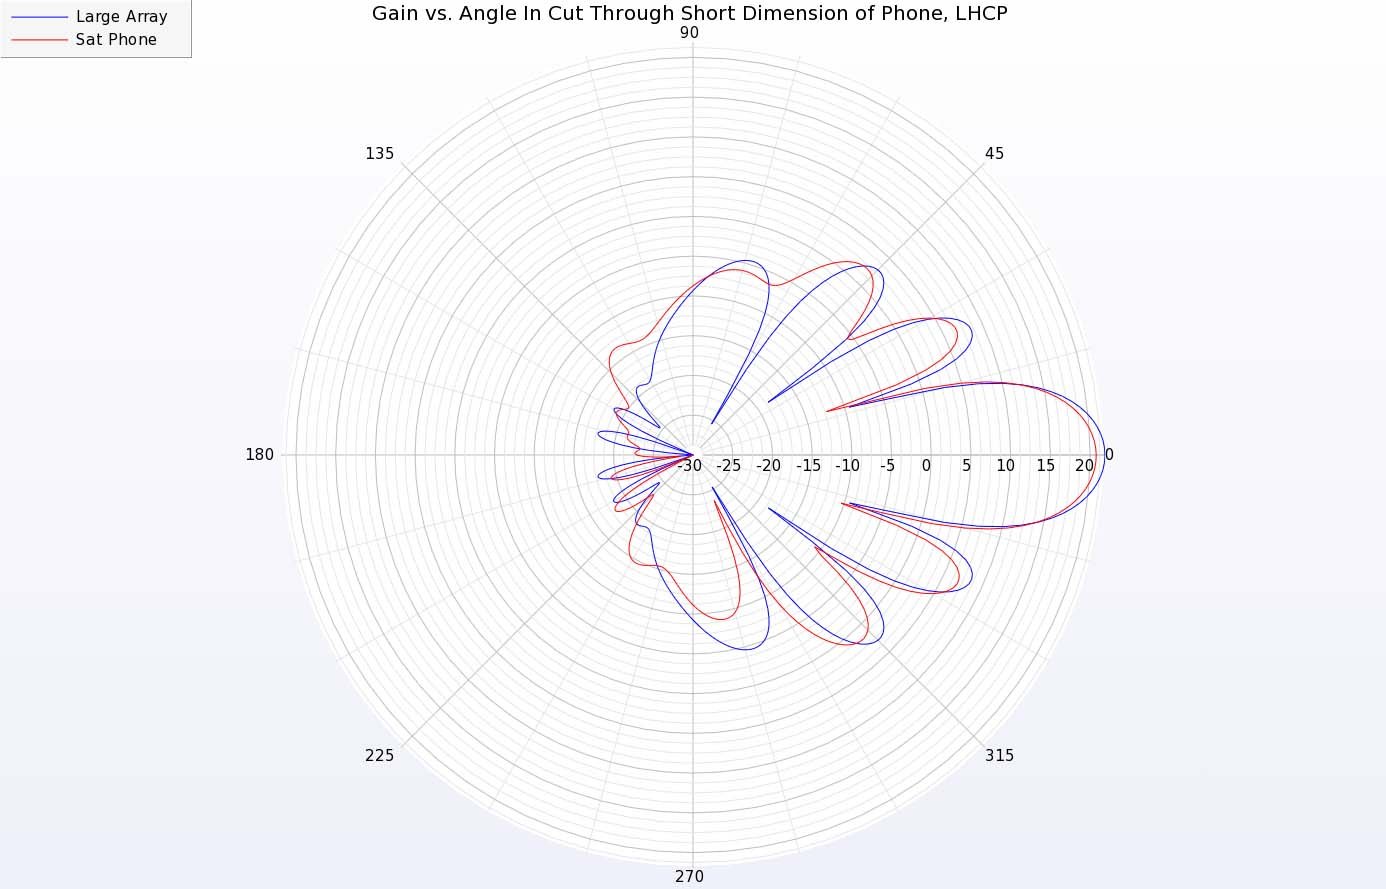
Figure 16: A polar plot of the gain patterns of the array on the large ground plane compared with the configuration on the mobile device shows the variations in the sidelobe levels and positions. This plot is a cut through the short dimension of the phone body. There is also a slight drop in gain of the main beam when mounted on the smaller phone platform.
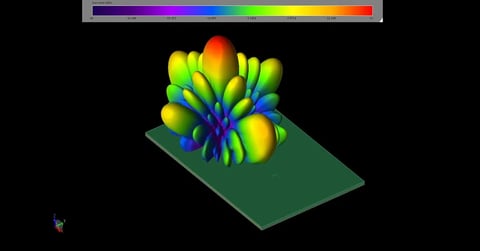
The beam of the array can be steered by modifying the phase shift across the array elements. In Figure 17, a beam is produced that has maximum gain 16 degrees off from the vertical direction. This beam is generated by increasing the phase shift to each row of elements by 90 degrees along the long direction of the device. Similarly, many other beams can be produced with different phase settings. Figure 18 shows the max hold pattern of possible beams from 0 to 60 degrees down from the vertical in 5-degree increments and 15-degree steps around in azimuth. As can be seen, a large range of coverage is possible from the array with gain at nearly 19 dBi over a +/- 60-degree range.
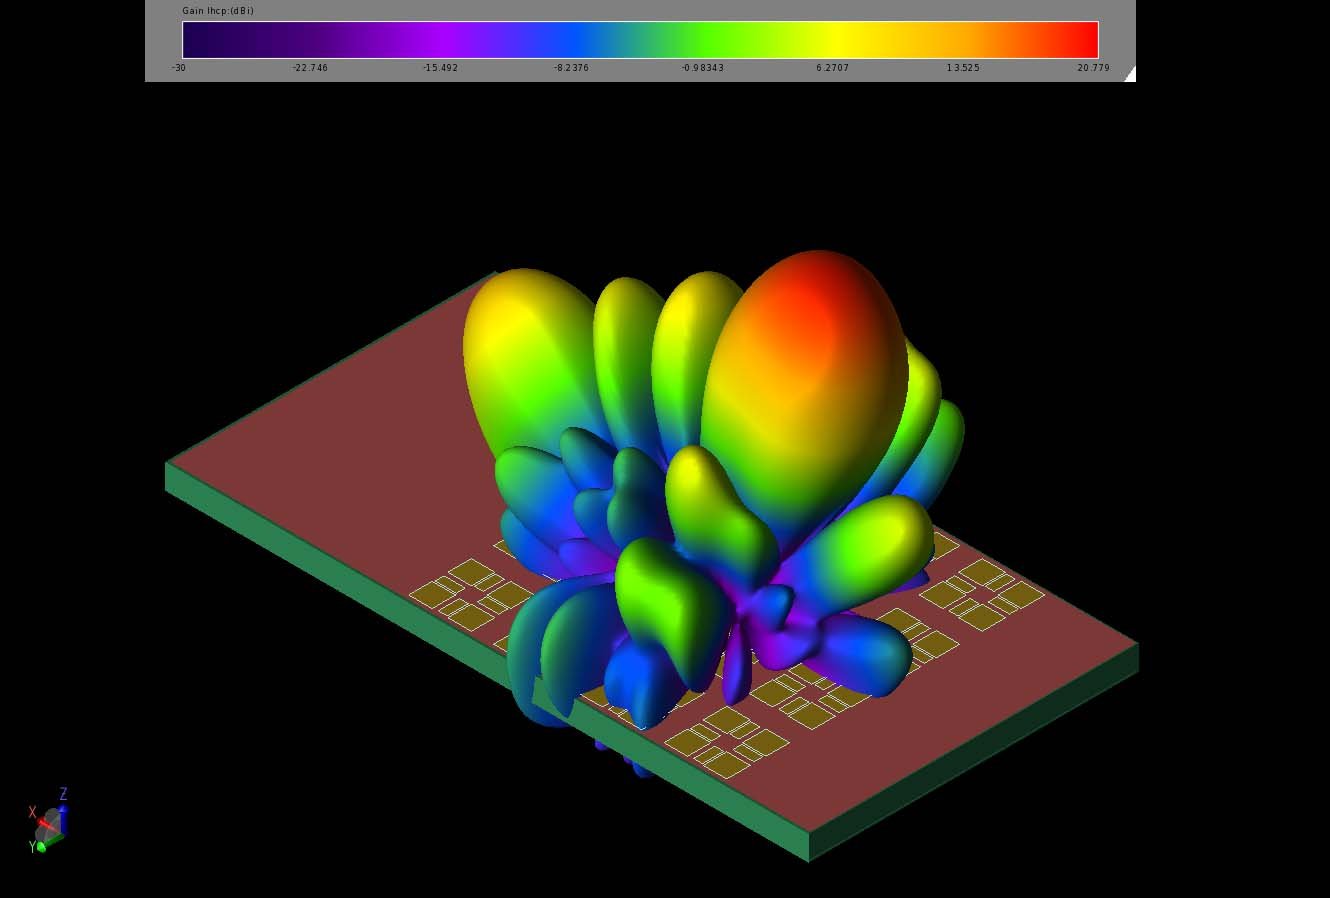
Figure 17: A beam tilted by 16 degrees from the vertical is shown. This beam was produced by varying the phase along the long dimension of the phone by 90 degrees between each row of the array.
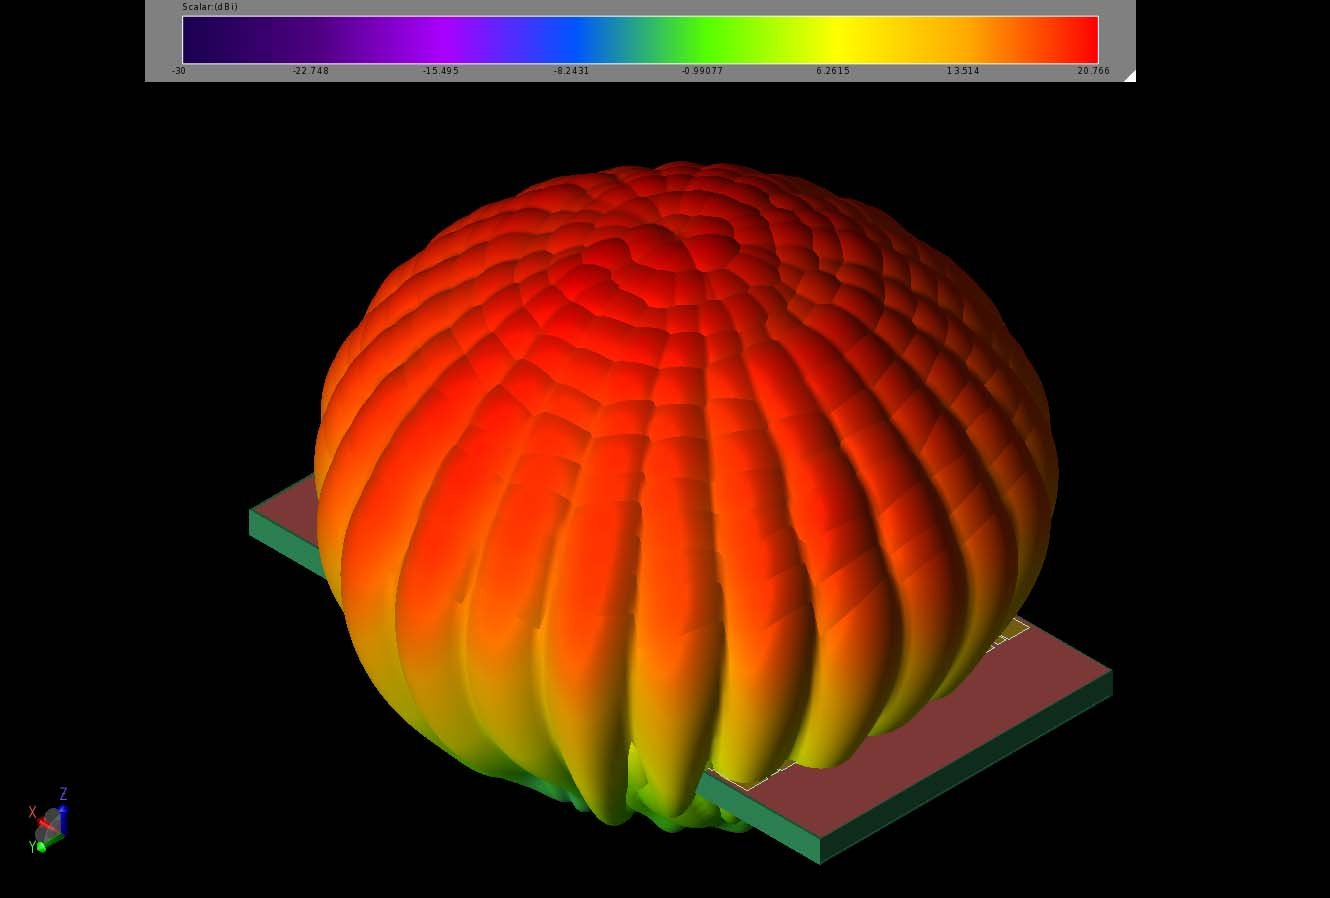
Figure 18: A max hold pattern of the beams produced by the phone is shown with angular variations of +/- 60 degrees from the vertical in 5-degree steps and 15-degree steps in the azimuthal direction. The pattern generated covers the full half sphere with high gain beams.
Summary
This example analyzed the performance of a Ku-Band satellite antenna in a mobile device setting as a test of concept. The array has some performance losses due to the small dimensions of the platform, but still produced high gain and broad coverage at the design frequency.
Reference:
C. Karlsson, P. Cavero, T. Tekin and D. Pouhè, "A new broadband antenna for satellite communications," 2014 IEEE-APS Topical Conference on Antennas and Propagation in Wireless Communications (APWC), 2014, pp. 800-803, doi: 10.1109/APWC.2014.6905588.