Monte Carlo provides an opportunity to handle uncertainty in a scenario by randomly sampling input parameters to obtain results for each unique situation and providing a bound for best and worst case scenarios. It is a way to determine the sensitivity of the results to a parameter within a scene. Wireless InSite utilizes the Monte Carlo concept to vary project parameters such as material type, material properties, transmitter power, and frequency. For example, if you don't know whether the buildings in a scene are predominantly glass or concrete you can set the material of the buildings to a Monte Carlo multi-material to determine the maximum and minimum received power to bound how much impact the variation of the material type could have on your results. Likewise, if your material properties ( e.g. conductivity or permittivity) are uncertain you can use a Monte Carlo variable parameter single layer material to explore the sensitivity of the results to changes in permittivity, conductivity, roughness, or thickness. Simulating various scenarios utilizing the Monte Carlo concept not only saves time when compared to measurement but also saves time when compared to running the simulations individually. The Monte Carlo utility within Wireless InSite pseudo-randomly samples from the distributions provided to produce a statistical estimate of the max, min, etc. based on the parameters requested.
Within this example, a Monte Carlo variable parameter single layer material is defined and applied to buildings within a city. The simulation is run using Wireless InSite’s X3D model and the results are examined for the best and worst case scenario. A Monte Carlo variable parameter single layer is defined as one material definition that contains a range of values for permittivity, conductivity, roughness, and thickness. Another option would be to use the Monte Carlo multi-material which allows the user to vary the material types such as concrete or asphalt to test different conditions.
The first step is to open a city file and associated terrain file. In this case the Rosslyn city and terrain files that are provided in the software were used. Figure 1 shows what the scenario will look like after opening these files.
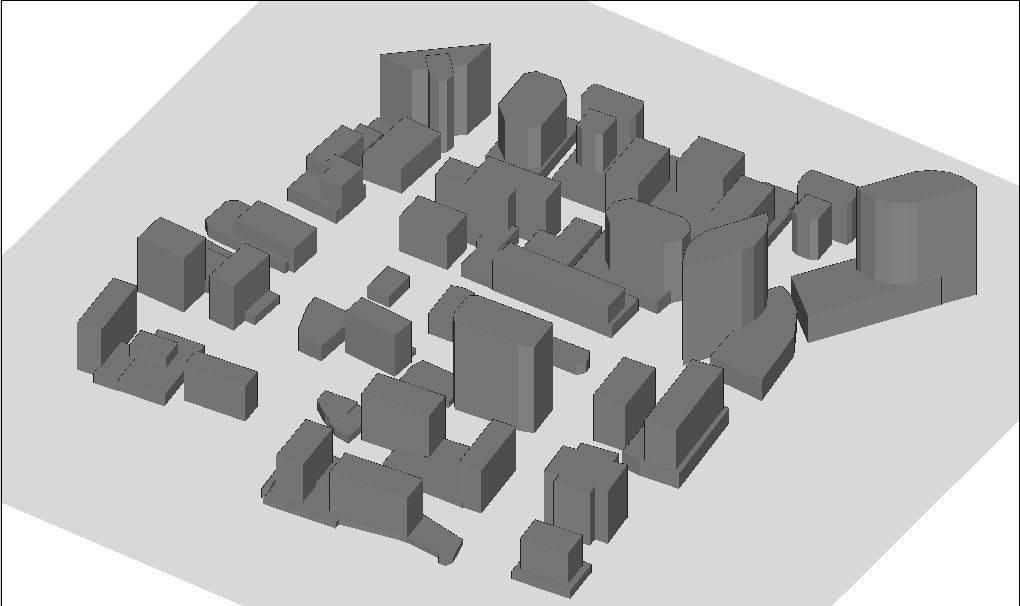
Figure 1: Scenario after the city and terrain files have been opened within Wireless InSite.
Wireless InSite can overlay an image on top of any terrain feature. These can include street imagery, foliage imagery, terrain imagery, etc. The formats accepted are GeoTIFF and TIFF files. After a street imagery geoTiff file is imported into the software, the scenario will look like Figure 2.
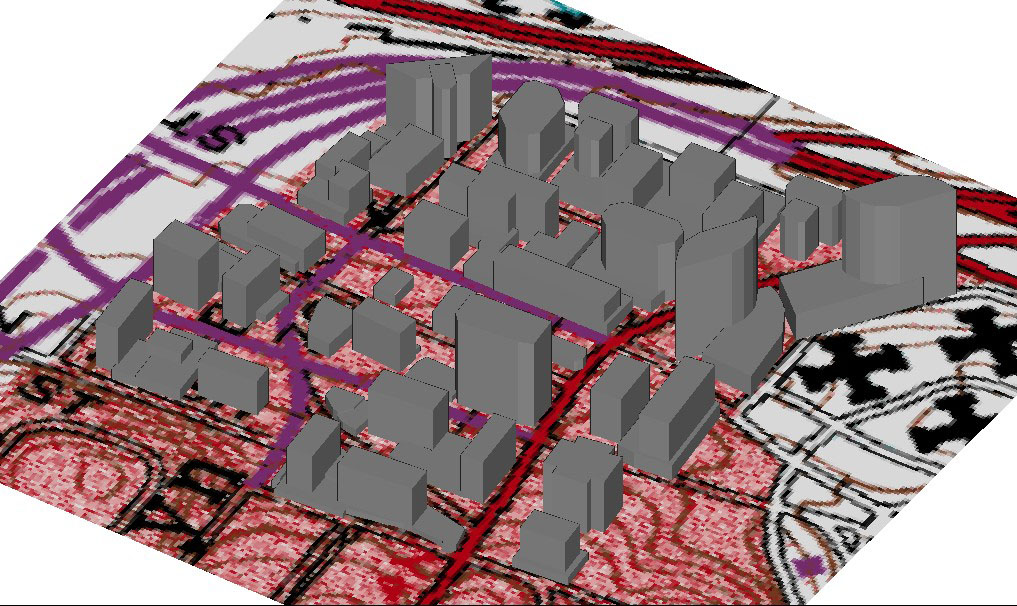
Figure 2: Scenario after imagery file has been imported.
The next step is to define the Monte Carlo variable-parameter single layer material within Wireless InSite. Defining the variable-parameter material is similar to defining a normal material within Wireless InSite. The material properties window can be seen in Figure 3. The material parameter is defined by clicking the Monte Carlo button next to each parameter. In this case, the permittivity is varied from 2 to 10 with 6 being the mid-point. Figure 4 shows how the Monte Carlo variation is defined for this case. The distribution definition is defined here as well. The choices are Uniform and Normal. In this case, Uniform will be chosen. Once the Monte Carlo variation is active for the permittivity, the initials “MC” will be displayed next to the parameter, as seen in Figure 5.
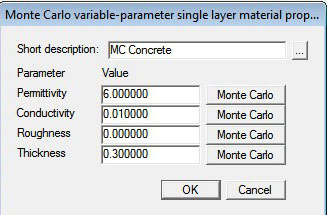
Figure 3: Monte Carlo variable-parameter property window.
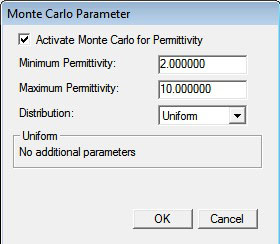
Figure 4: Monte Carlo parameter window.
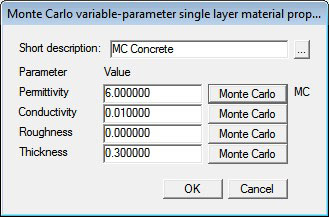
Figure 5: Monte Carlo variable-parameter window after Monte Carlo has been activated.
Once the rest of the scenario parameters are defined, which include transmitter locations, receiver locations, antennas, and waveforms, the propagation model can be defined. The receiver locations were set to be a route down the middle of the street. In this case the X3D model is used, which provides the Monte Carlo ability, along with GPU acceleration. The propagation model is defined under the study area properties window within Wireless InSite. The number of iterations for the Monte Carlo evaluation can be defined along with the related statistical output as seen in Figure 6. The complete setup with the transmitter and receiver route can be seen in Figure 7.
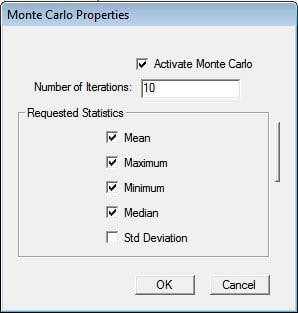
Figure 6: Monte Carlo properties window.
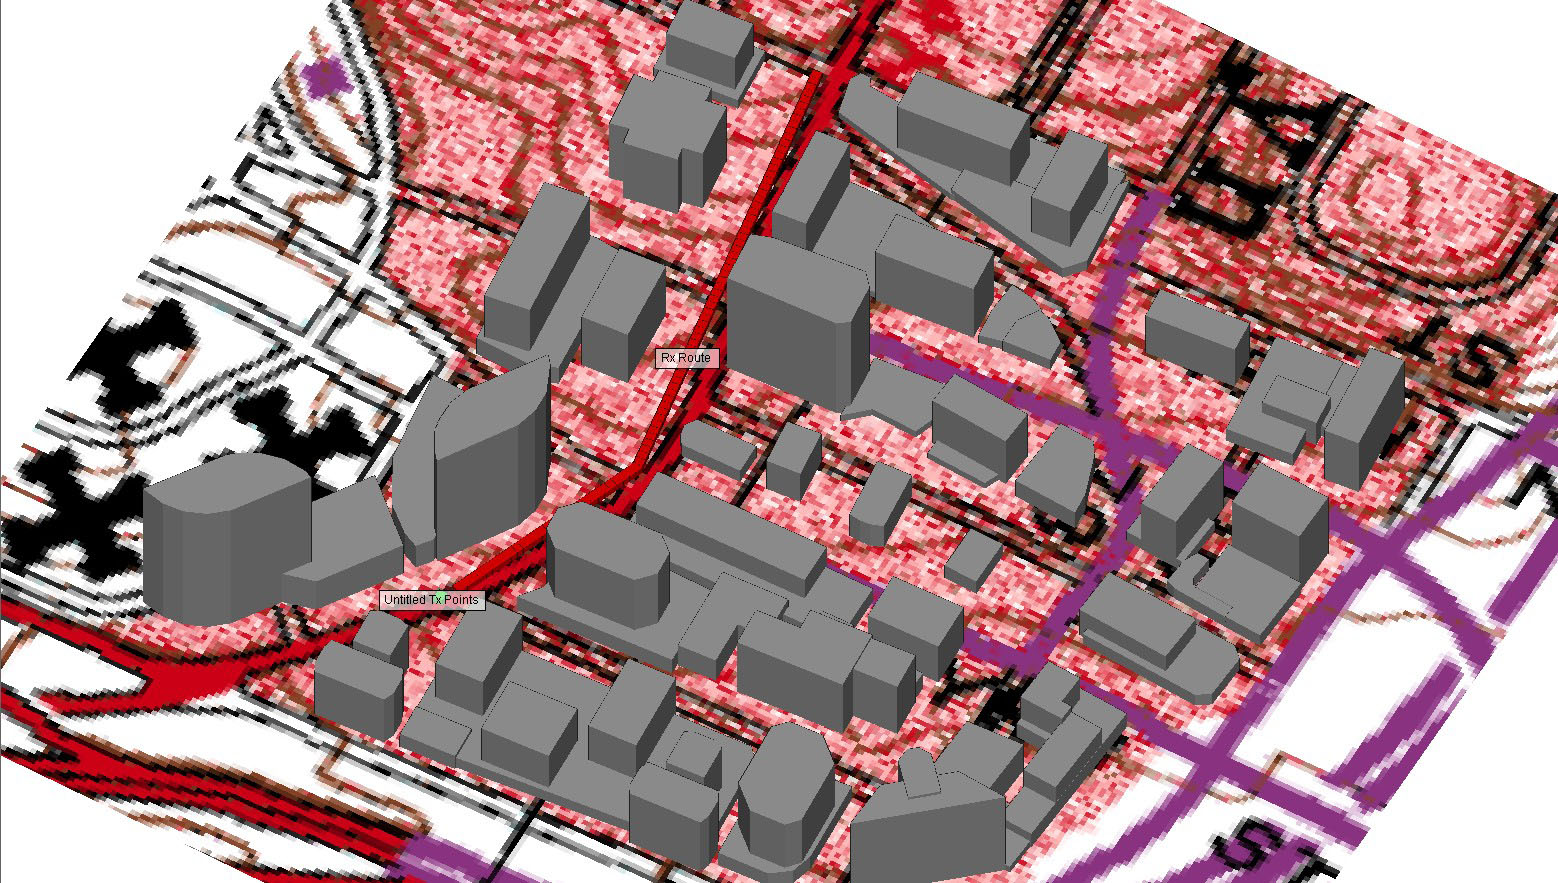
Figure 7: Complete scene within the Wireless InSite GUI.
Figure 8 shows the minimum, mean, and maximum received power for a route of receivers down the street in the city. The graph shows that as the receivers get further away from the transmitter there is more of a difference between the minimum and maximum values. At 70 m there is a difference of 11dBm. At 10 m from the transmitter there is less than 2dBm difference. This shows the impact that the material types have on propagation through the scene. The graph represents the best (maximum) and worst(minimum) case scenarios within a scene, and they allow the user to better understand how the material variation will affect their final results.
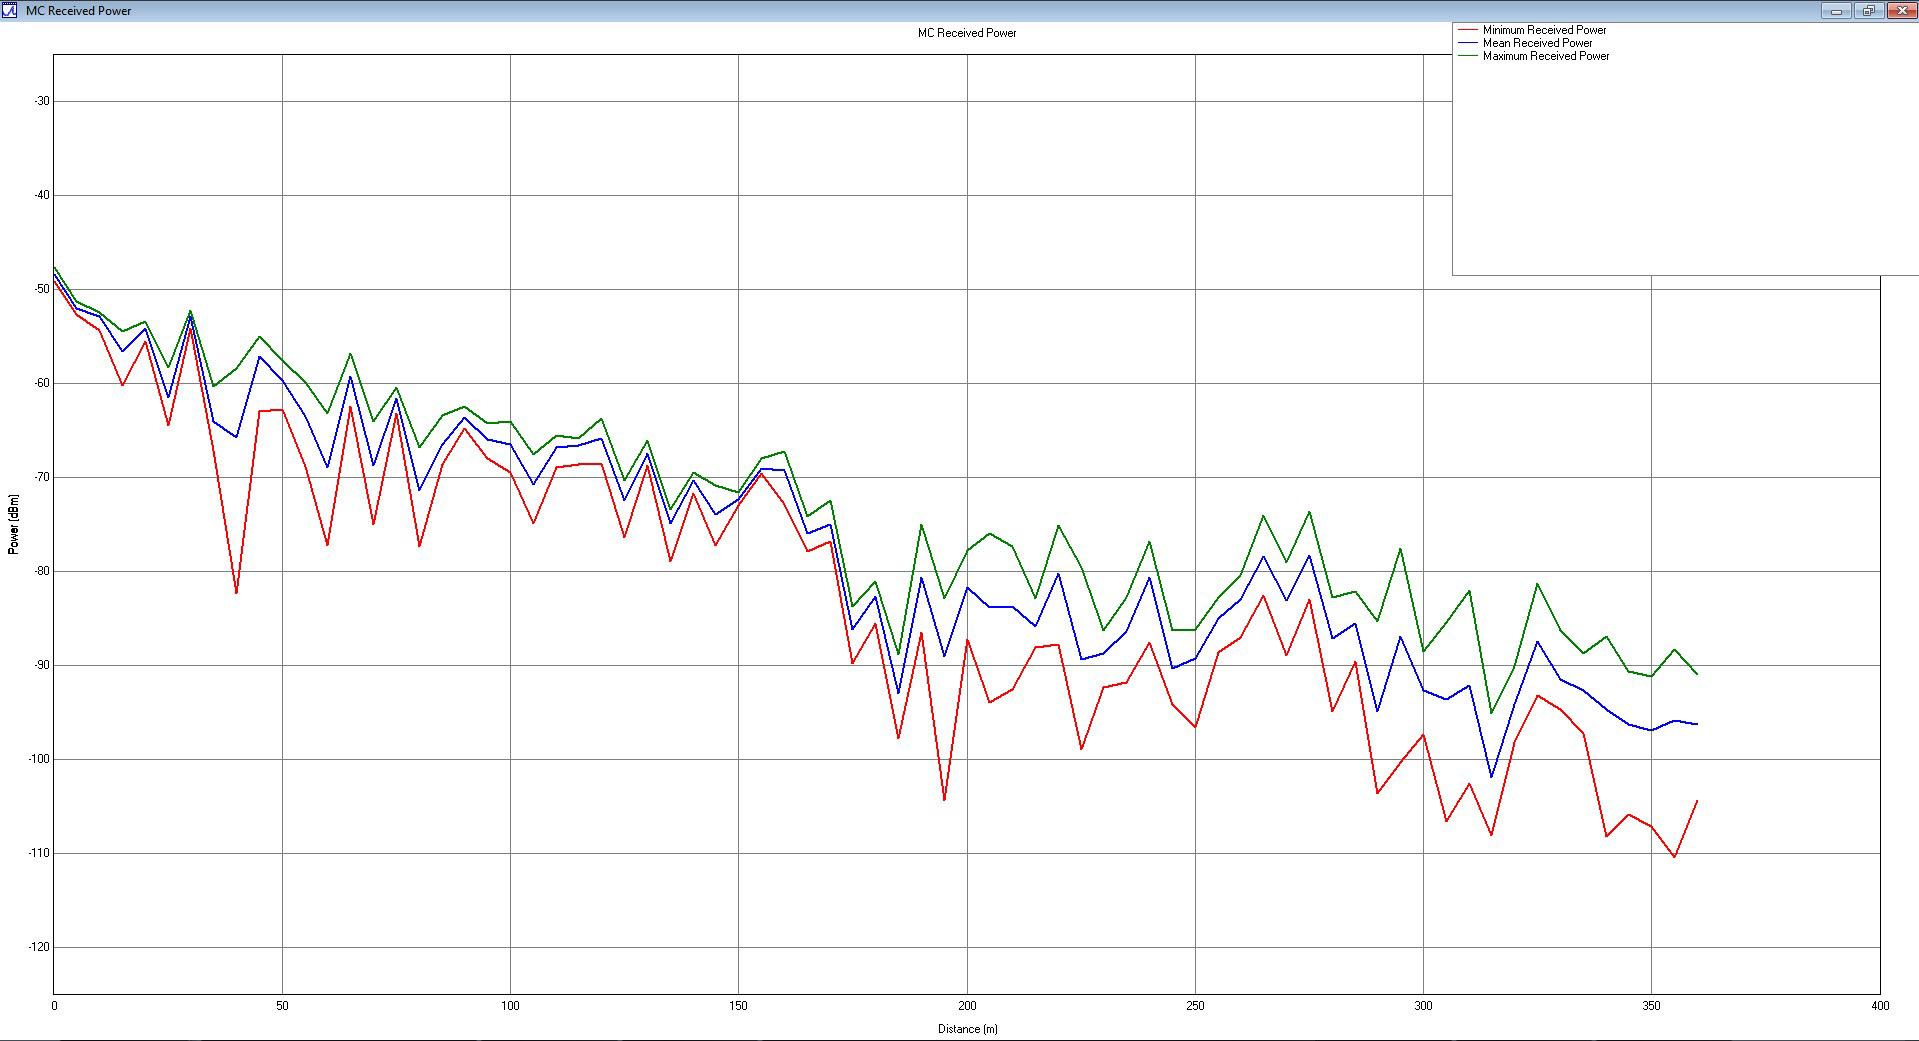
Figure 8: Minimum, mean, and maximum received power as a result of Monte Carlo simulations.
Received power is not the only output that is compatible with the minimum, mean, and maximum statistical output from the Monte Carlo materials. Wireless InSite also calculates these values for path loss and path gain. Figure 9 depicts path gain Monte Carlo results.
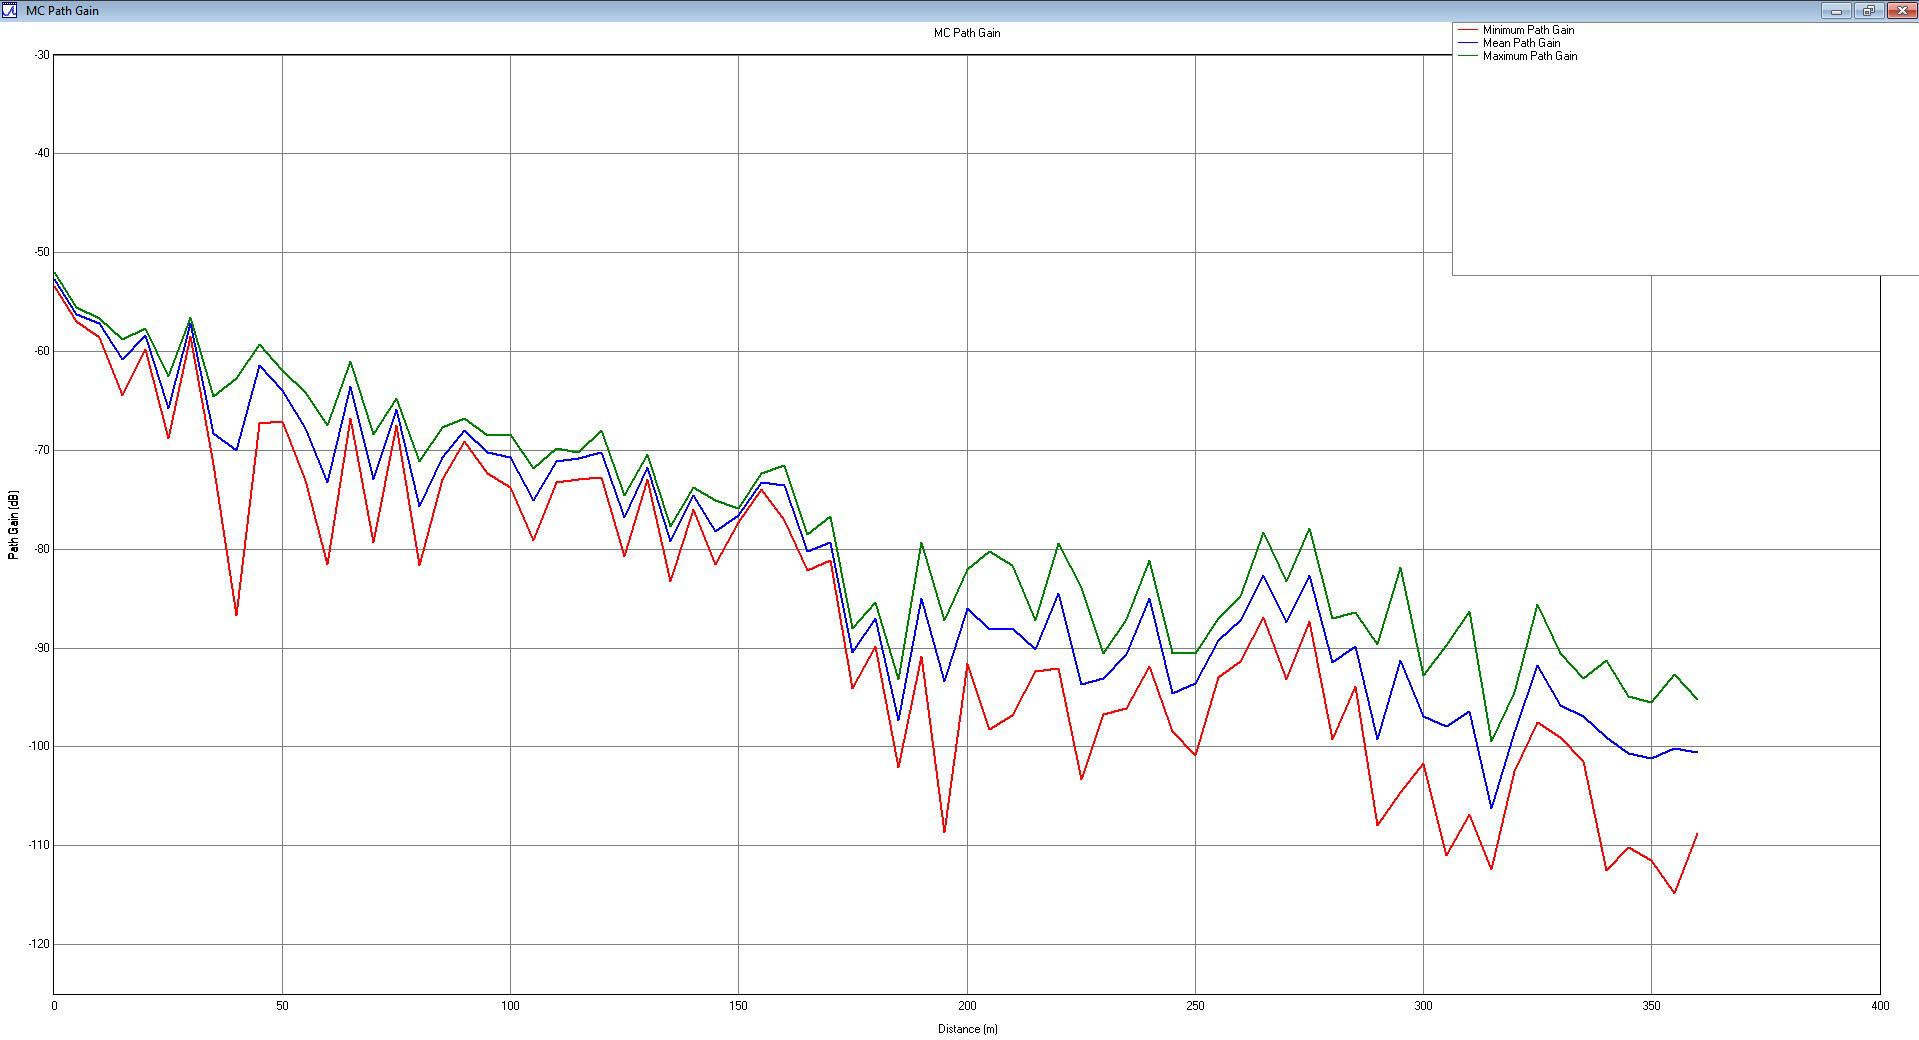
Figure 9: Minimum, mean, and maximum path gain as a result of Monte Carlo simulations.
Monte Carlo is a powerful tool within Wireless InSite that provides a user with an idea of the bounds of the result given some uncertainty in the simulation setup. It provides a quick, efficient way to do a sensitivity analysis on the output due to unknown parameters within the scenario. In this scenario, we demonstrated how the results changed as the material properties were varied. There was a change of 20 dBm in received power between the best and worst case scenarios at 70 m away from the transmitter due to the change in material type. This shows how the differences in material parameters can greatly impact the performance of a system and can help the user determine the best placement of transmitter and receiver sets once the uncertainty of the scenario is known. By using the Monte Carlo capability within Wireless InSite, this run was complete in a matter of minutes and all the results were calculated at once. Without this capability each of the material parameters combinations would have been run independently. Then the results from the individual simulations would have to be compared separately at the end. Overall the time to complete this entire study was nearly four times faster using the Monte Carlo multi-material then it would have been without this capability.