Video Shorts: "Using Wireless InSite MIMO to Visualize Beamforming"...
To demonstrate the concept of MIMO simulation assessment, Wireless InSite®’s MIMO capability has been used to set up a small cell scenario in a dense urban environment in Rosslyn, Virginia (Figure 1). The base station is positioned atop a post on a median at a major intersection at a height of 10 meters above street level. For the purpose of comparison, the base station has been defined with two alternative configurations: (1) a single dipole antenna, and (2) a large MIMO antenna. Both use a carrier frequency of 28 GHz.
The imported city model and the terrain contain a total of approximately 3,800 faces. The buildings and terrain are assigned concrete material properties with conductivity of 0.484 S/m and permittivity of 5.31. Figure 2 shows a close-up of the massive MIMO antenna, defined as an 8x8 cross-polarized dipole array. The gain pattern of the first element is displayed in the array view. A mobile device is defined to move along a route through the city and is shown approaching the base station location from the west, and then turning to move away from it to the north.
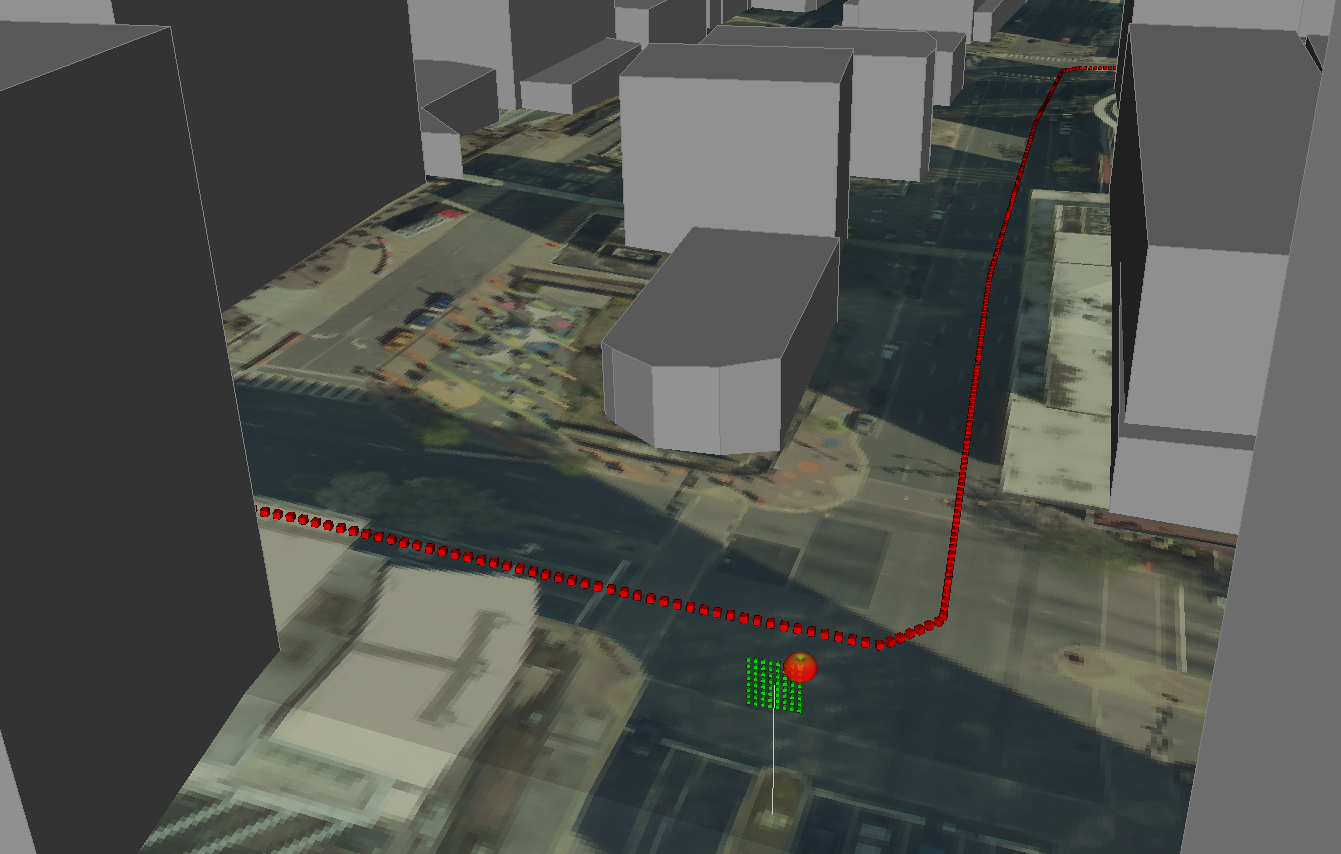
Figure 1: Rosslyn 3D building and terrain data are set up for SISO and MIMO analysis within Wireless InSte.
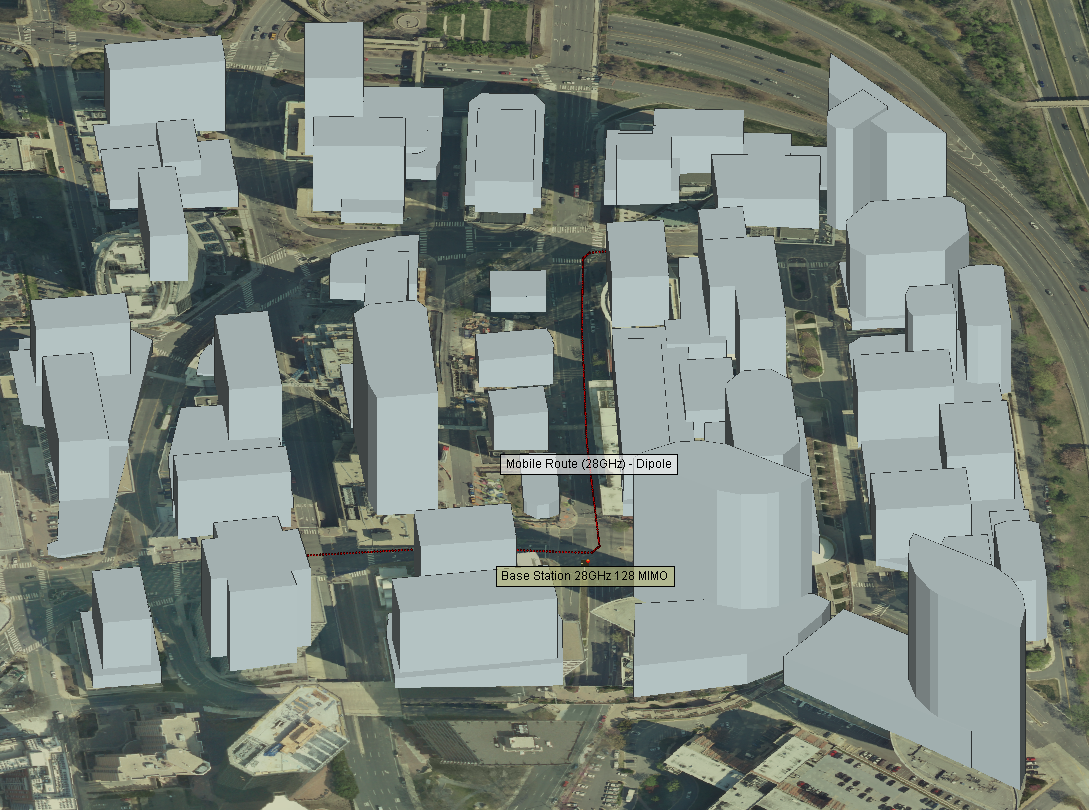
Figure 2: The 128-element Massive MIMO array is located on a Tx point several feet above the ground with a moving Rx set in the downtown area.
Wireless InSite MIMO contains an array builder which allows users to design an n-element sized MIMO array. This tool also gives users control over individual elements of the array such as positioning, antenna pattern, and rotation. Figure 3 shows the 128-element array within the array builder. For simplicity, this array has been built with dipole antennas, placed at half-wavelength spacing, and arranged with both vertically-polarized and horizontally-polarized elements placed at each of the 64 positions shown. However, it should be noted that the software can handle many different types of analytical patterns and can also utilize imported patterns generated by high-fidelity array simulations from a full-wave solver, such as Remcom’s XFdtd®.
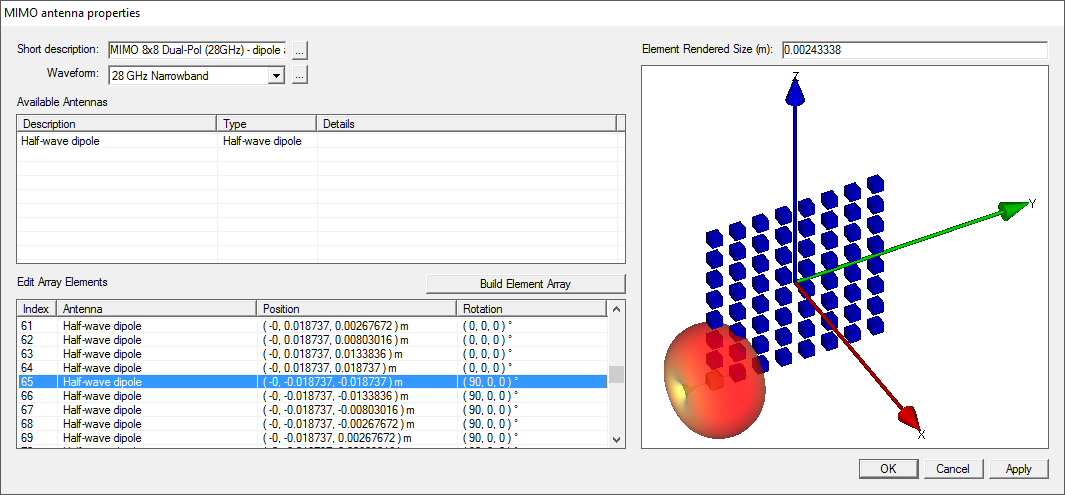
Figure 3: The 128-element Massive MIMO array was built in Wireless InSite’s powerful array builder.
Wireless InSite’s study area properties allows users to configure and control various aspects of the physics and ray-tracing calculations. Figure 4 shows the study area setup dialogue for the massive MIMO simulation. The study area is defined to use Wireless InSite’s GPU-accelerated X3D ray model, with ray-tracing defined to include propagation paths with up to six reflections and one diffraction, omitting transmissions to limit calculations to the outdoors.
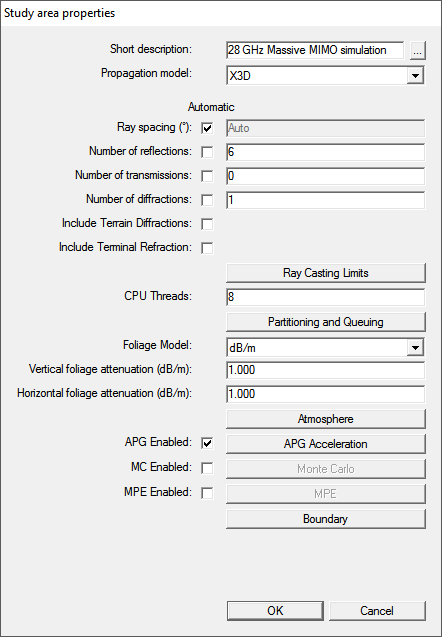
Figure 4: The Study Area Properties window gives the user control over which propagation model to run and the number of interactions
Simulations using the single antenna and the MIMO antenna are then performed. Wireless InSite provides user-requested outputs such as received power, propagation paths, time of arrival/departure, etc. A typical result from the analysis of a single transmitting antenna is the power received by a mobile device, either in the form of a coverage map over an area or displayed as a function of distance along a route. Figure 5 provides a field map showing the coverage in the vicinity of the base station. Figure 6 shows a plot of the power received by the mobile device along its route (shown in red in views of the scene). As shown in the second figure, the power increases along the route as the mobile device approaches the base station and falls off as it moves away, dropping dramatically when it turns the corner and goes out of line-of-sight. Rapid fading in the received power along the route is due to multipath interactions (reflections and diffractions) with buildings.
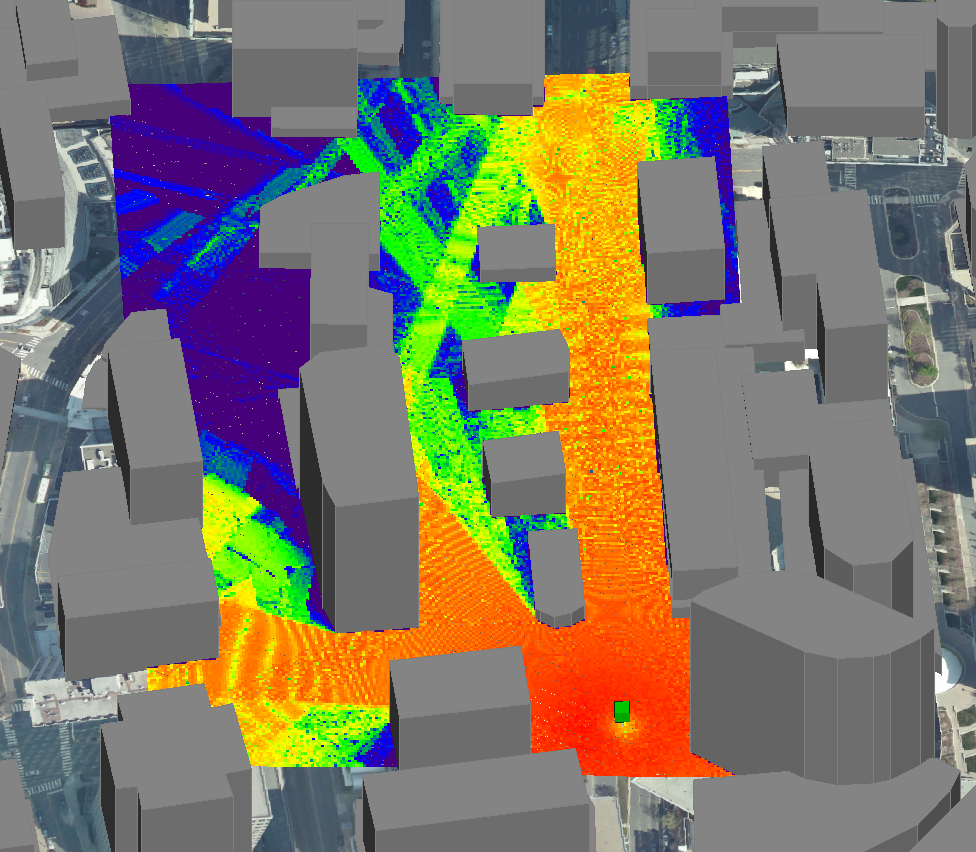
Figure 5: Field map showing the coverage over an area of the scene.
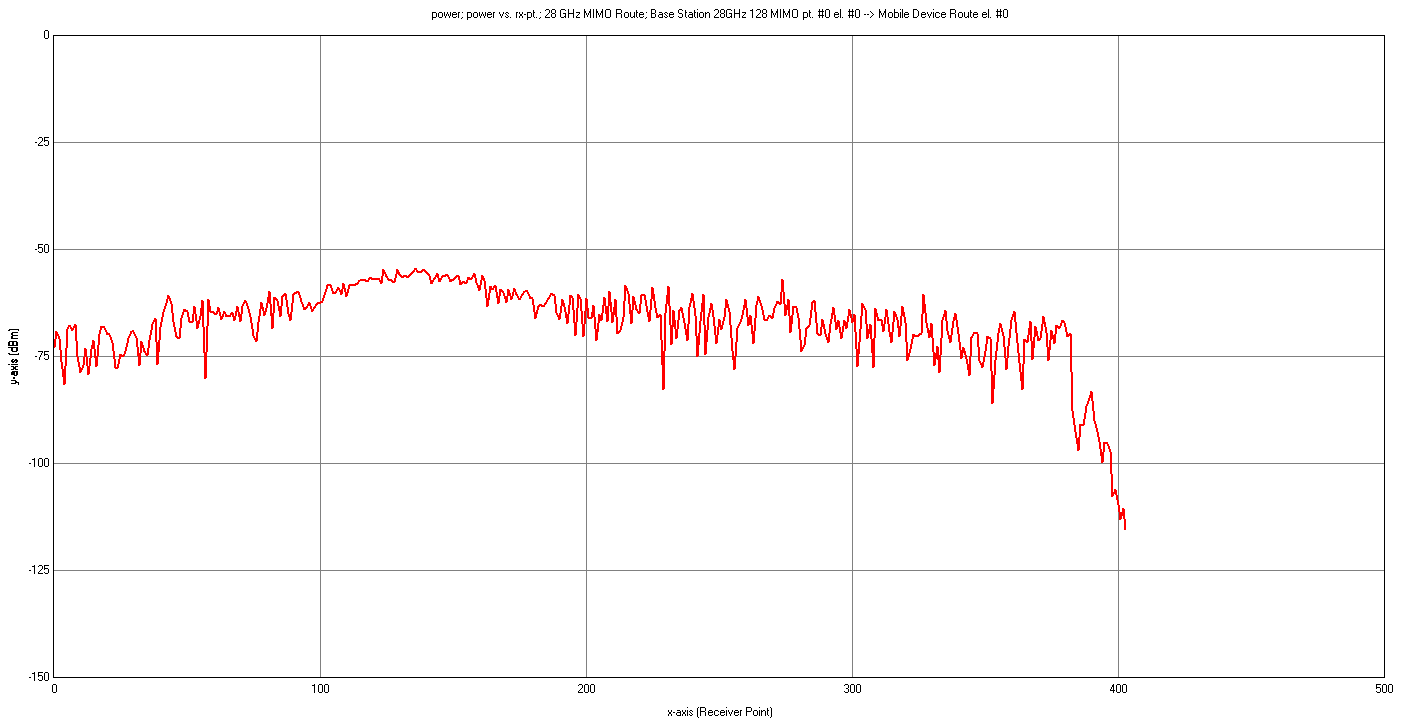
Figure 6: Power received by mobile device along route from base station with single antenna
Another output that is relevant for both single antennas and MIMO systems is the complex impulse response, which is a measure of multipath. The complex impulse response measures the power of arriving multipath signals as a function of either their time of arrival or phase. Figure 7 shows the top 25 propagation paths between the base station and mobile device at a point approximately 240 meters along its route. The complex impulse response at this location for the single antenna base station is shown in Figure 8.
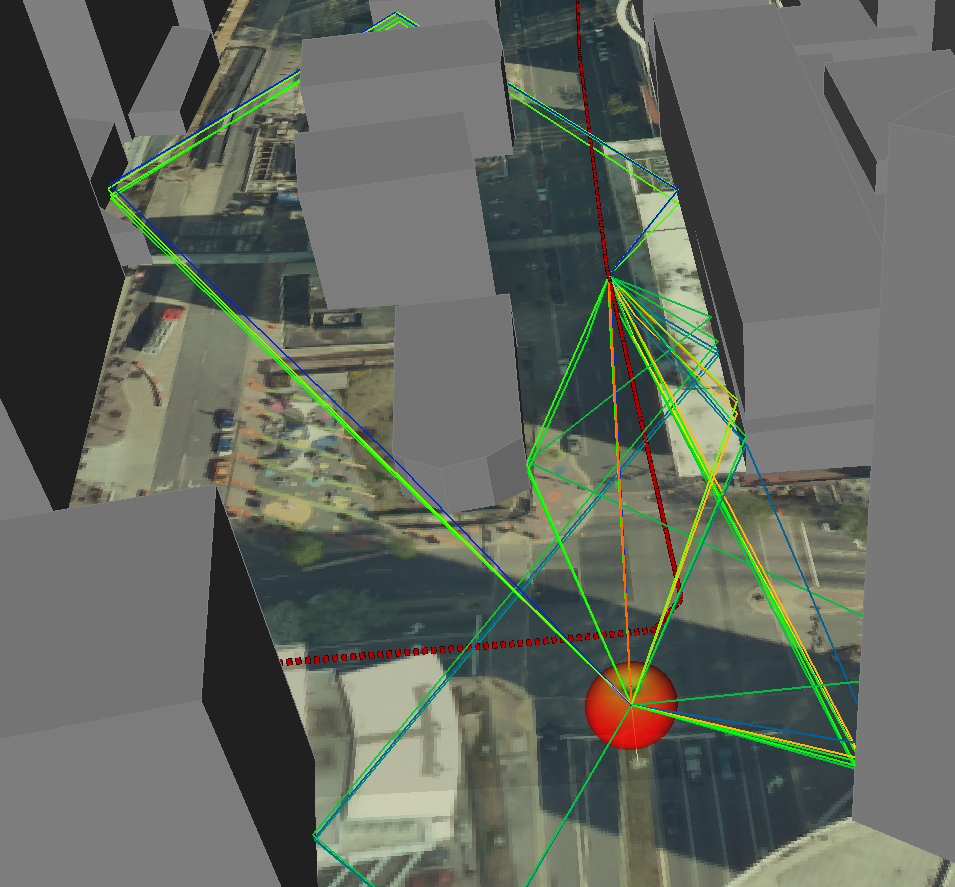
Figure 7: Top 25 propagation paths from base station to mobile device at one point along its route.
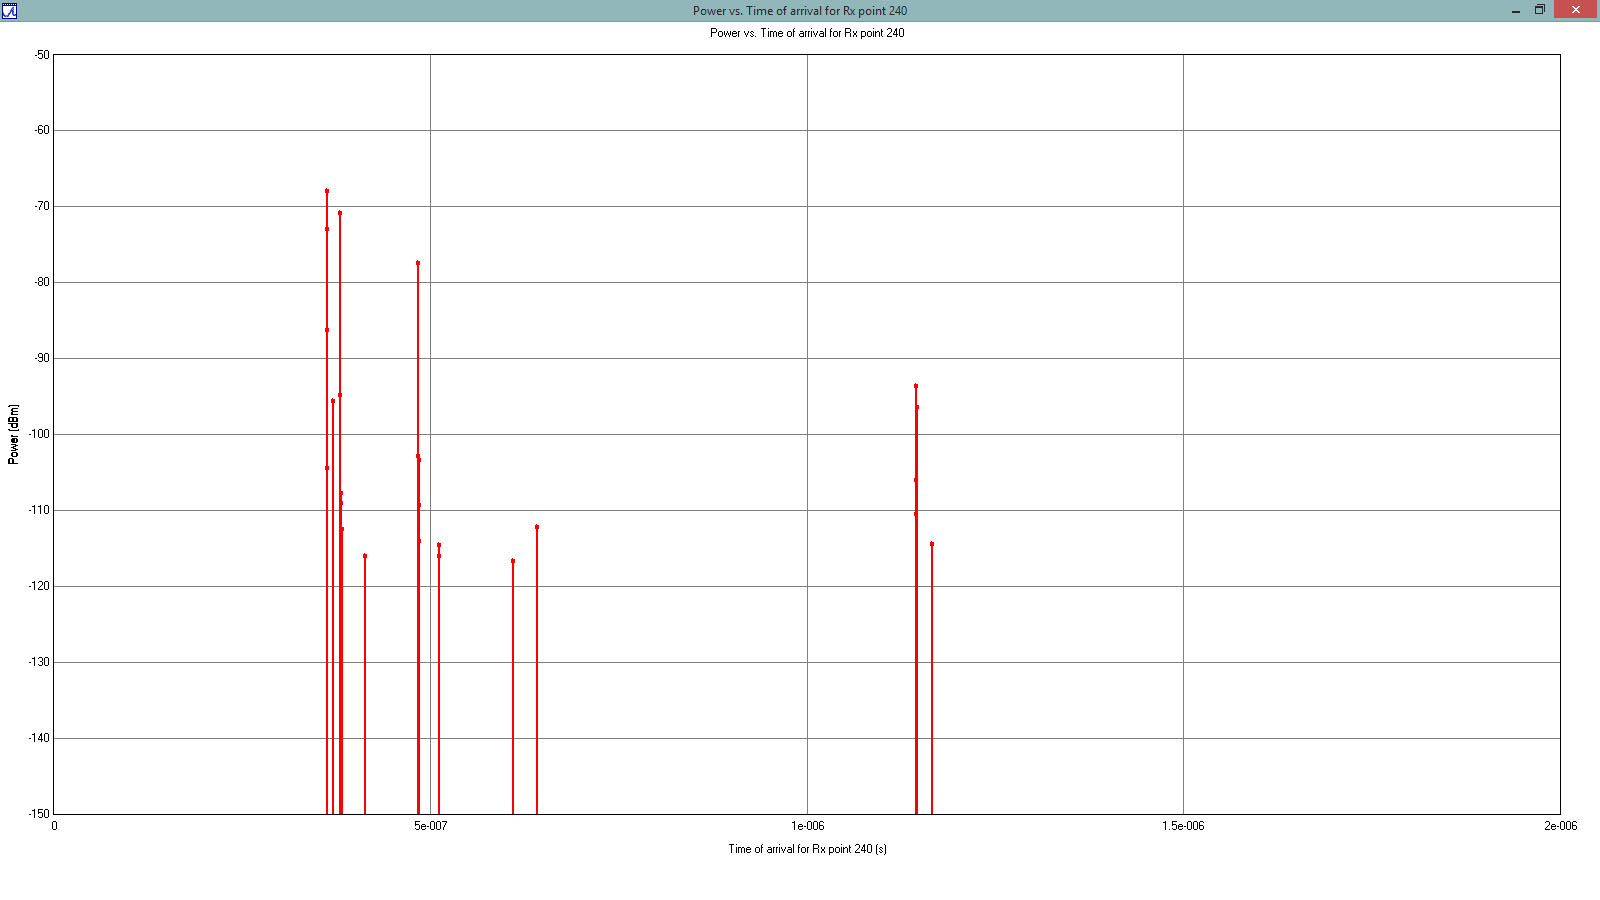
Figure 8: Complex Impulse Response for mobile device at position shown above.
Wireless InSite MIMO allows users to write out H-matrix, Complex Impulse Response, and Delay Spread using a channel data results browser shown in Figure 9. The image shows settings for plotting received power as a function of receiver number for the Rosslyn MIMO scenario for all combinations of transmitting and receiving antenna elements in the MIMO system. Figure 10 shows the received power at the mobile device along its route, overlaying results for all transmitter elements.
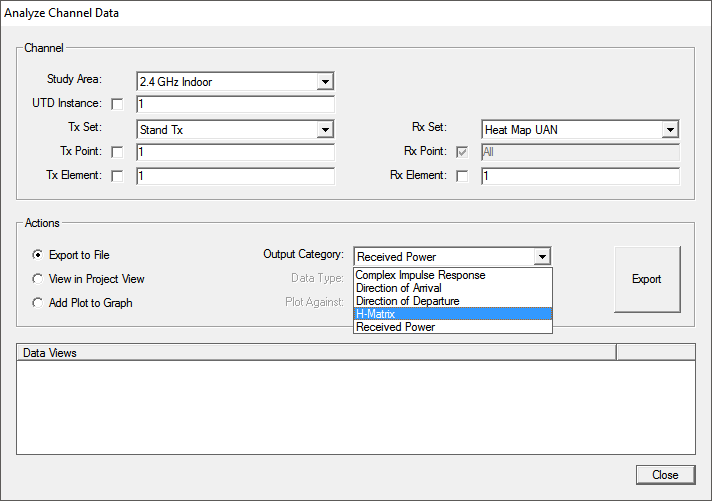
Figure 9: The “Analyze Channel Data” results browser was created for the Wireless InSite MIMO module. This browser allows users to output H-matrix, Complex Impulse Response, Delay Spread and Received Power.
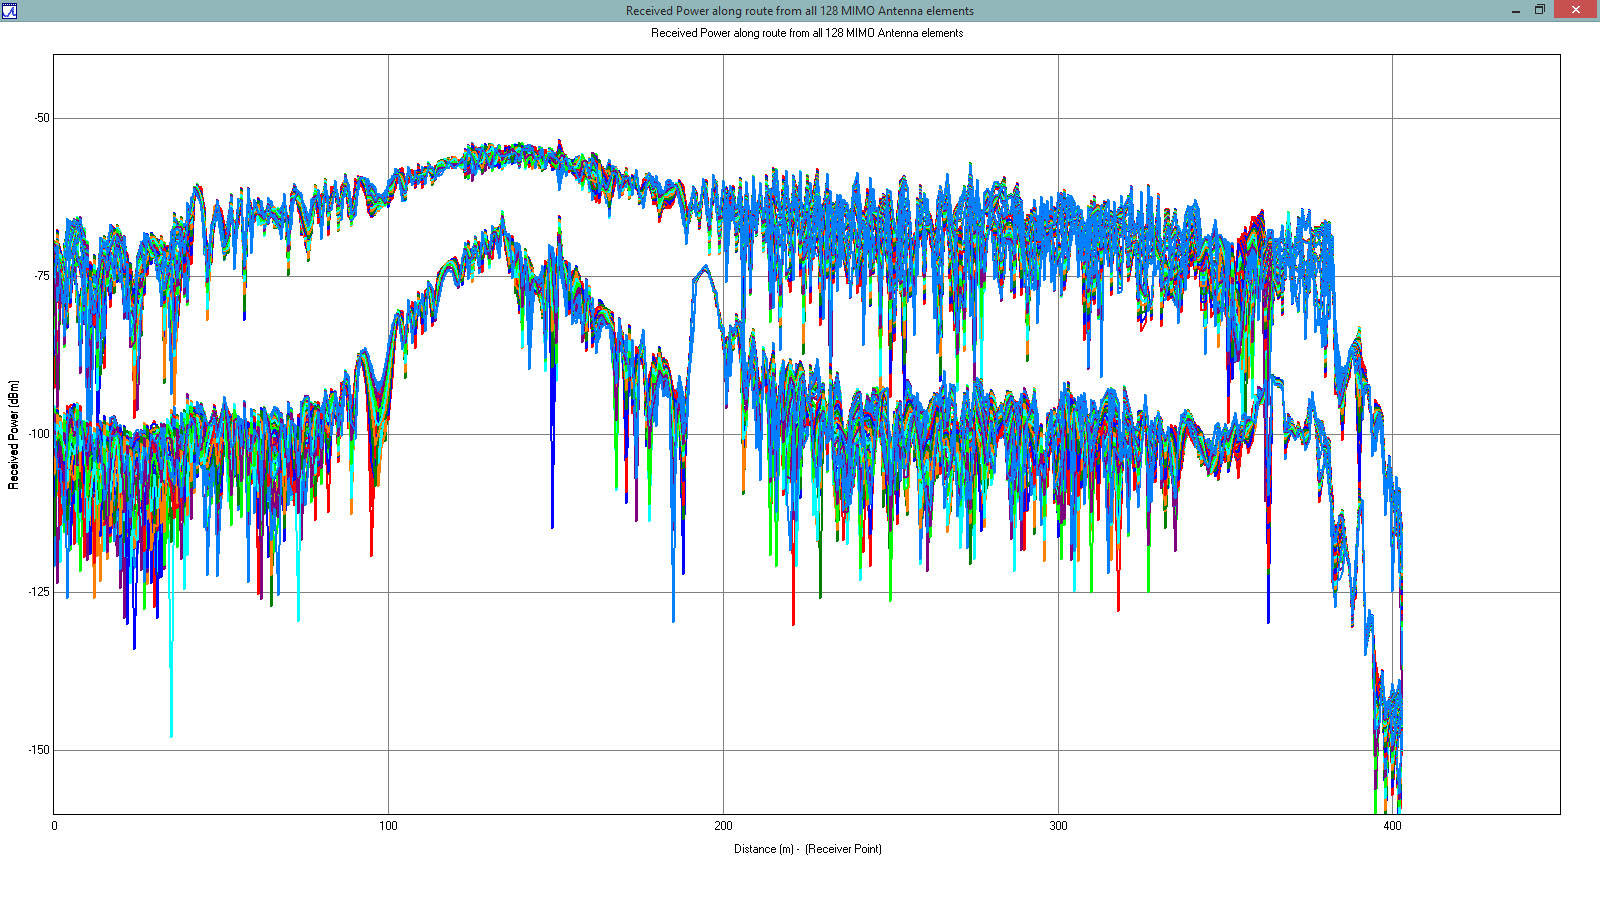
Figure 10: Power received by mobile device along route from all 128 transmitting elements of MIMO base station.
One of the key output results from a MIMO simulation is the complex channel matrix, or H-matrix. The H-matrix encodes the multipath propagation characteristics from every transmitter element to every receiver element and is commonly used in beamforming, channel capacity, and other MIMO system-level analyses. Wireless InSite’s channel data results browser allows a user to export the H-matrix to a .csv file, where additional post-processing analysis can determine how channel multipath may impact the performance of the MIMO system.
See more 5G Mimo Simulation Examples


