Introduction
A dual-band antenna at terahertz frequencies could be useful for communication and radar applications but is often difficult to fabricate using traditional techniques. Here a design discussed in [1] is evaluated with XFdtd EM Simulation Software which uses a conical horn to radiate a lower frequency band at 94 GHz and a tapered dielectric strip to carry the higher band of 340 GHz. The antenna produces equal beamwidth patterns in the E and H planes with gain around 18 dBi for both frequencies in this antenna simulation.
Device Design and Simulation
The feed end of the antenna consists of two rectangular waveguide ports that are orthogonally-aligned with the lower frequency port on the side of the structure and the higher frequency port in line with the center axis of the horn. A tapered dielectric strip of quartz runs the length of the device and partially fills the waveguide feed at 340 GHz. The fields at the higher frequency are then guided by the strip while the lower frequency port at 94 GHz feeds into a rectangular to circular waveguide transition region and then into the conical horn. The device is shown in Figure 1 in three dimensions with the tapered quartz strip shown in a red color and the 94 GHz port visible on the +X side of the horn. Views of the horn from the top (+Y) direction and front (+Z) direction are shown in Figure 2 and Figure 3, where the tapered strip can be seen to partially fill the waveguide in the X direction.
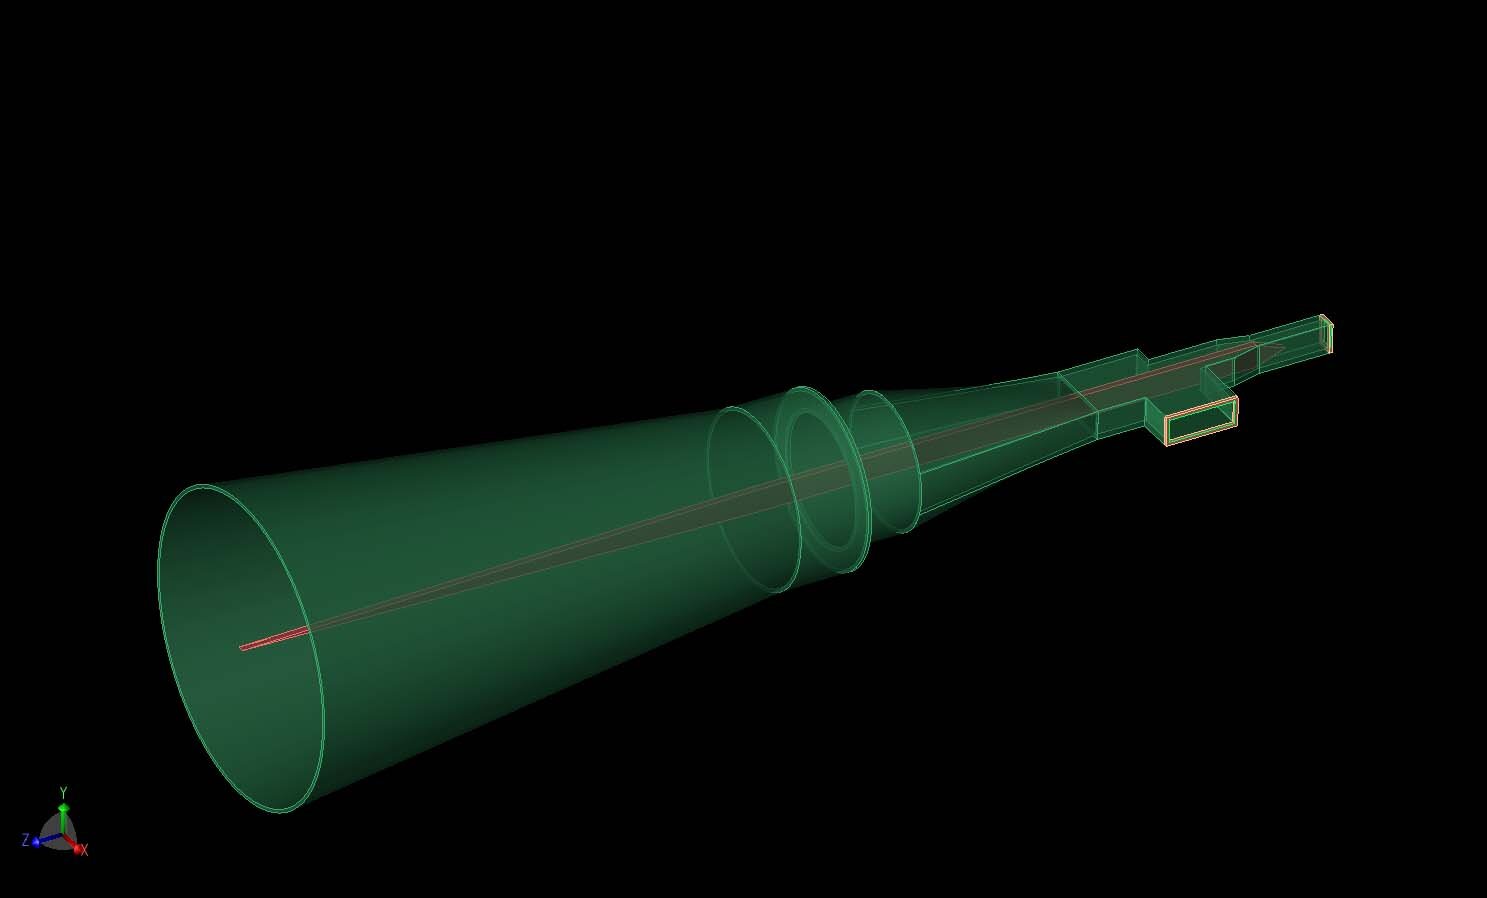
Figure 1: A three-dimensional CAD view of the antenna shows the two input ports to the right and the tapered quartz strip running down the center of the horn structure.
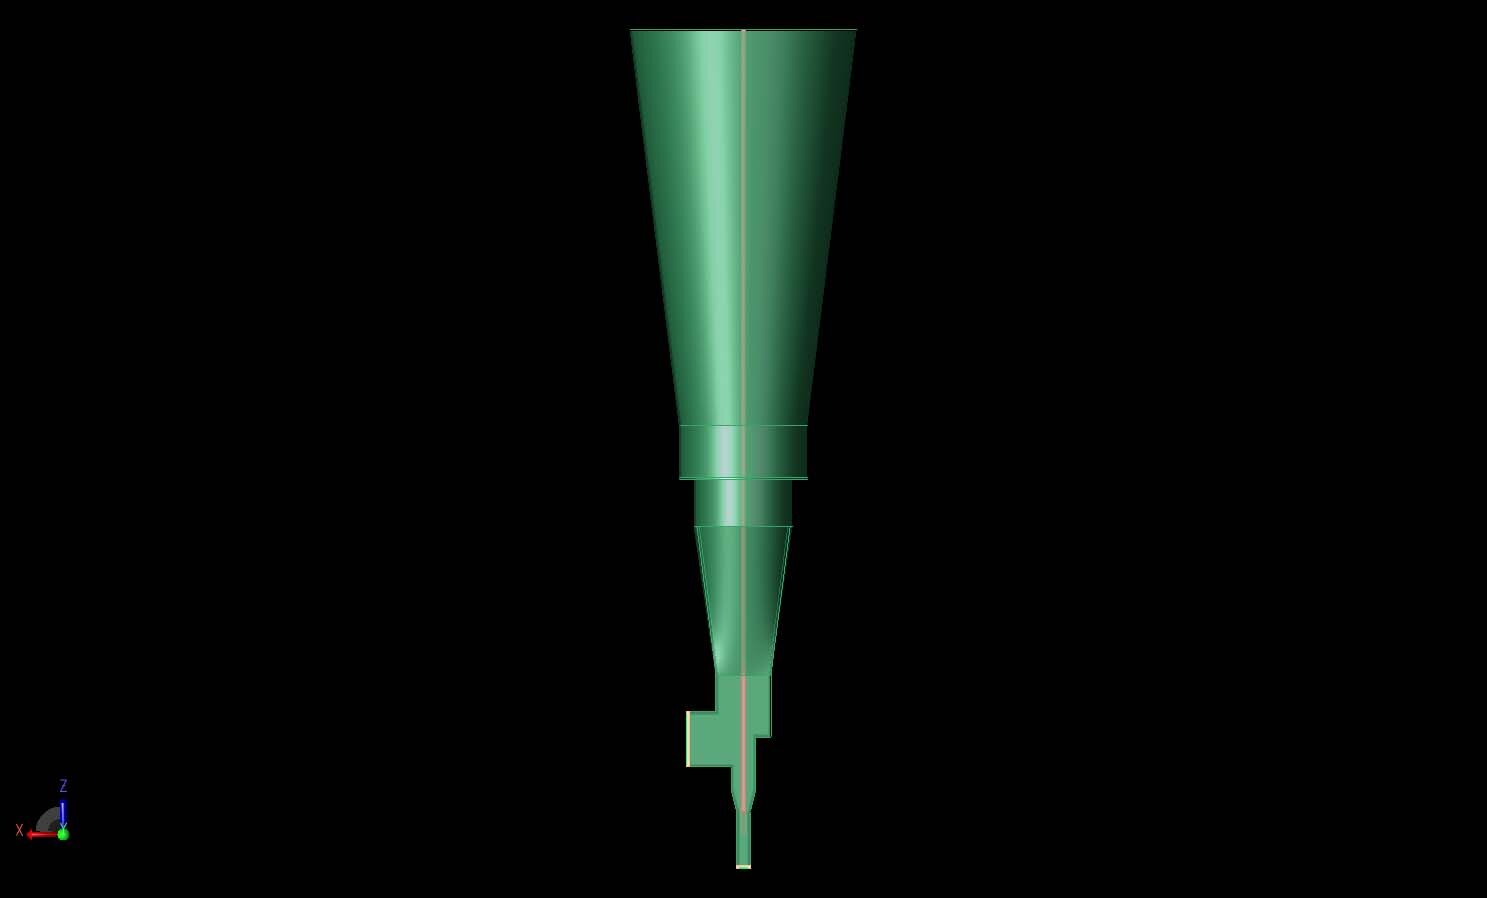
Figure 2: A top view of the antenna shows the orientation of the two input ports and the overall shape of the transition regions and horn.
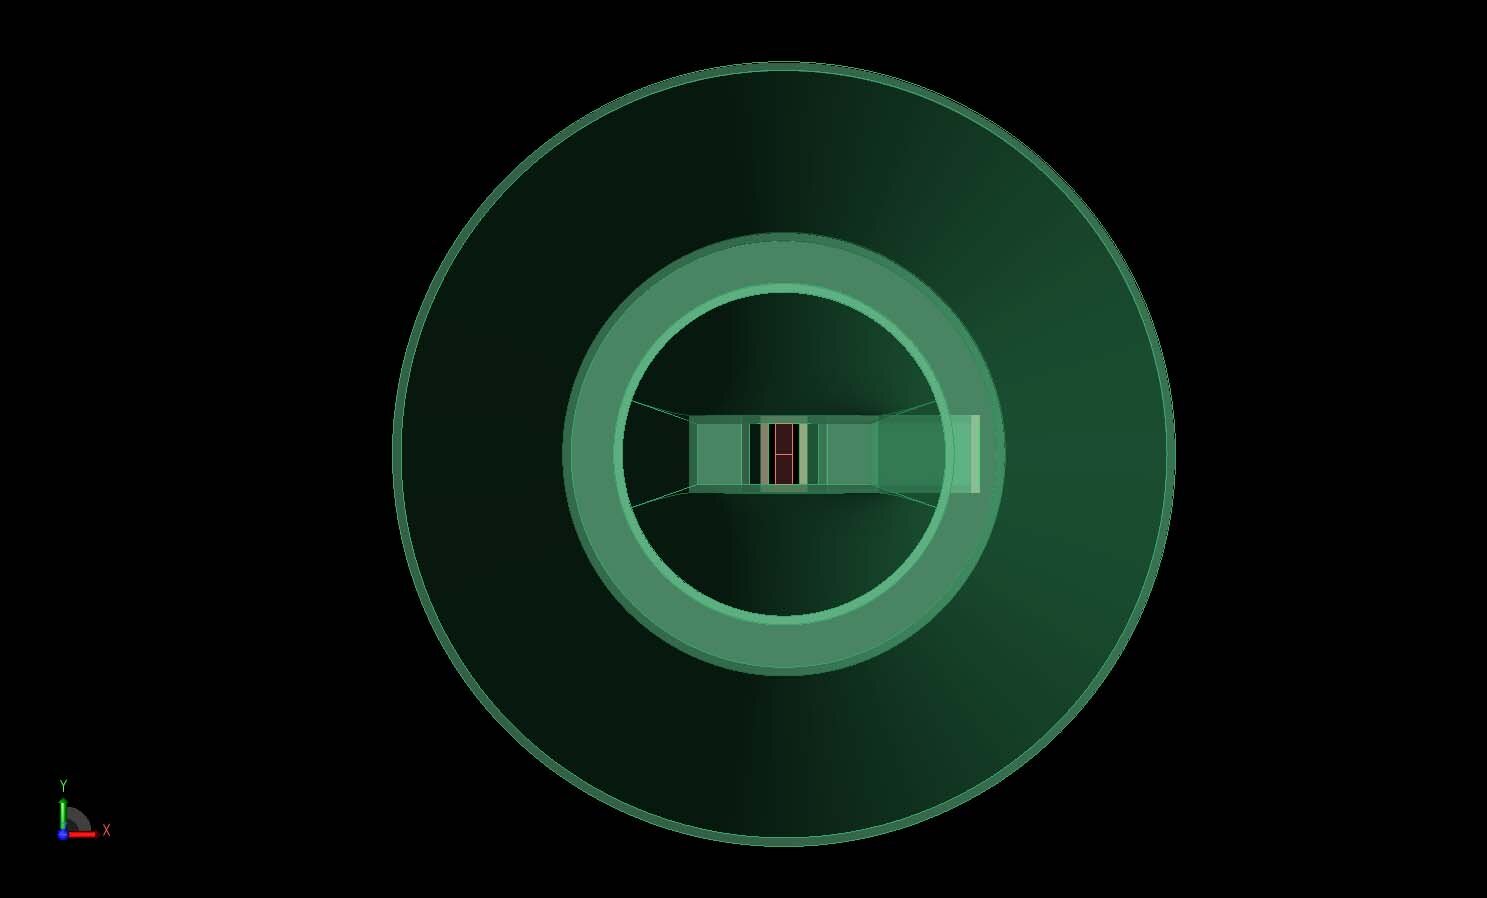
Figure 3: A view down the horn opening shows the tapered dielectric strip partially filling the center of the high frequency waveguide.
The two ports are excited by broadband modal waveguide sources to generate the S-parameter results. In Figure 4, the return loss for the lower band port is shown and can be seen to be below -15 dB at 94 GHz. Figure 5 shows the return loss for the upper band port which is nearly -20 dB at 340 GHz. The coupling between the ports is extremely low and generally below -70 dB.
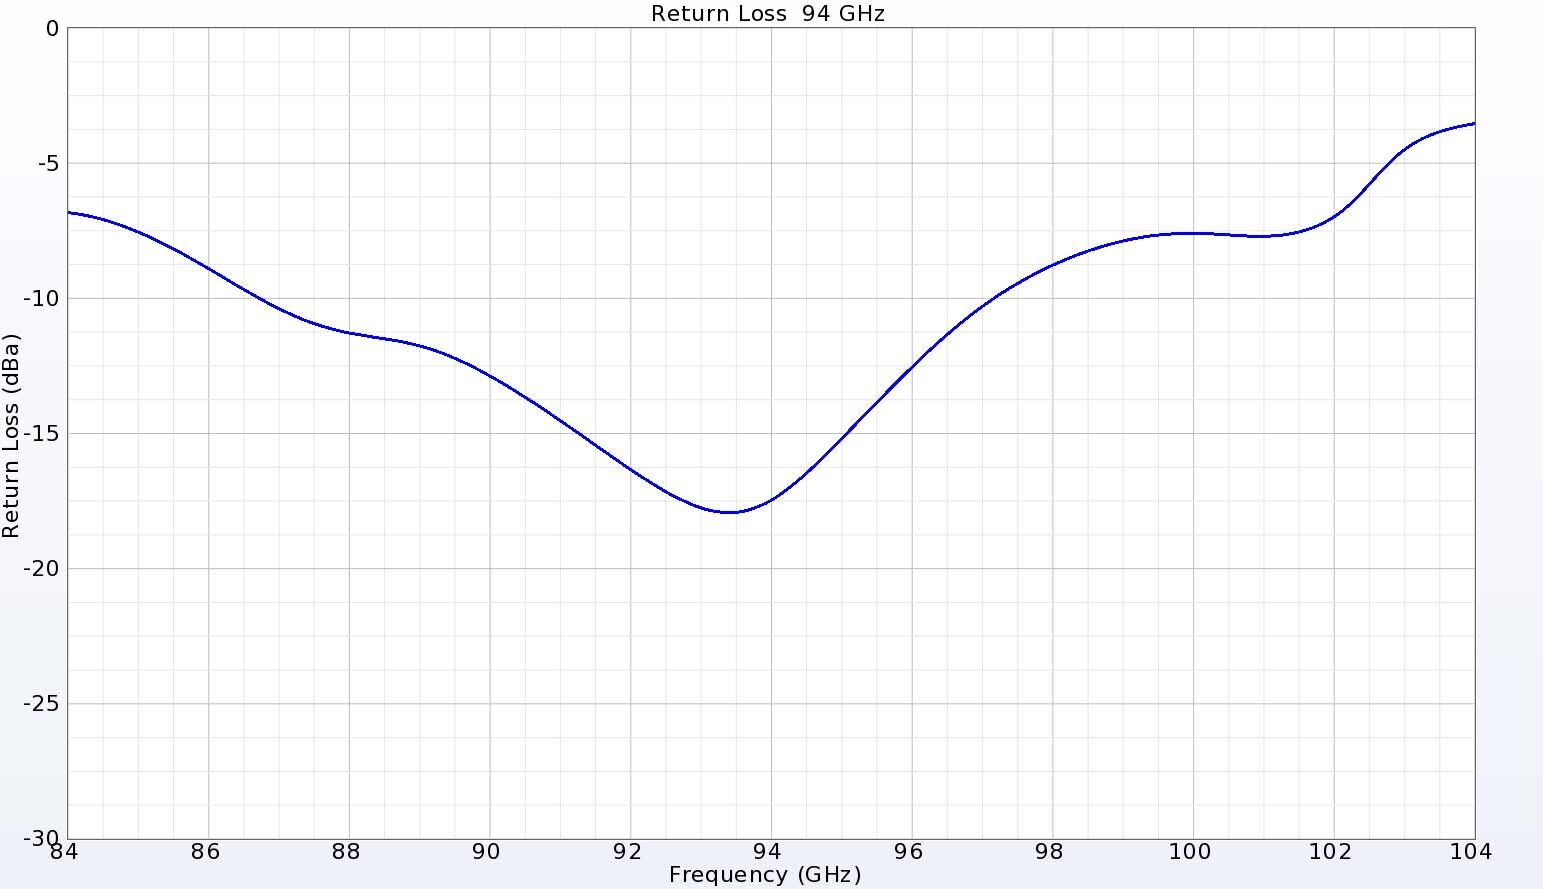
Figure 4: The return loss for the 94 GHz port shows a good match with values below -15 dB.
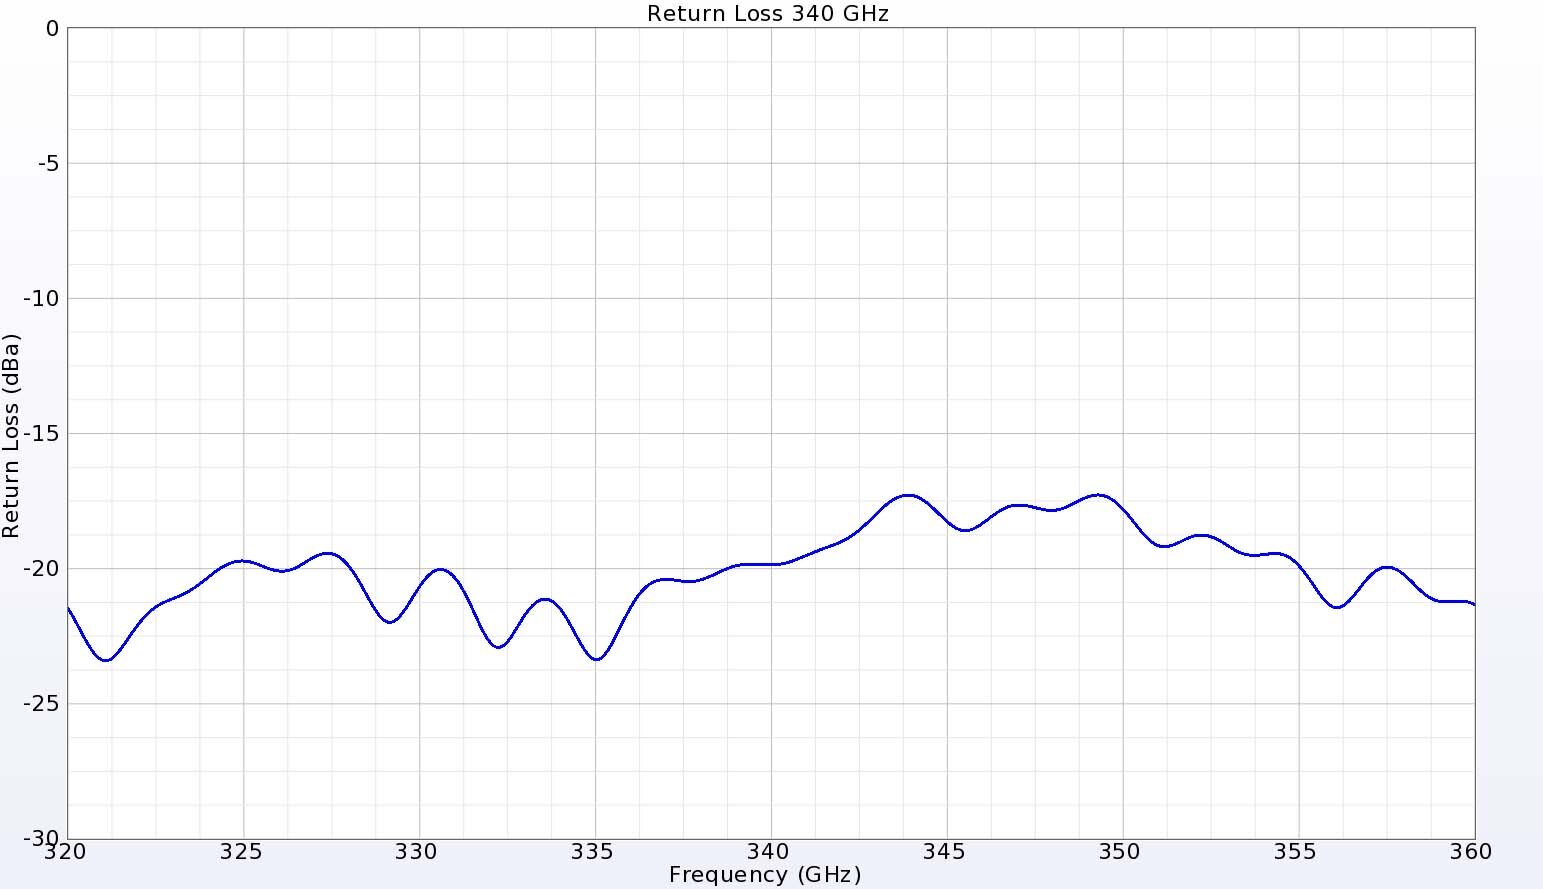
Figure 5: At 340 GHz, the return loss is nearly -20 dB for the high band port.
The propagation of the 94 GHz fields as a function of time is shown in Figure 6, where the transition from rectangular to circular waveguide may be seen followed by the radiation from the horn. The steady-state field distribution in Figure 7 shows smooth field transitions across the horn. The higher frequency excitation through the orthogonally-connected second port shows in Figure 8 how the dielectric strip guides the time varying waves out of the antenna. The steady-state field distribution at 340 GHz shows tight containment of the fields around the strip, as seen in Figure 9.
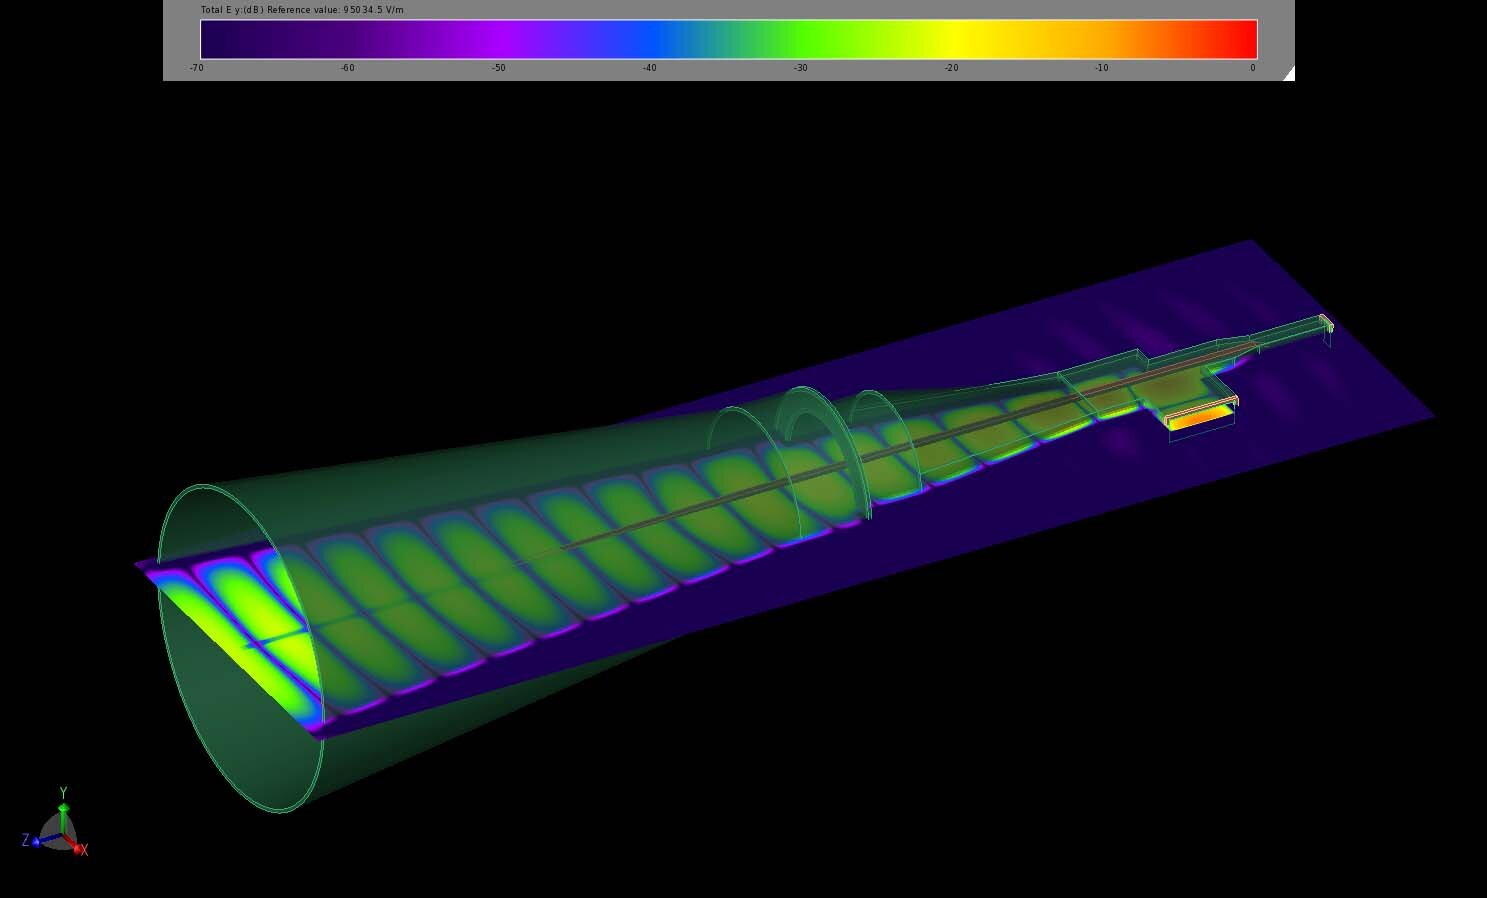
Figure 6: Time domain electric fields from the 94 GHz port show the propagation through the transition region and out of the horn of the antenna.
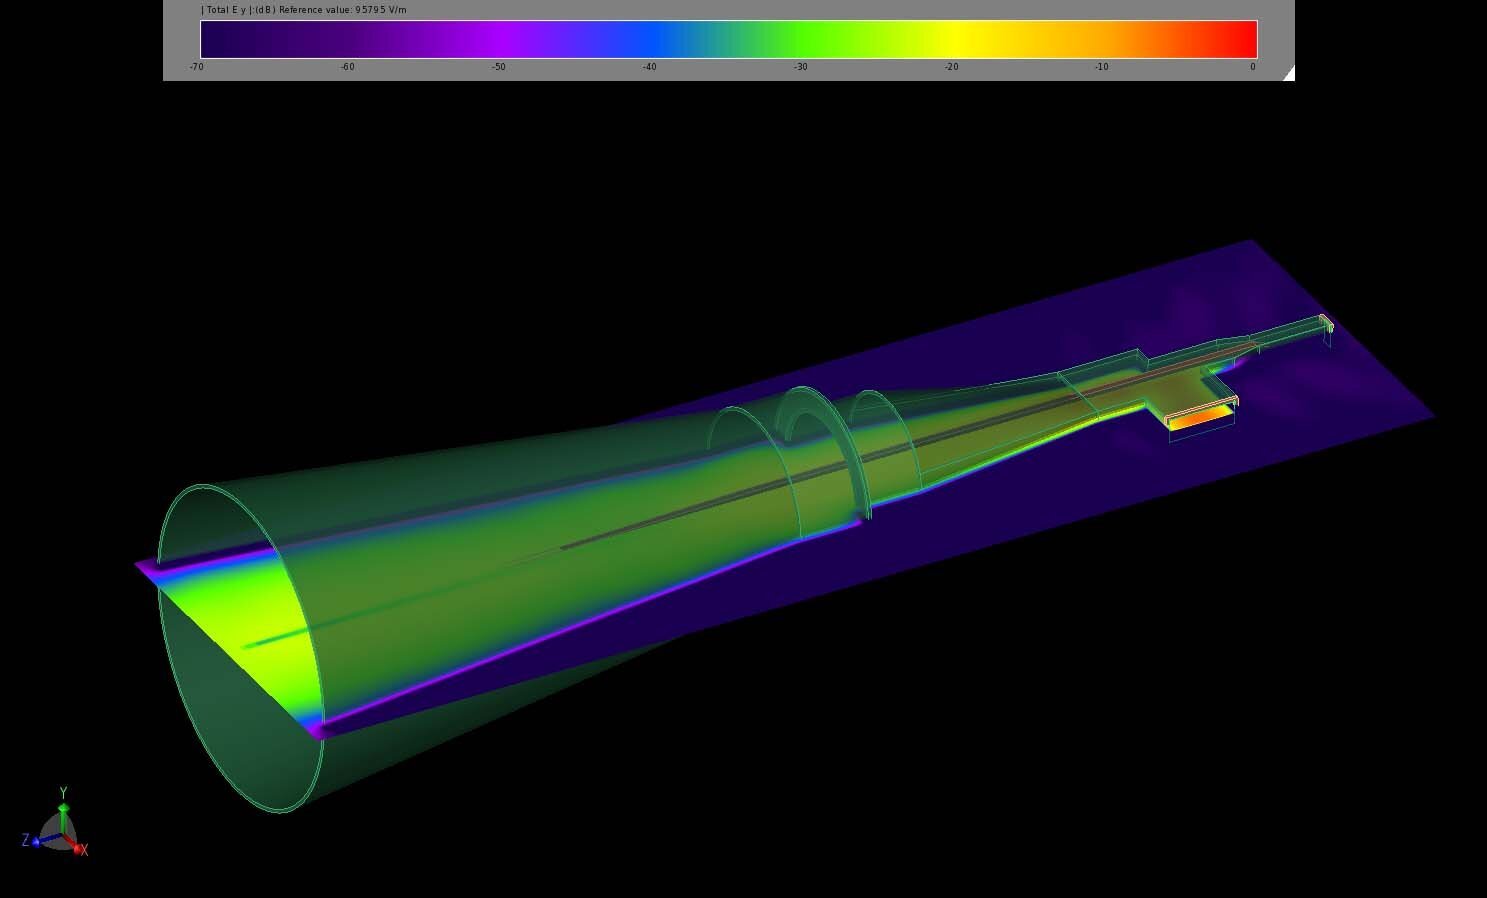
Figure 7: Steady-state electric fields at 94 GHz show field distributions throughout the cross section of the horn.
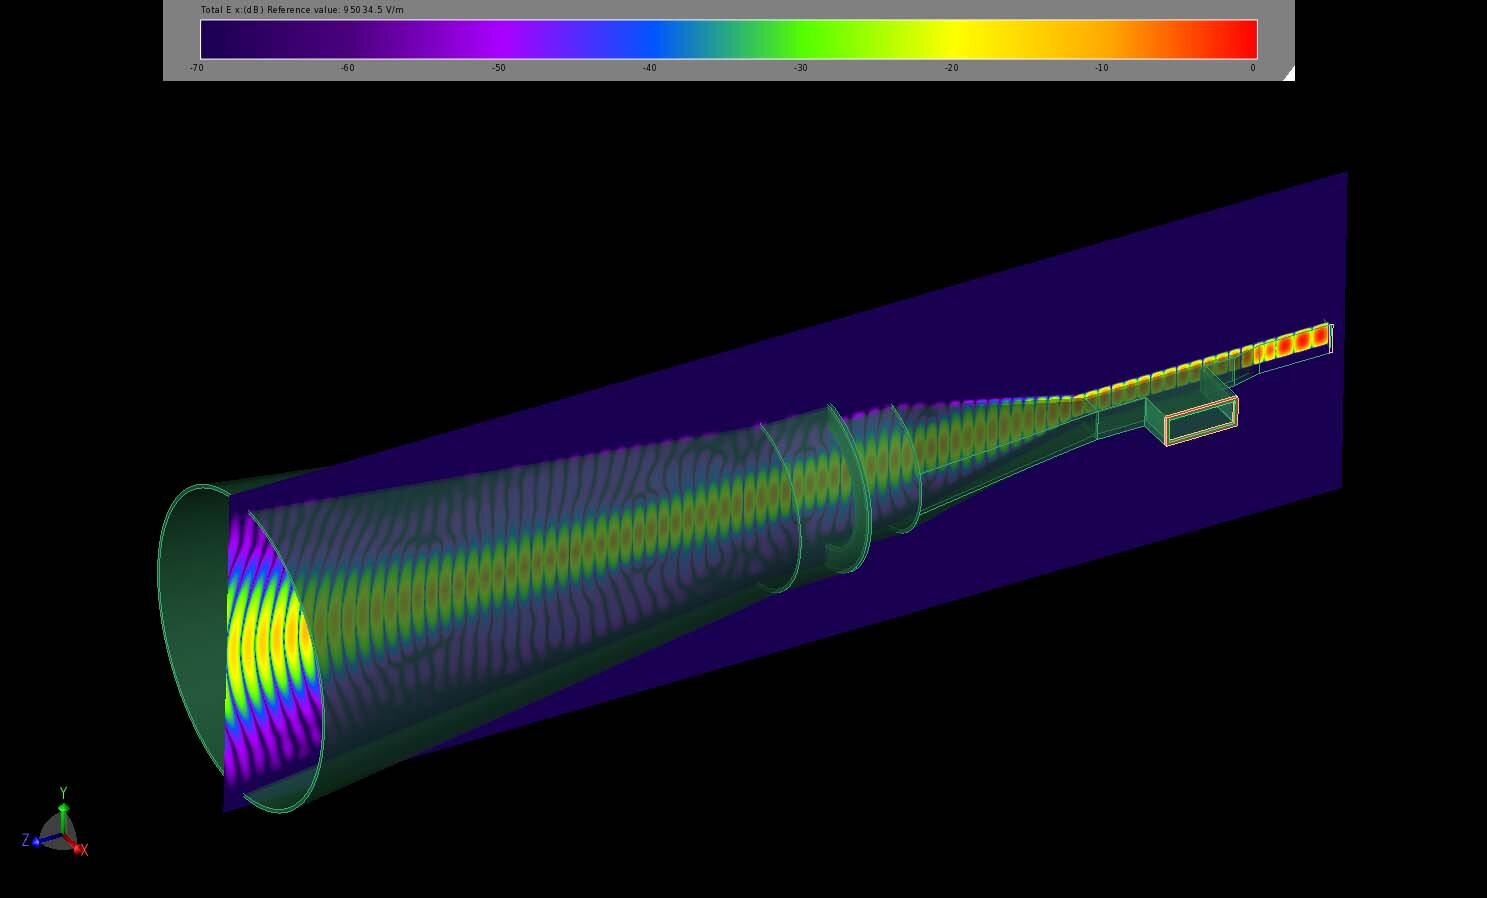
Figure 8: At 340 GHz, the time domain electric fields are more tightly bound to the tapered dielectric strip in the center of the horn.
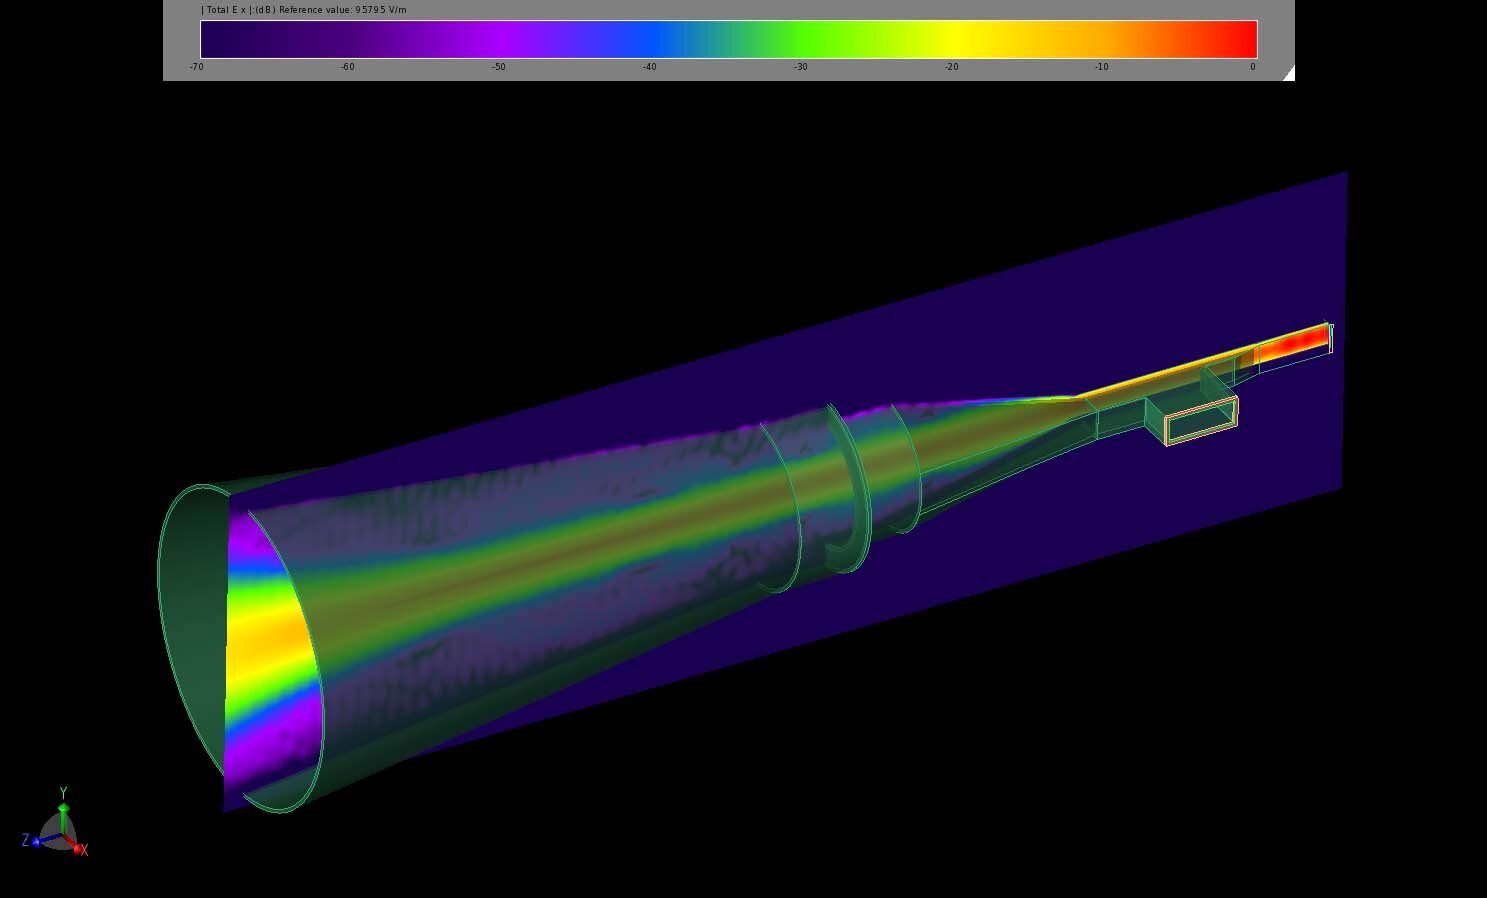
Figure 9: The steady-state electric field distribution at 340 GHz highlights the stronger fields in the dielectric.
The radiation patterns of the two bands are shown in Figure 10 and Figure 11, where both frequencies have similar beam patterns and gain with low side lobes. In Figure 12, the gain patterns in the E and H planes are shown for the 94 GHz radiation and the cross-polarization levels are very low while the main beam is symmetrical. At 340 GHz, the patterns in the E and H planes have higher cross-polarization but still nearly symmetrical main beams and low side lobes as shown in Figure 13. The radiation and system efficiencies for both frequencies are over 95% as there is little loss in this antenna design.
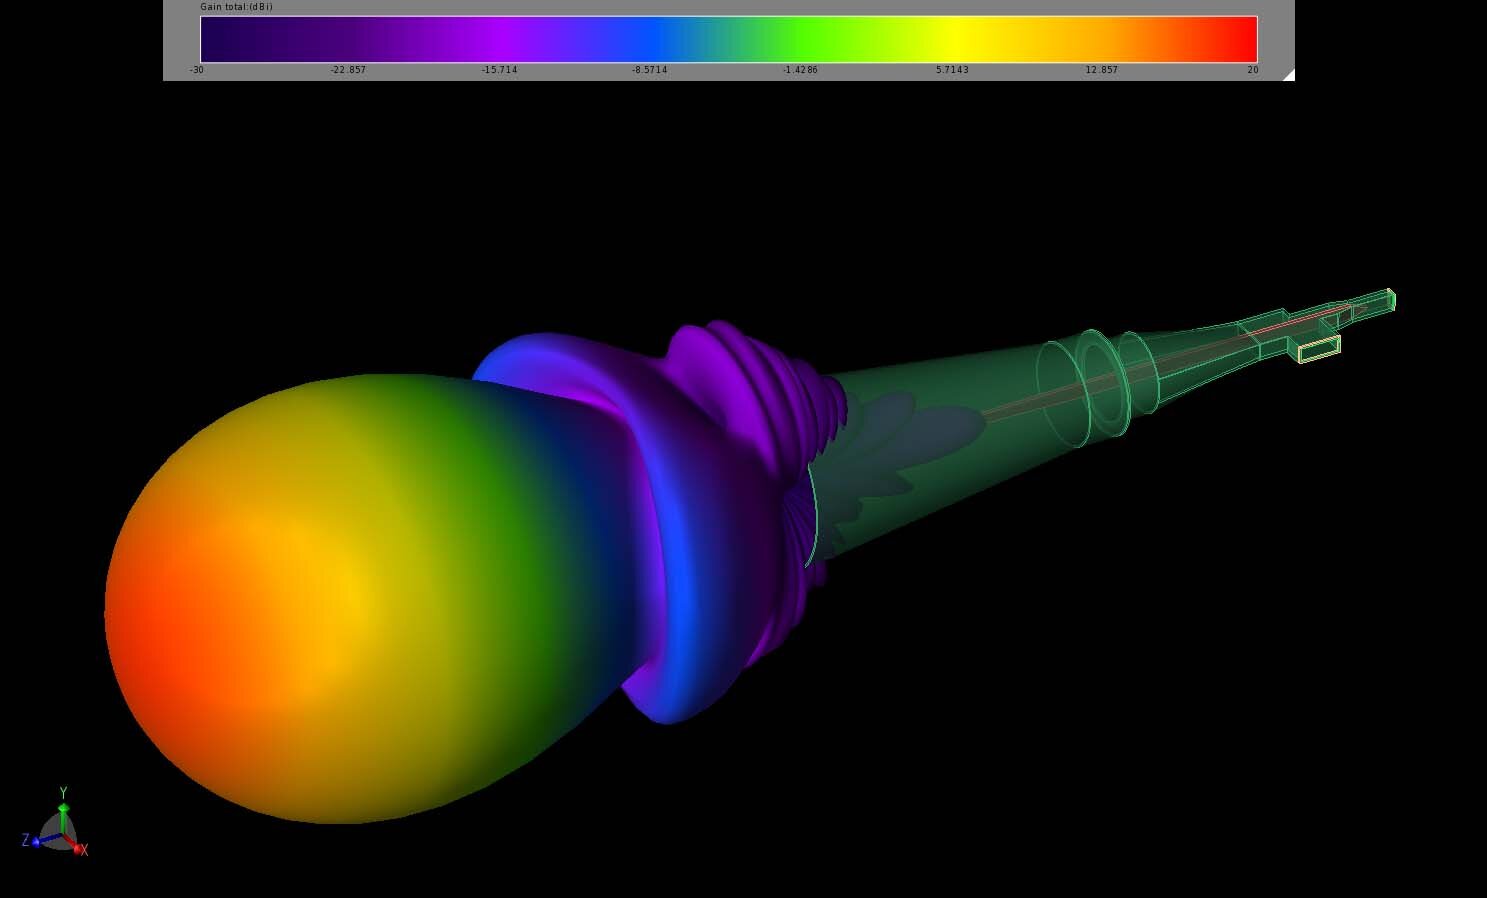
Figure 10: The gain pattern of the horn at 94 GHz has a symmetrical beam with peak gain at 18 dBi and low side lobes.
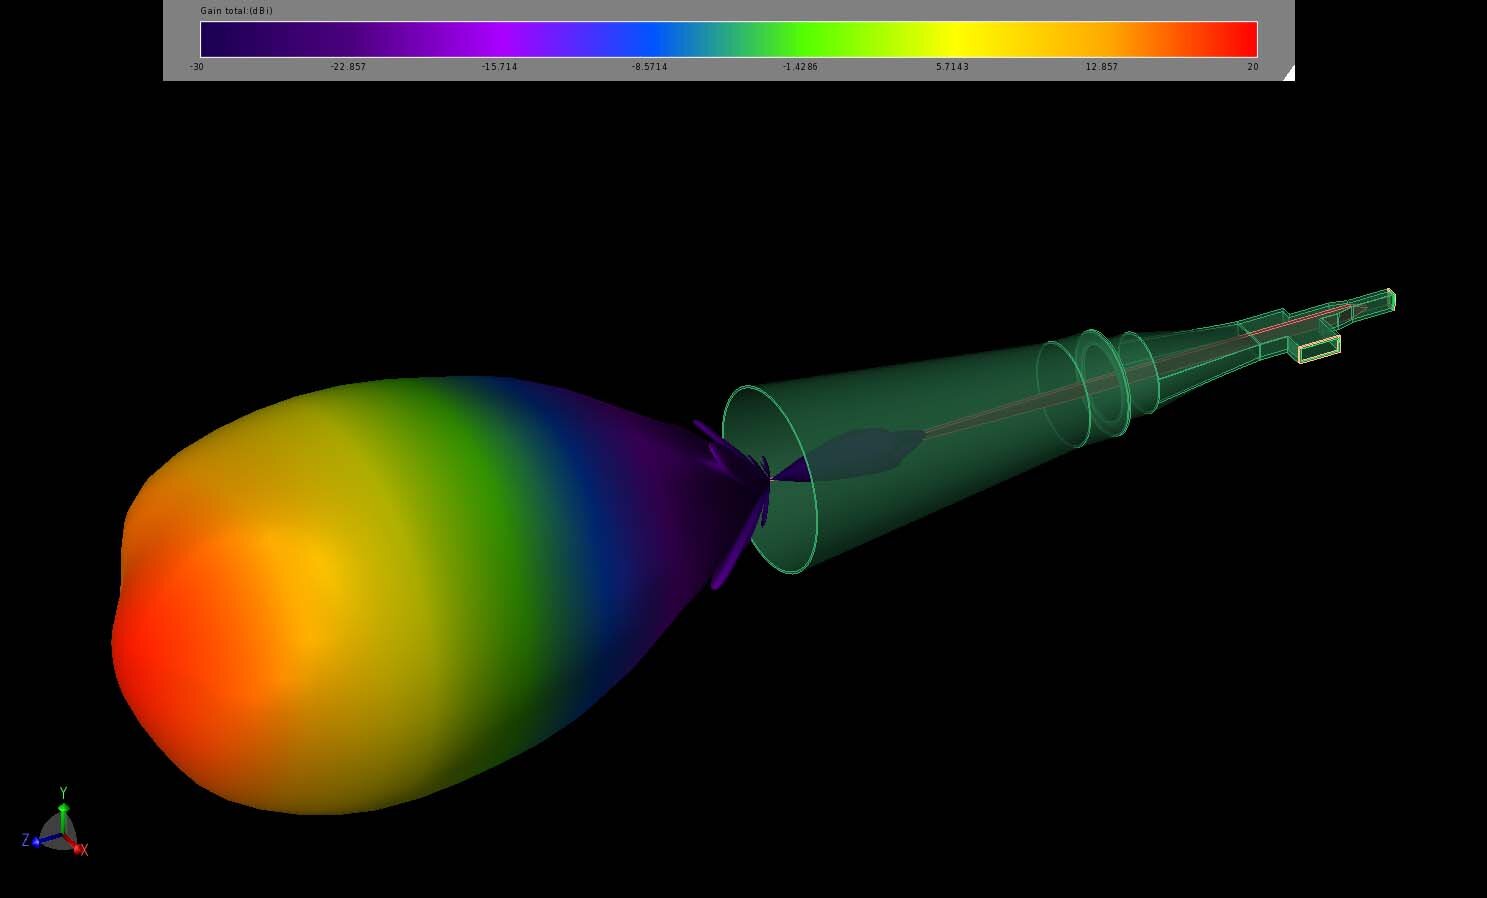
Figure 11: At 340 GHz the gain pattern has a nearly-symmetrical beam with a slightly higher peak gain of nearly 19 dBi. The sidelobes are down nearly 40 dB from the peak.
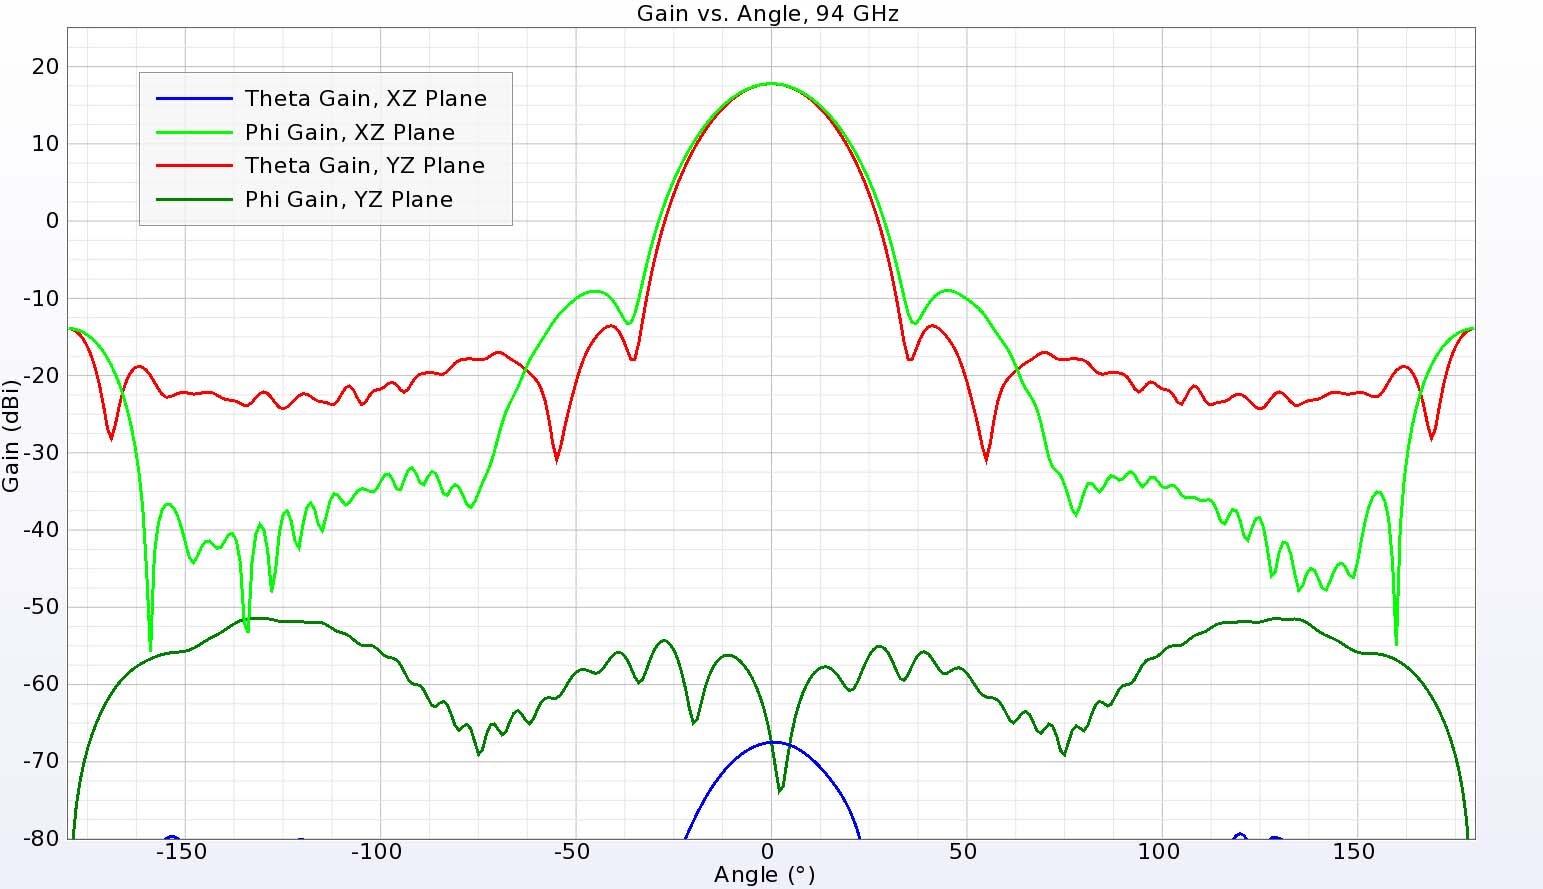
Figure 12: The gain in the two principal planes at 94 GHz shows a strong, symmetrical beam and very low cross polarized fields.
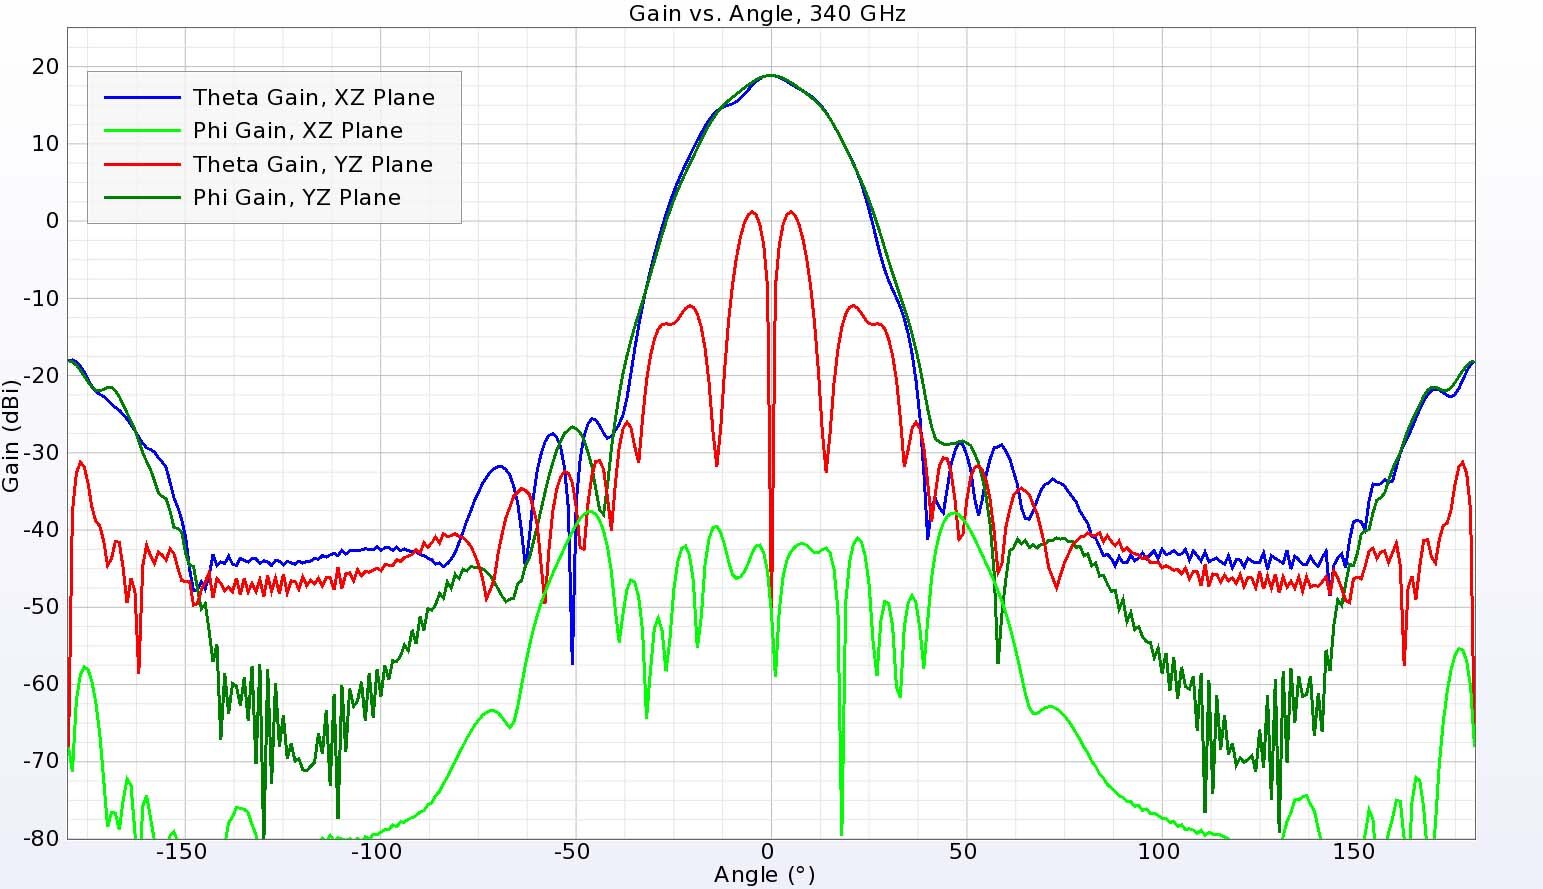
Figure 13: At 340 GHz, the gain in the principal planes is symmetrical with low side lobes. The cross-polarized fields are higher in one plane but are still down more than 15 dB.
Conclusion
The results of the simulations show how the lower frequency band is radiated by the horn structure while the higher band is carried by the tapered dielectric strip. The dual-band horn design shows good performance at both frequencies with high gain, symmetrical beams and low sidelobes. The antenna has high efficiency and good return loss characteristics at both frequencies of interest.
Reference:
[1] X. Wang, C. Deng, W. Hu, Y. Liu and X. Lv, "Design of a 94/340GHz horn antenna loaded with dielectric for dual-band operation," 2017 IEEE International Symposium on Antennas and Propagation & USNC/URSI National Radio Science Meeting, San Diego, CA, USA, 2017, pp. 561-562, doi: 10.1109/APUSNCURSINRSM.2017.8072323.


