This example demonstrates the accuracy of XFdtd for scattering from a finite conducting cylinder. The bistatic scattering pattern from an incident plane wave is computed at a single frequency.
The cylinder is considered perfectly conducting and measures 916 mm in length and 50 mm in diameter. The cylinder is oriented along the Y axis with an incident plane wave arriving from the +X direction as shown in Figure 1. The far field bistatic RCS pattern is computed in a circular arc surrounding the cylinder as shown as the red circle in Figure 1. The plane wave is shown as the yellow arrow at the right of the figure and the electric field is oriented along the axis of the cylinder. The input signal is a 10 GHz sinusoid.

Figure 1: The cylinder geometry is shown oriented along the Y axis. The incident plane wave is shown as a yellow arrow to the right. The red circle represents the far field pattern that will be computed in the XY plane.
The cylinder is meshed in an FDTD grid with a cell size of 2 mm which represents 15 cells per wavelength. The XACT Accurate Cell Technology meshing feature is used to map the FDTD mesh to the curved surface of the cylinder. A cross sectional view of the cylinder showing the mesh size and XACT curvature is shown in Figure 2.

Figure 2: A cross sectional view of the FDTD mesh in 2mm resolution of the cylinder showing the XACT meshing at the curved surface of the cylinder.
The simulation is performed using the Total Field/Scattered Field formulation in the software and run on an NVIDIA Quadro 3000M GPU card in less than 15 seconds. The resulting bistatic scattering pattern in the forward direction is compared to measured results from a published paper [1] and shows very good agreement as may be seen in Figure 3. The full bistatic pattern is shown as a polar plot around the XY plane in Figure 4. Three dimensional views of the bistatic pattern are shown in Figures 5, 6, and 7.
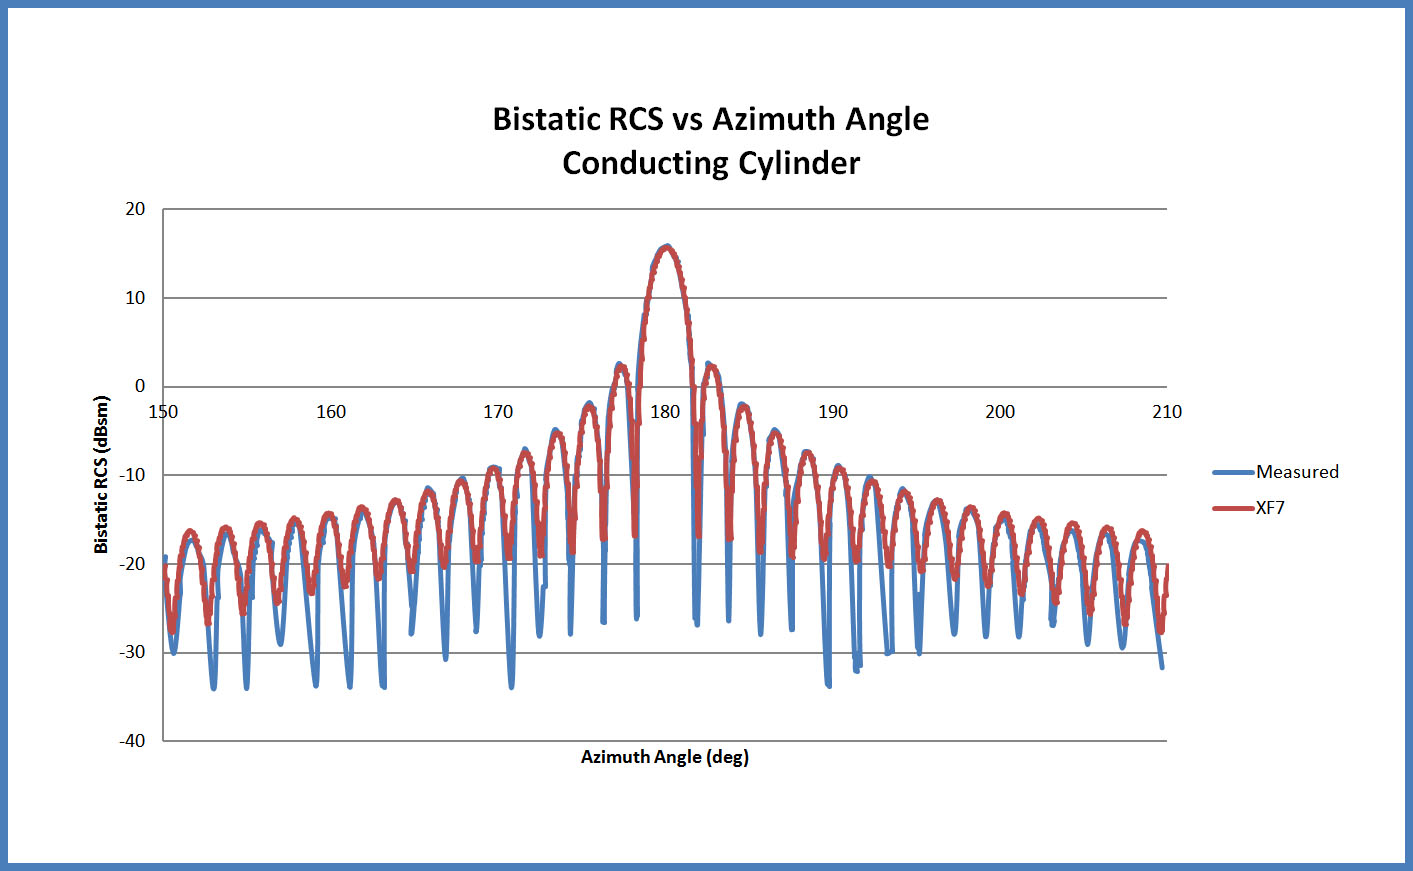
Figure 3: The computed bistatic radar cross section compared with measured results for the forward scatter direction. Excellent agreement is found.
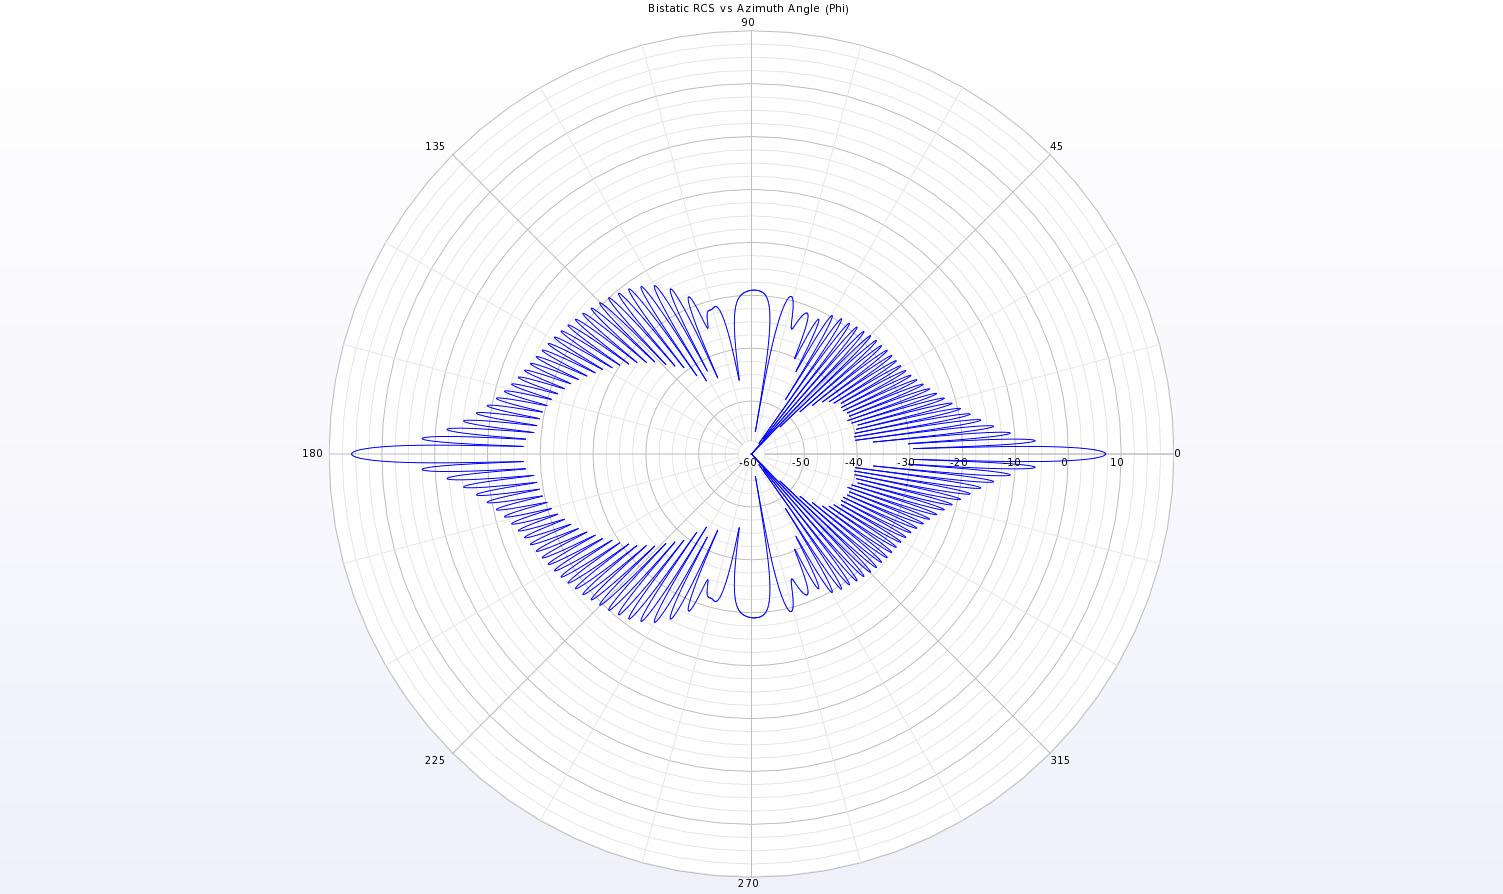
Figure 4: A full polar plot in the XY plane of the bistatic scattering pattern for the conducting cylinder.
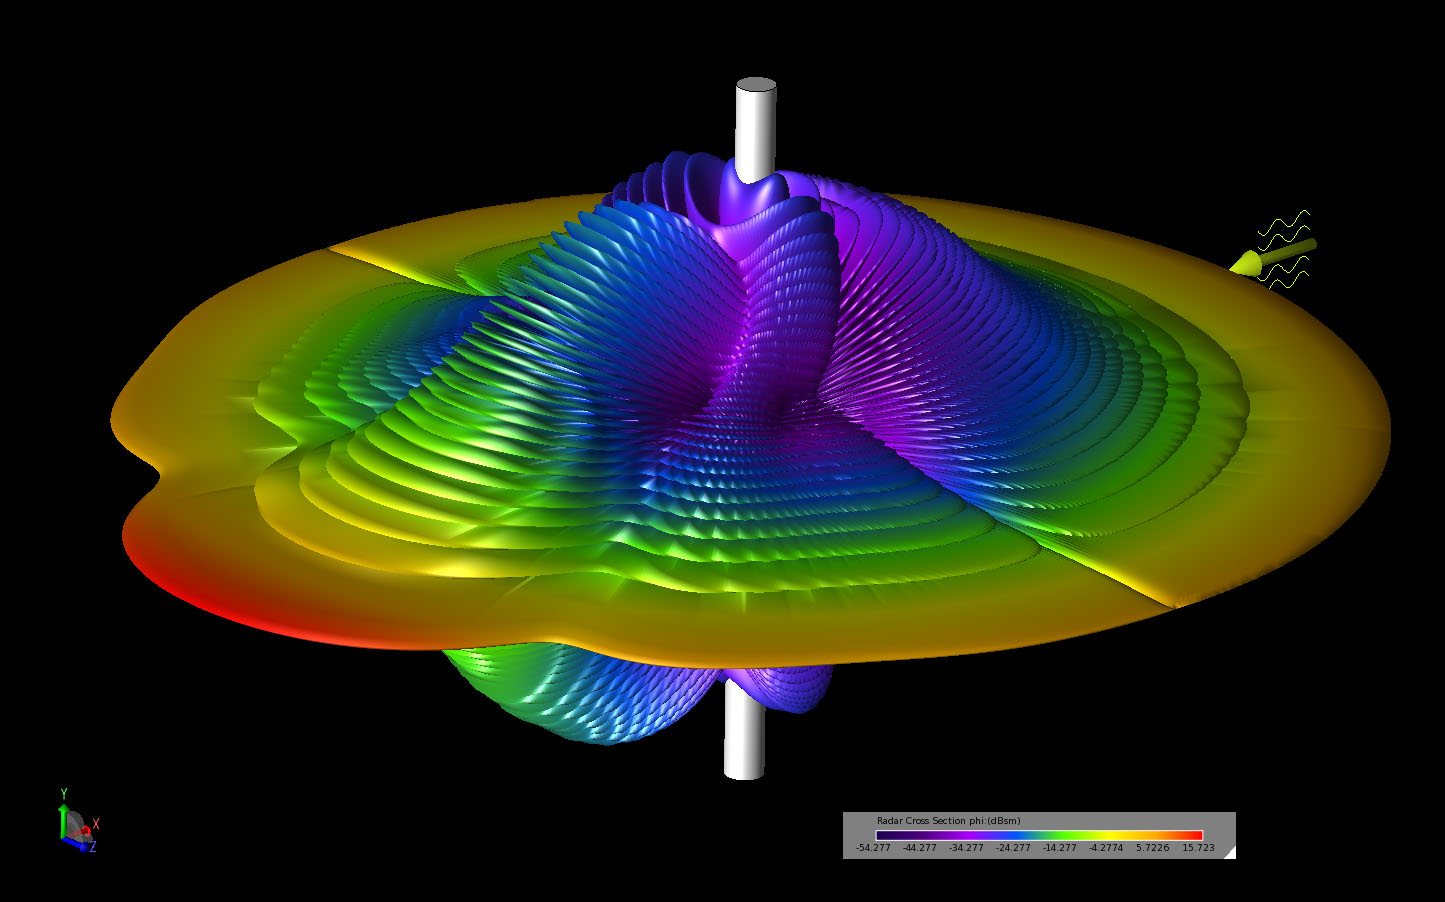
Figure 5: A three-dimensional view of the bistatic scattering pattern shown from an angled viewing position.
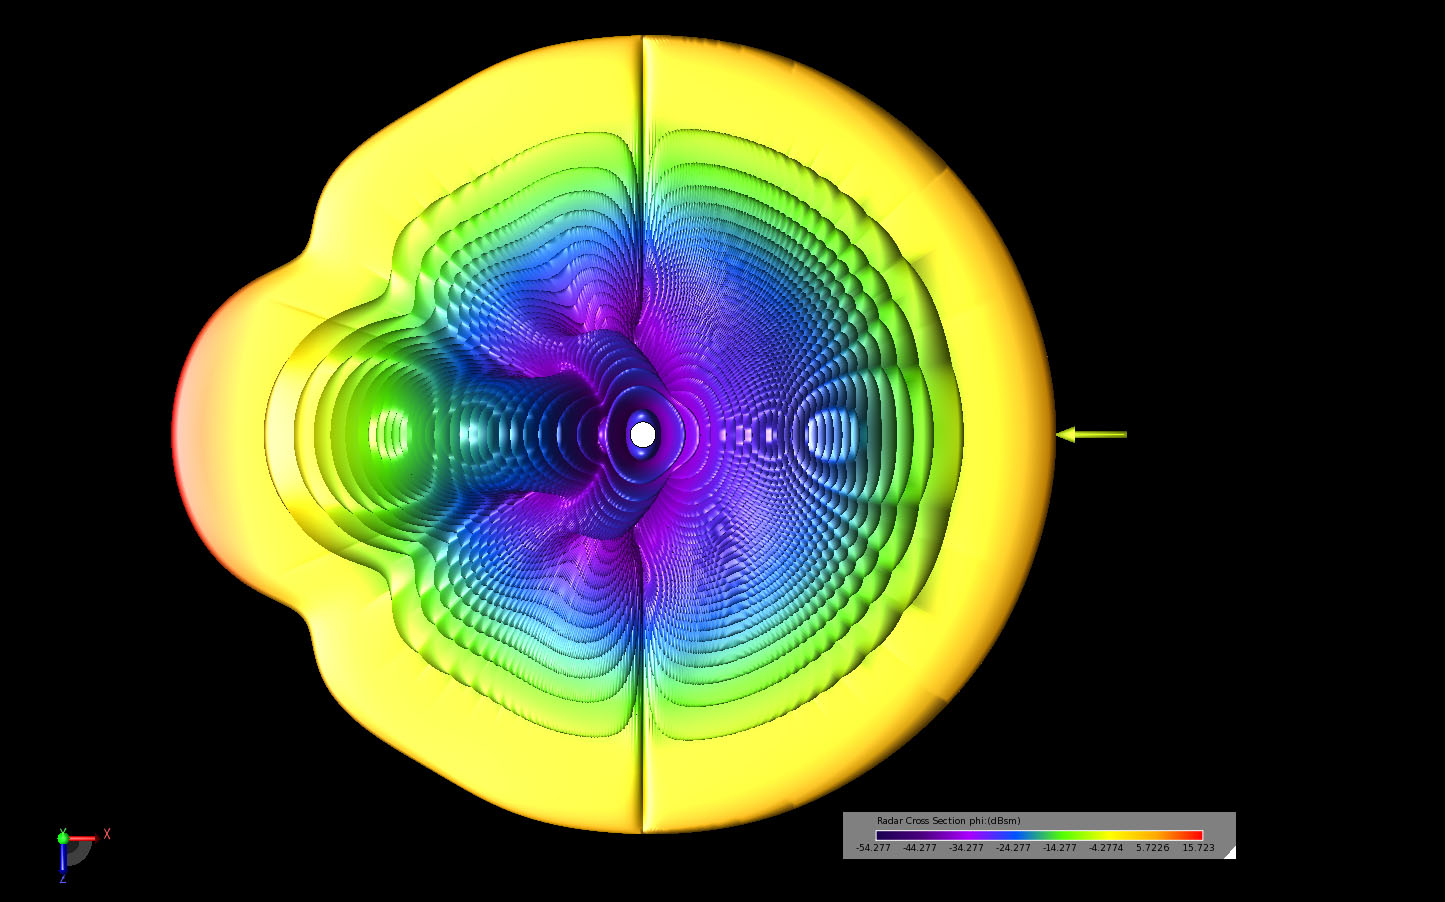
Figure 6: A three-dimensional view of the bistatic scattering pattern shown in the XZ plane.
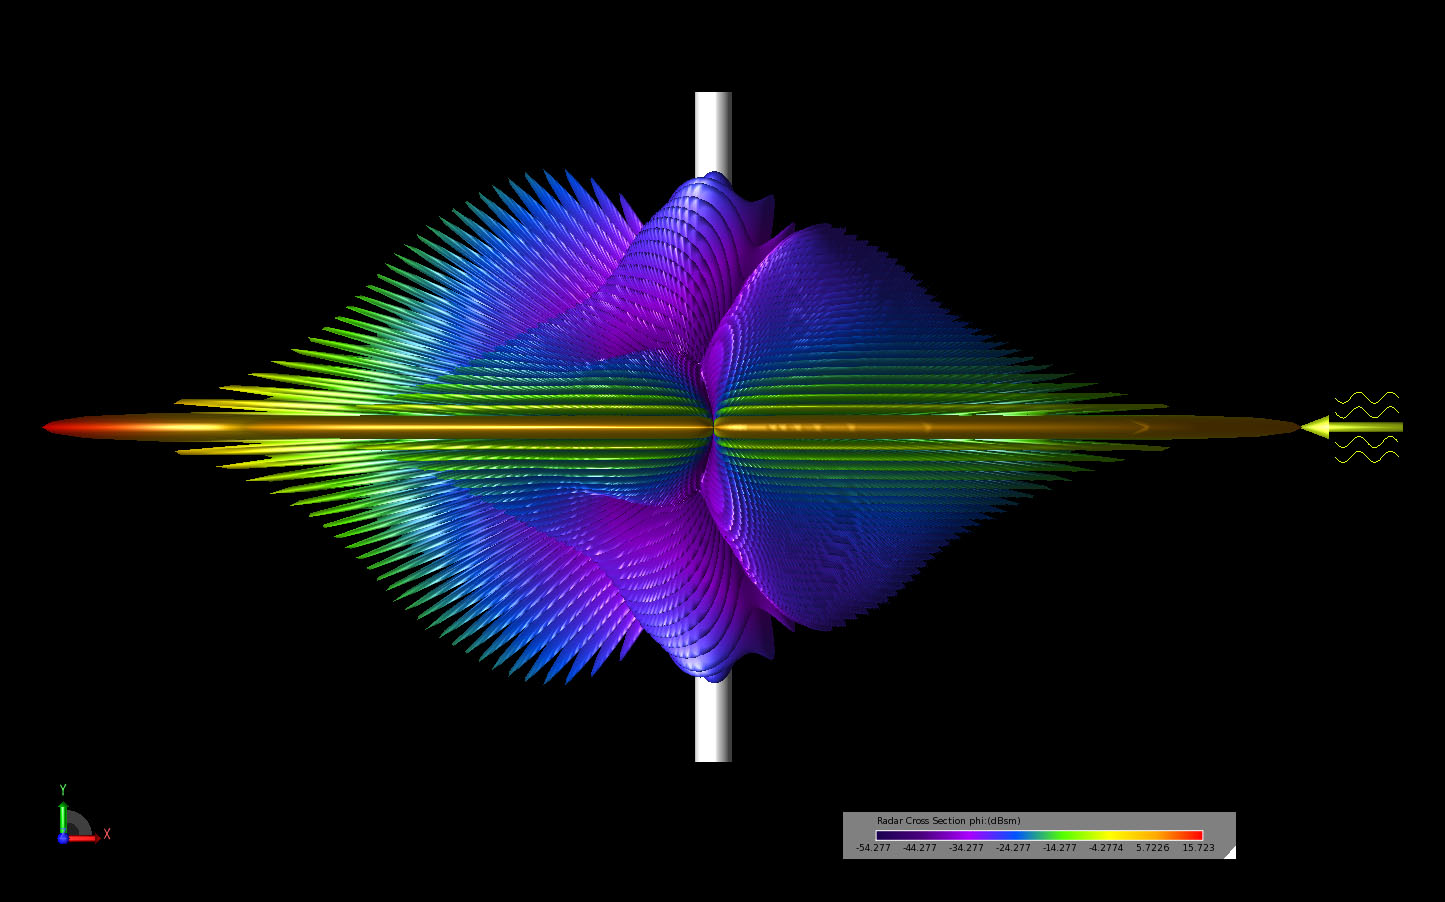
Figure 7: A three-dimensional view of the bistatic scattering pattern shown in the XY plane.
References
-
R. A. Marr, U. H. W. Lammers, T. B. Hansen, T. J. Tanigawa, and R. V. McGahan, “Bistatic RCS Calculations From Cylindrical Near-Field Measurements—Part II: Experiments,” IEEE Trans. Antenna Propag., Vol. 54, Dec. 2006, pp. 3857-3863.