Introduction
Dielectric resonator antennas have numerous characteristics that make them useful, including low loss, high efficiency, and compact size. This example demonstrates how XFdtd’s antenna simulation and design capabilities can analyze two similar cylindrical dielectric resonator antennas (DRA) which have been developed for dual-polarization performance for different bands. The first antenna is dual-band for covering DCS (1.71-1.88 GHz) and WLAN (2.4-2.48 GHz) bands. The second design is wideband covering the WLAN and parts of the WiMAX band (up to 2.69 GHz). Both designs are from the paper [1] referenced here, and results presented are a good match to the measurements provided in the paper.
Device Design and Simulation
The general device design consists of a cylindrical dielectric resonator (relative permittivity = 6.85, height = 50.5 mm, radius = 22 mm) mounted above a copper ground plane over a 1.57 mm thick substrate (relative permittivity = 2.33). The antenna has two ports which are located on adjacent sides of the ground plane; one feeding a coaxial probe connected to a small strip on the side of the cylinder and the other coupled through slots in the ground plane under the dielectric resonator. The overall design is visible in Figure 1, where the two ports are shown in bright green on the YZ and XZ edges of the substrate. Both designs use microstrip lines on the bottom side of the substrate to connect the ports. The dual-band design has two perpendicular slots in the ground plane (visible in Figure 2), which couple port 2 to the DRA, while the coaxial probe connects port 1. The wideband design (Figure 3) is similar, but the microstrip line feeding port 2 has an added impedance transformer and curved slots of different sizes to couple the energy to the DRA.
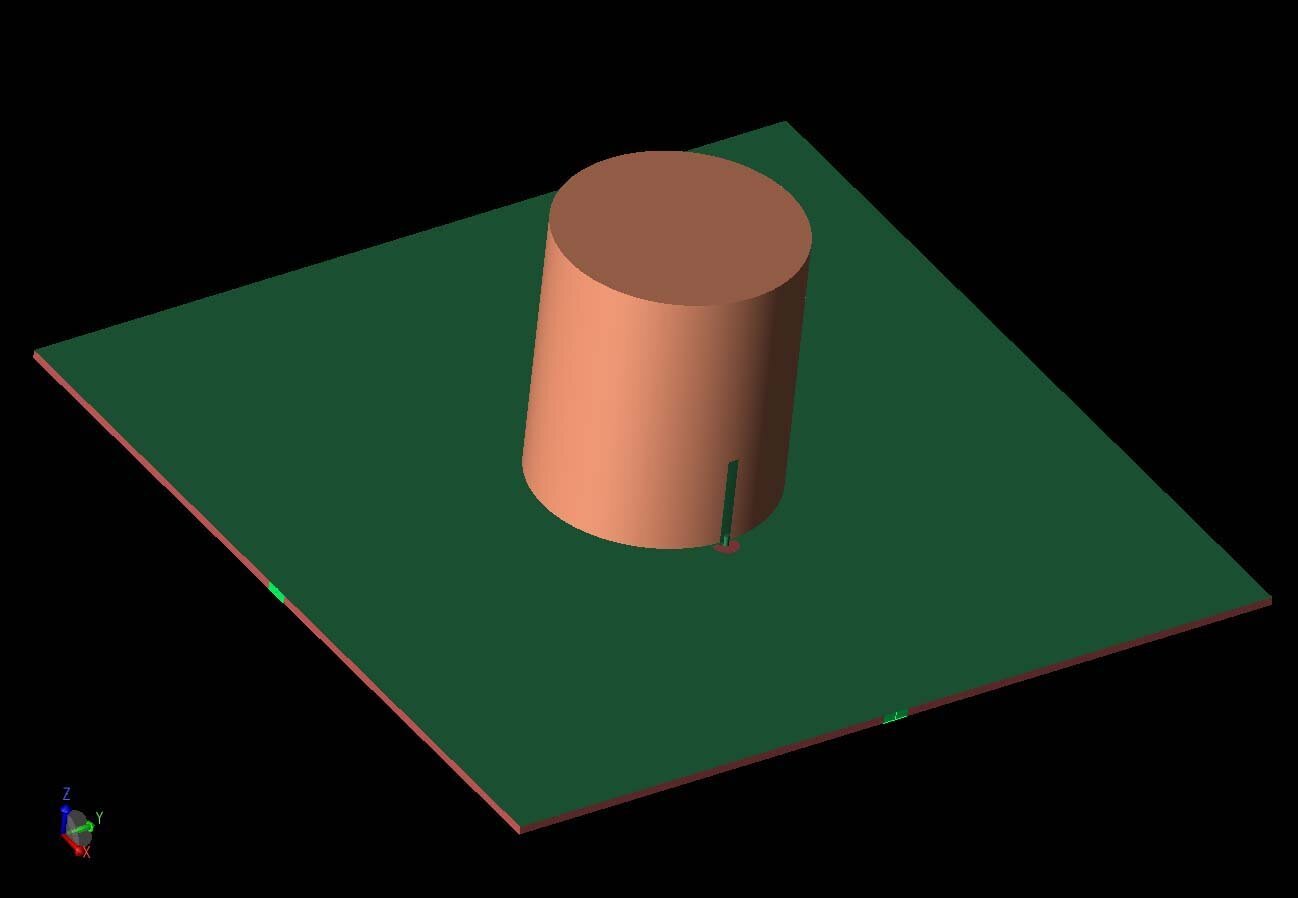
Figure 1: A three-dimensional CAD view of the antenna geometry shows the DRA cylinder with coaxial probe feed, and the two input ports at the left and right of the substrate are shown in light green. The second port is fed by a coupled slot in the ground plane.

Figure 2: A top view of the dual-band antenna shows the underlying microstrip feeds from the first and second ports and the two slots in the ground plane for coupling the second port into the DRA.

Figure 3: The wideband antenna is identical for port 1 with the coaxial probe, but has several modifications to the port 2 feed including an impedance transformer on the microstrip line and two curved slots for coupling.
Dual-Band Antenna
The S-parameters for the dual-band antenna shown in Figure 4 have shallow nulls in the return loss around the two bands (DCS and WLAN) of interest. The cross-coupled S21 plot shows isolation of greater than 35 dB. The gain directly above the cylinder is plotted versus frequency in Figure 5 and shows gain around 7 dBi for the lower band and about 8.5 dBi for the higher band for each port. In Figure 6, the radiation and system efficiencies (including mis-match losses) are plotted versus frequency for the two ports and are seen to be around 90% or greater for both ports. The envelope correlation describing the independence of the radiation patterns from each other shows values less than 5x10⁻⁵ indicating excellent isolation (Figure 7).
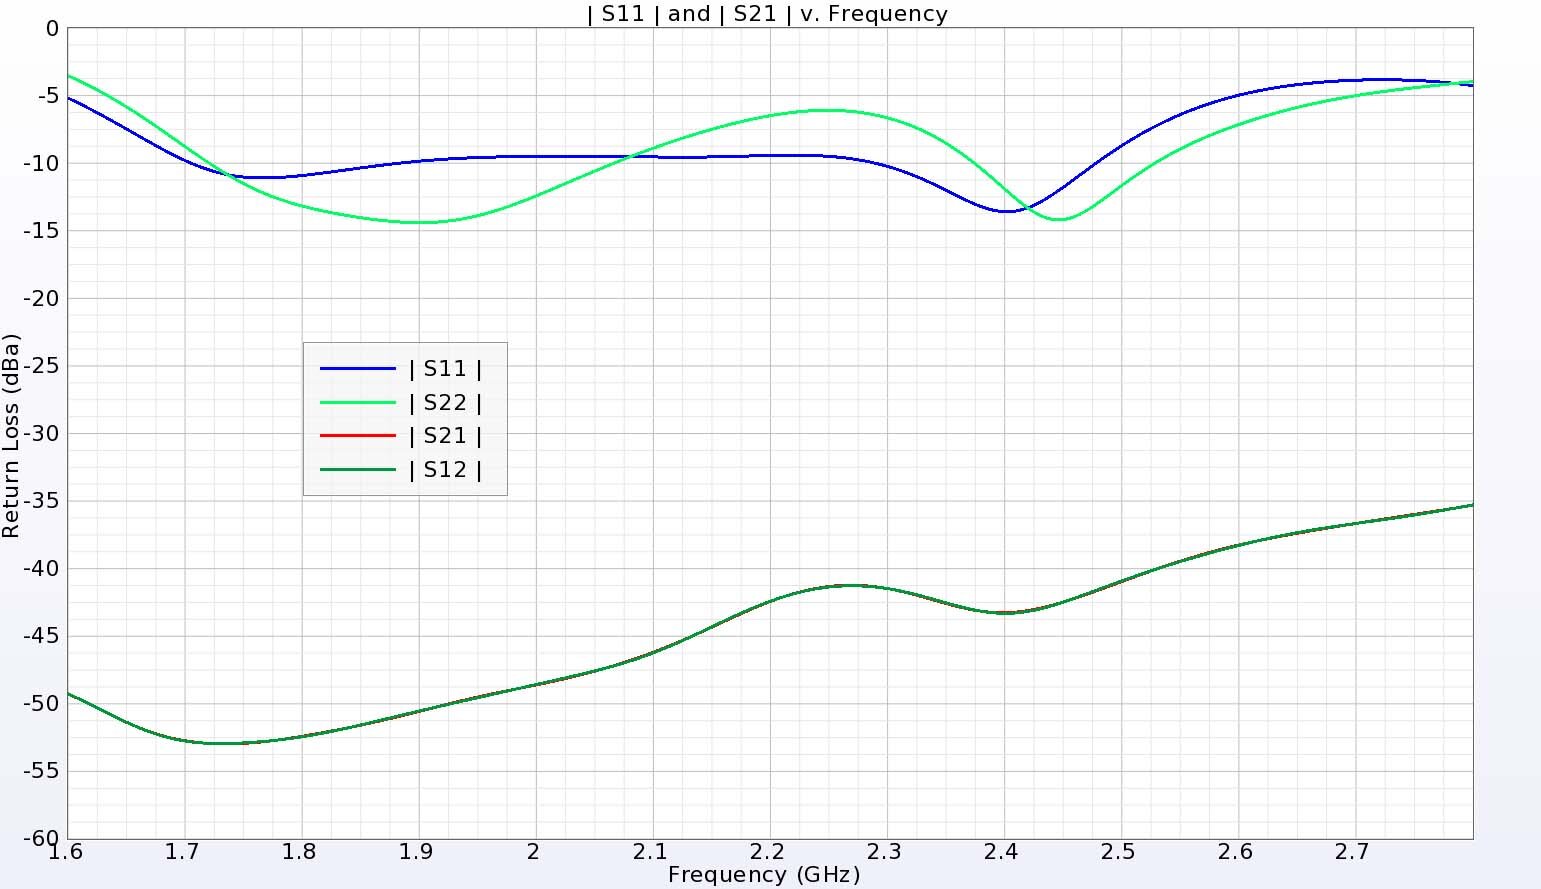
Figure 4: The S-parameter plots for the dual-band antenna show regions of operation in the 1.71-1.88 GHz and 2.4-2.48 GHz ranges. The isolation between the ports is better than 35 dB.
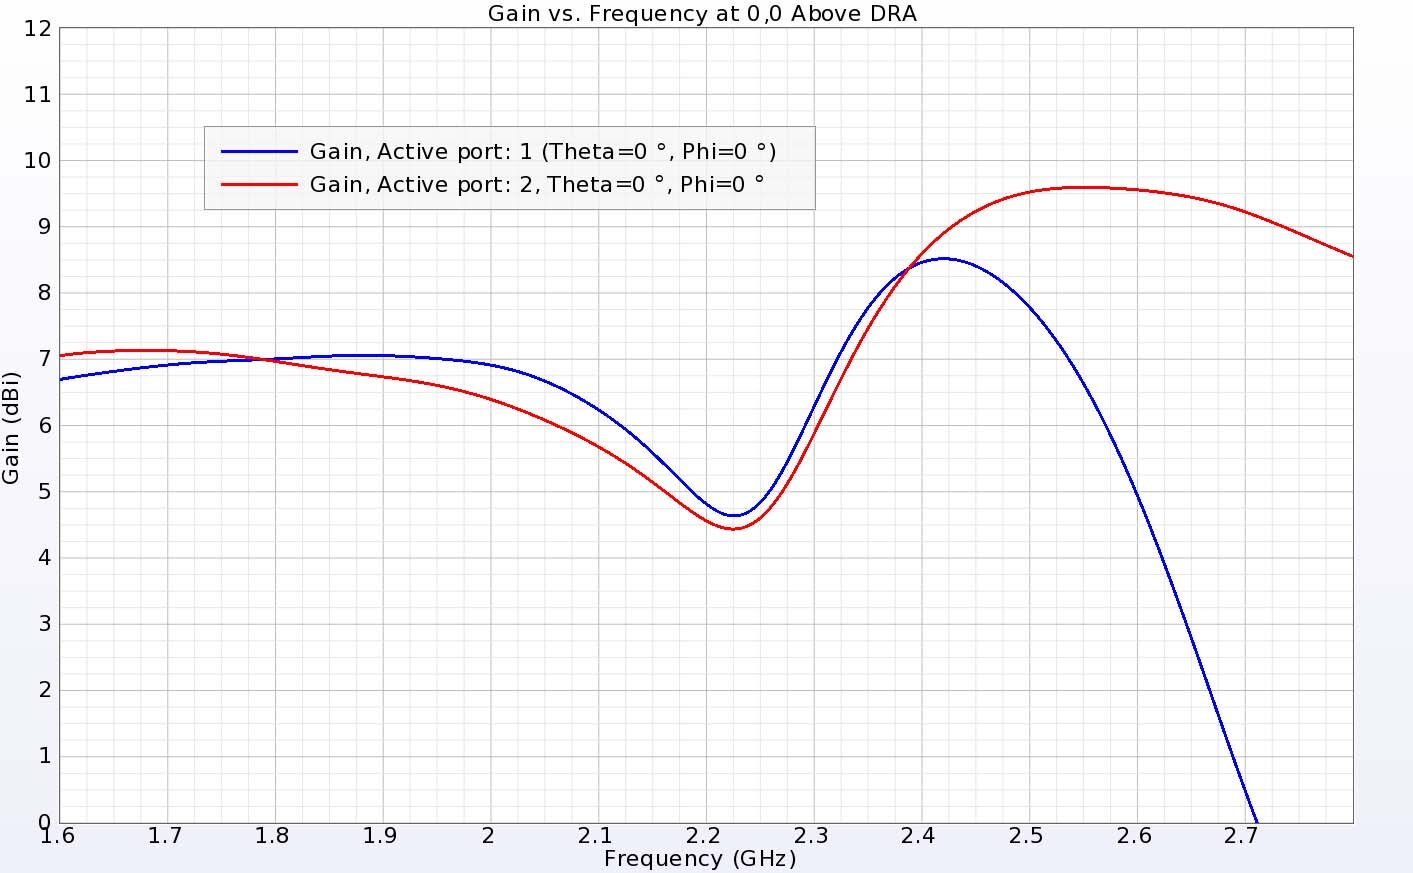
Figure 5: The gain above the DRA is near 7 dBi in the lower operating band and closer to 8.5 dBi in the upper band for both ports.
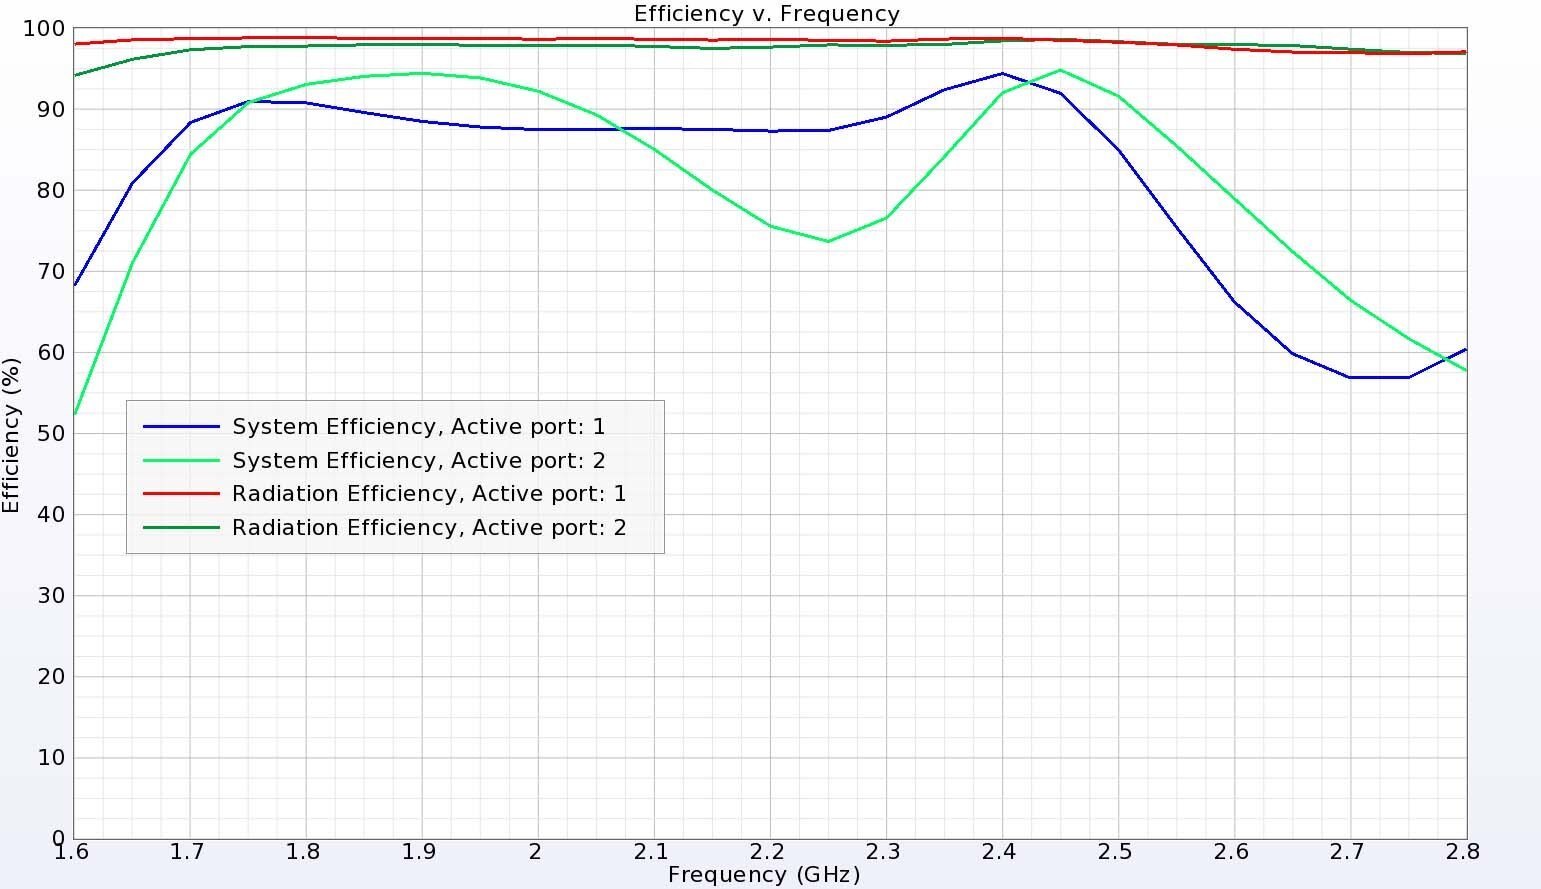
Figure 6: The dual-band antenna has good efficiency in both bands with the system efficiency around 90% due to the return loss being just below -10 dB.
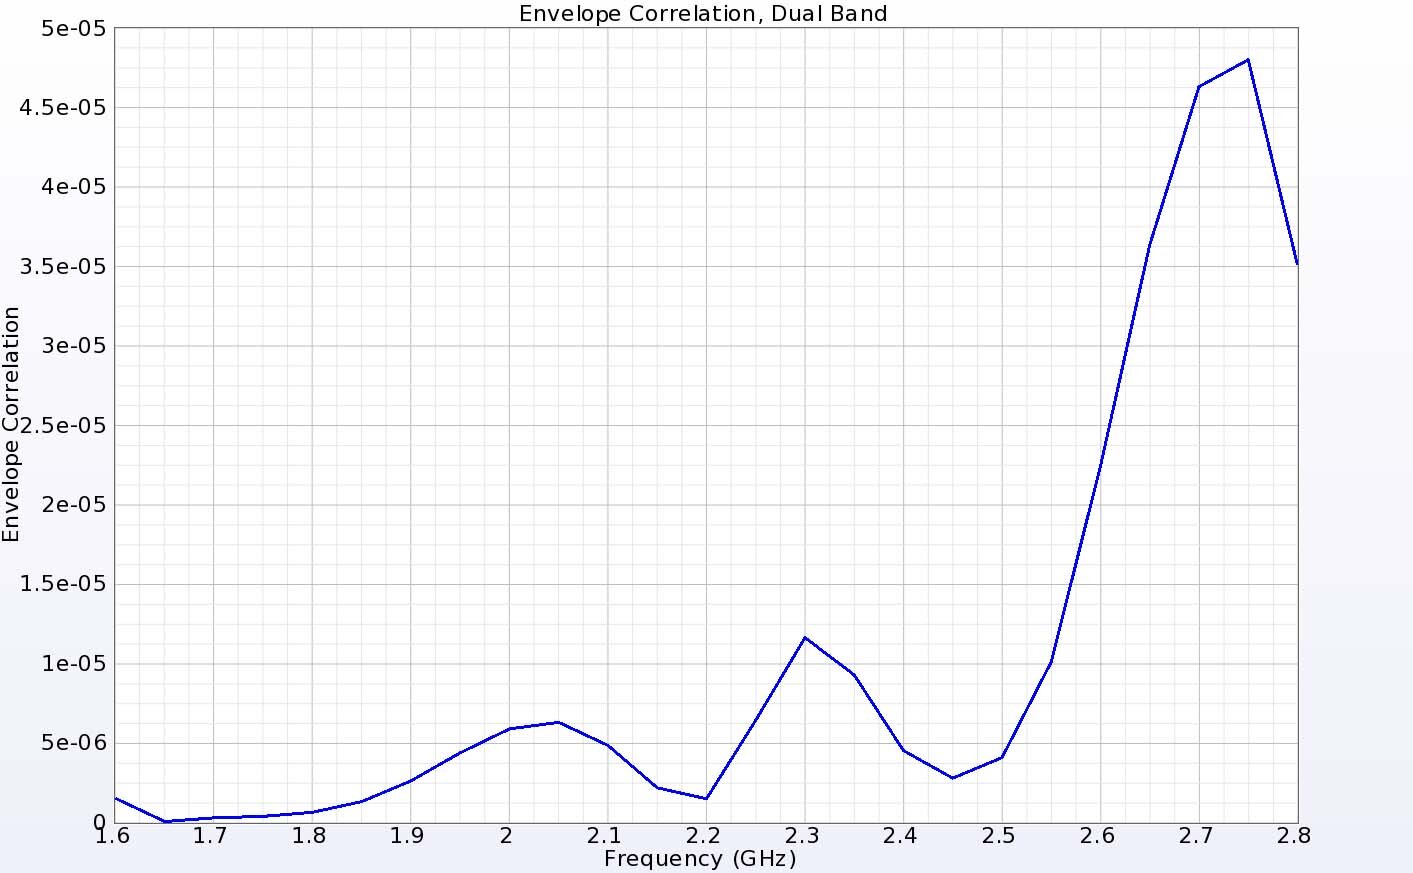
Figure 7: The envelope correlation shows there is high isolation between the two ports.
The three-dimensional radiation pattern for the dual-band antenna is shown in Figure 8 at 1.8 GHz, showing fairly uniform coverage above the ground plane. In the XZ vertical plane of the pattern, the theta-directed gain at 1.8 GHz is seen to be significantly higher than the phi-directed gain for port 1 (Figure 9), while the phi-directed gain dominates for port 2 (Figure 10). Similarly, in the vertical YZ plane, the phi gain is dominant for port 1 (Figure 11), while the theta gain is expressed for port 2 (Figure 12) at 1.8 GHz. When the WLAN band is investigated at 2.45 GHz, similar behavior is seen in Figure 13 and Figure 14 for the XZ plane. In Figure 15, the separation between the polarizations is reduced for port 1 but is still strong for port 2 (Figure 16).
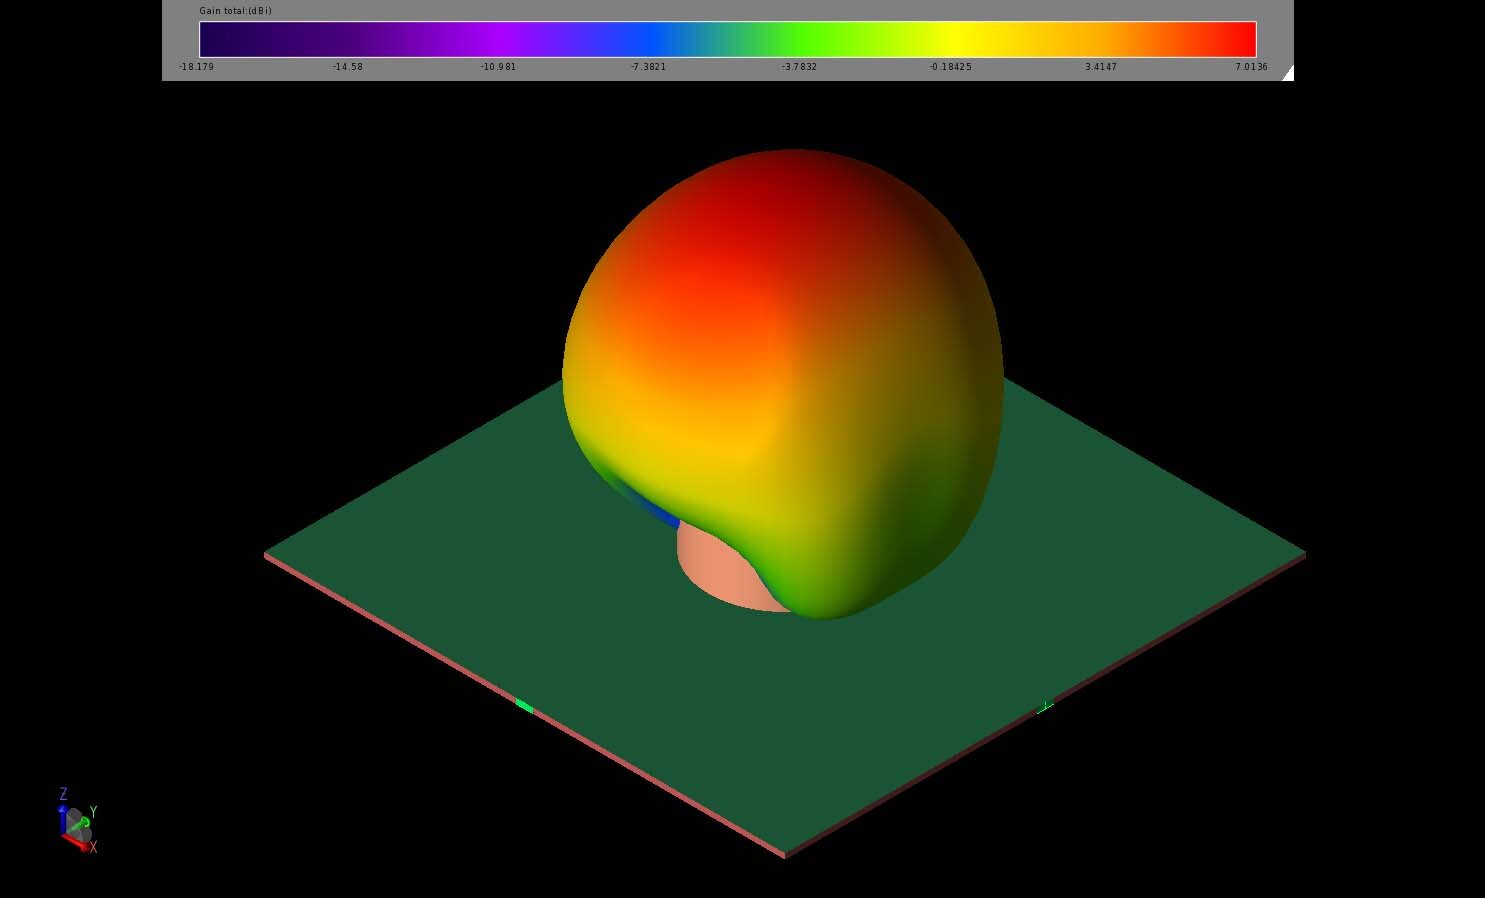
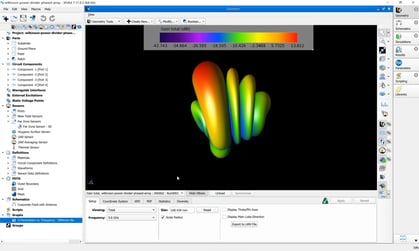
Figure 8: The three-dimensional gain pattern of the dual-band antenna at 1.8 GHz shows a broad lobe above the ground plane with peak gain around 7 dBi.
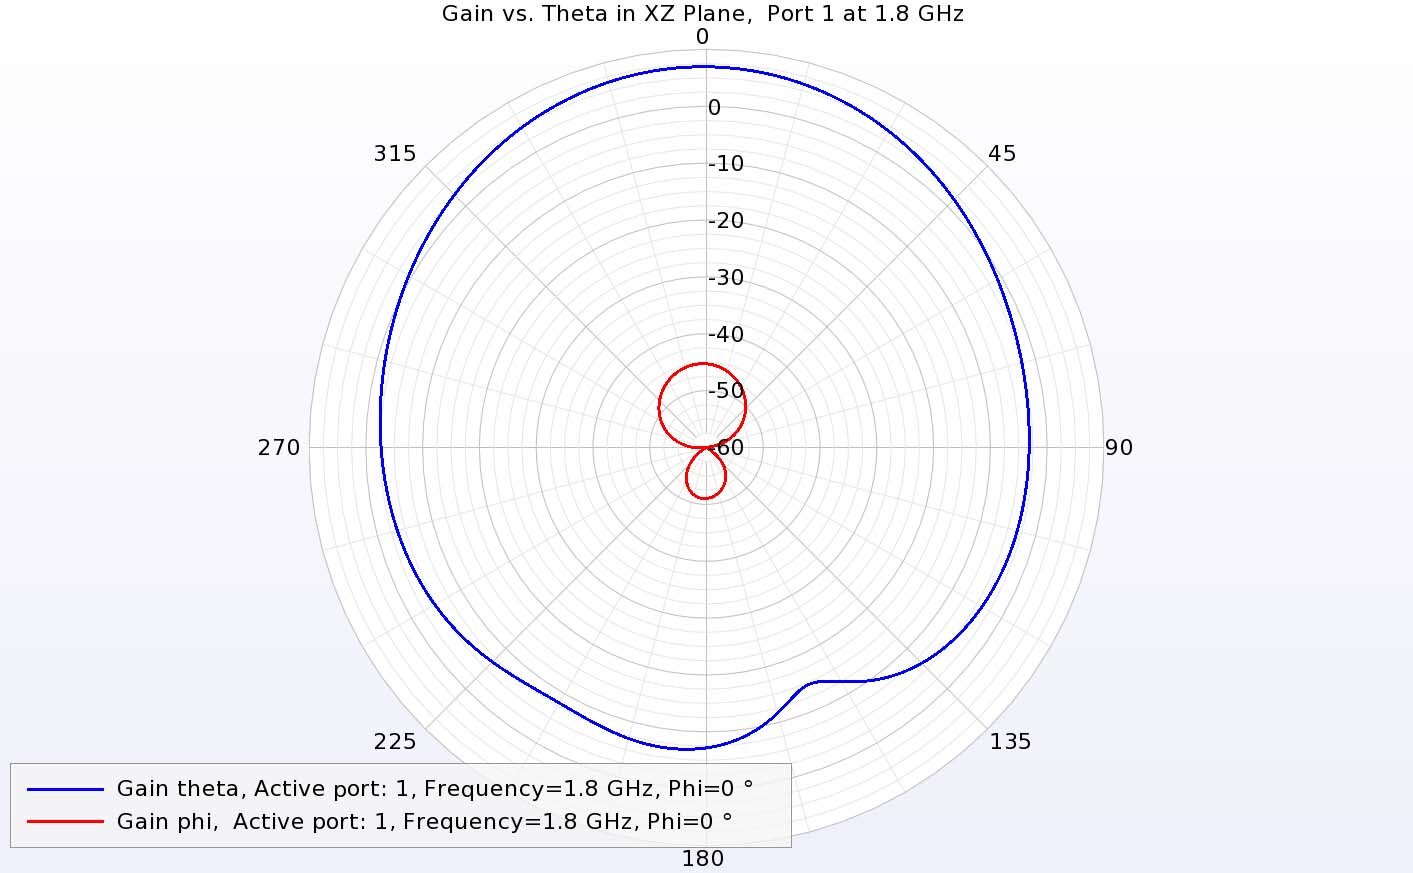
Figure 9: The gain from port 1 at 1.8 GHz in the vertical XZ plane shows strong co-polarized gain from the theta component and cross-polarized gain down more than 40 dB.
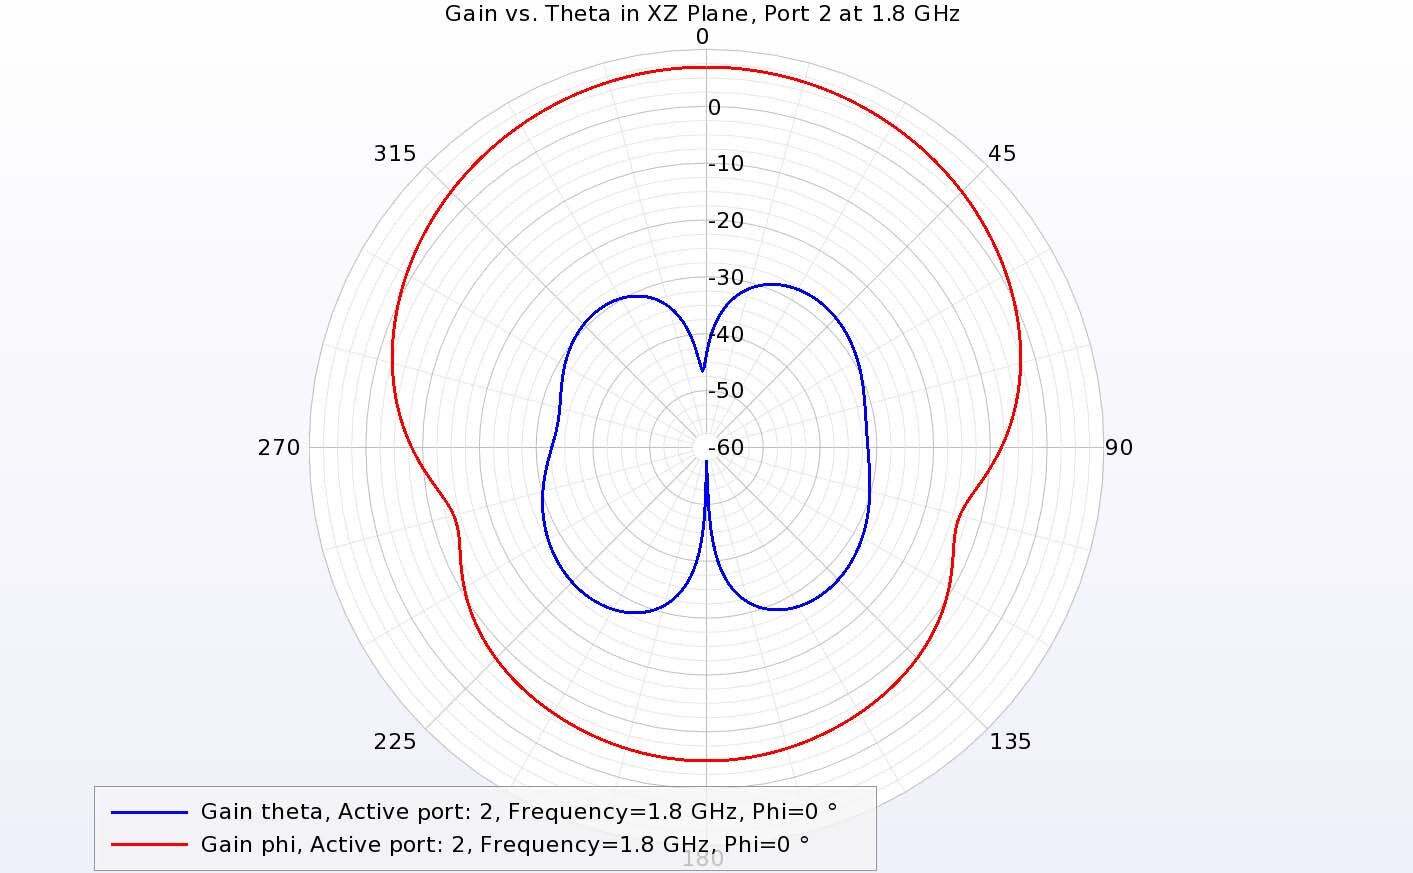
Figure 10: Port 2 at 1.8 GHz shows strong co-polarized gain from the phi component in the XZ plane, showing the dual-polarization of the antenna.
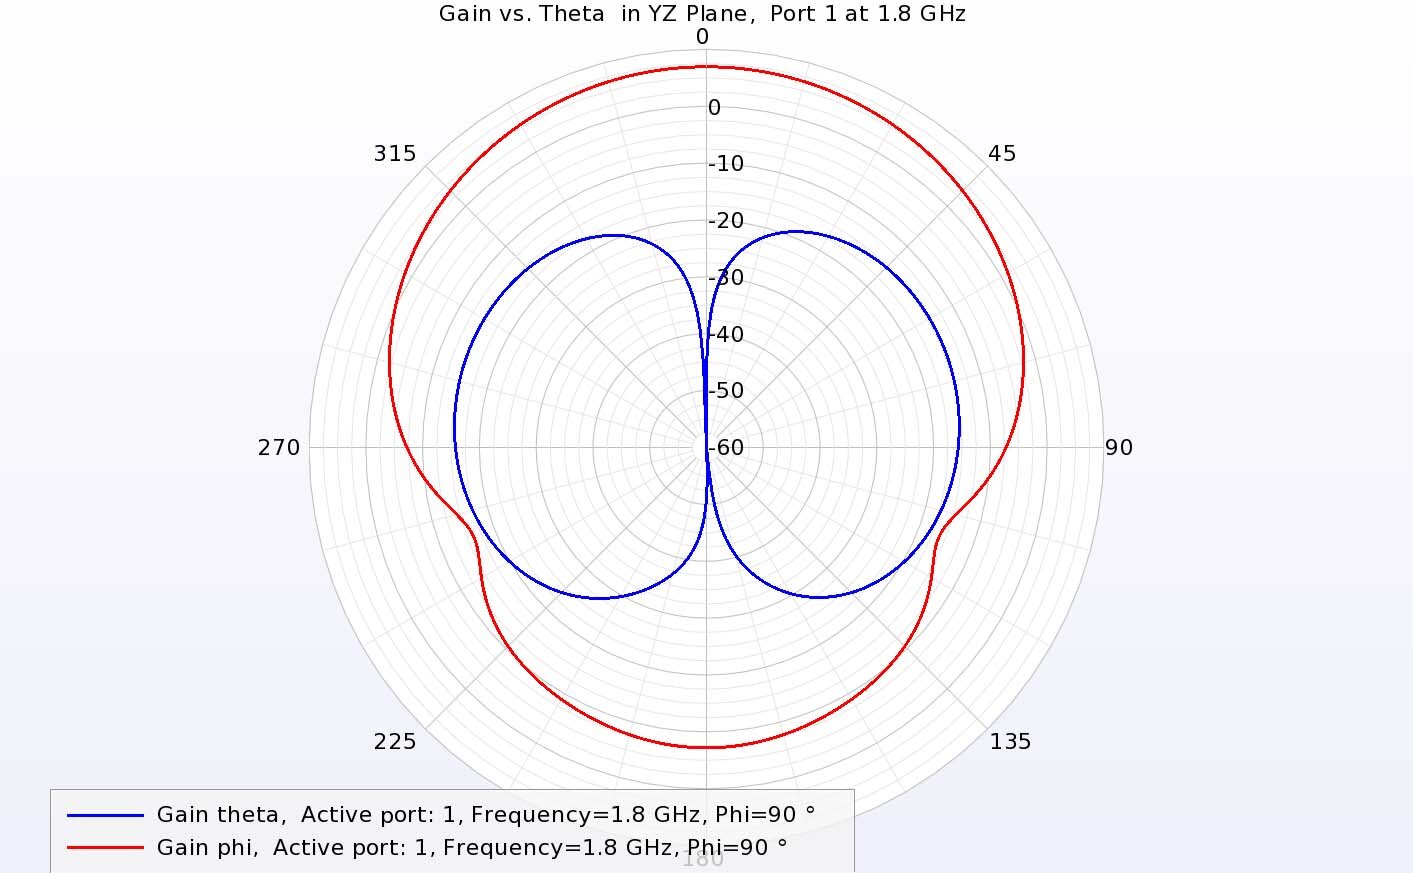
Figure 11: In the YZ plane, the theta-directed gain for port 1 is reduced and the phi-directed gain is dominant at 1.8 GHz.
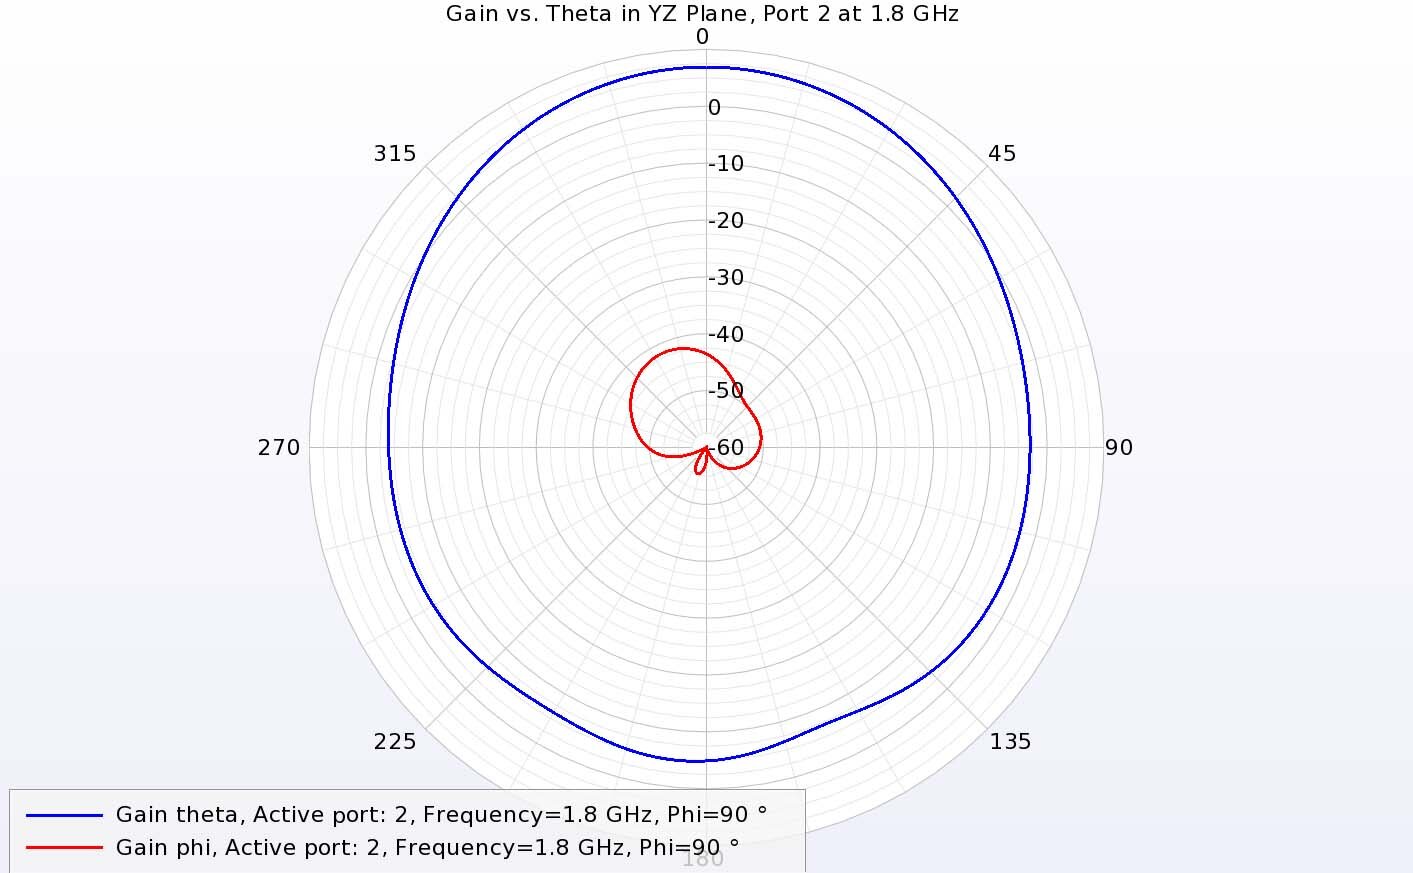
Figure 12: Port 2 in the YZ plane at 1.8 GHz shows the opposite from port 1 by having strong theta-directed gain and very low phi-directed gain.
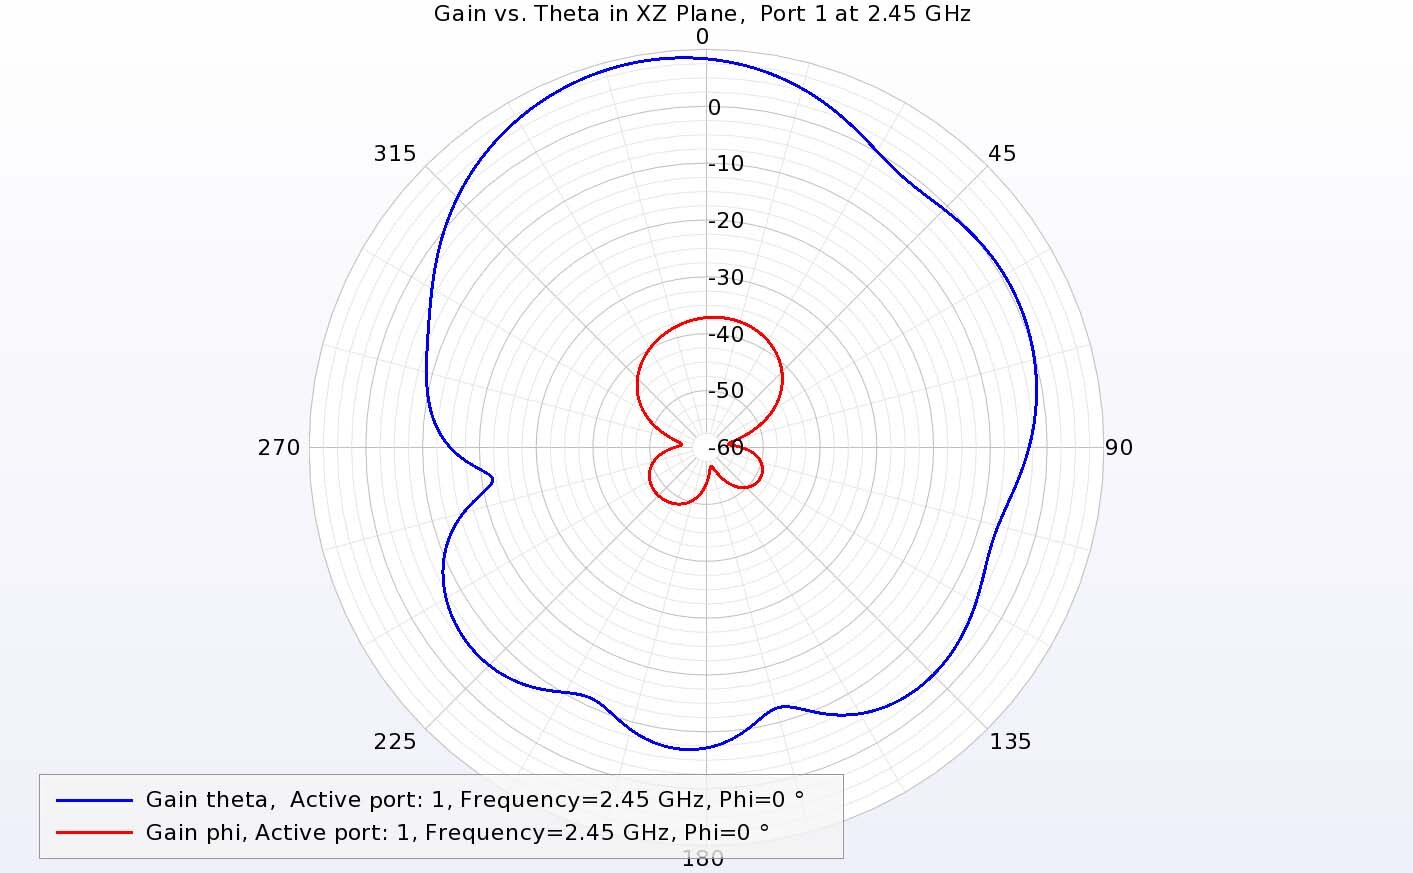
Figure 13: At 2.45 GHz in the XZ plane, port 1 has strong theta-directed gain and low phi-directed gain.
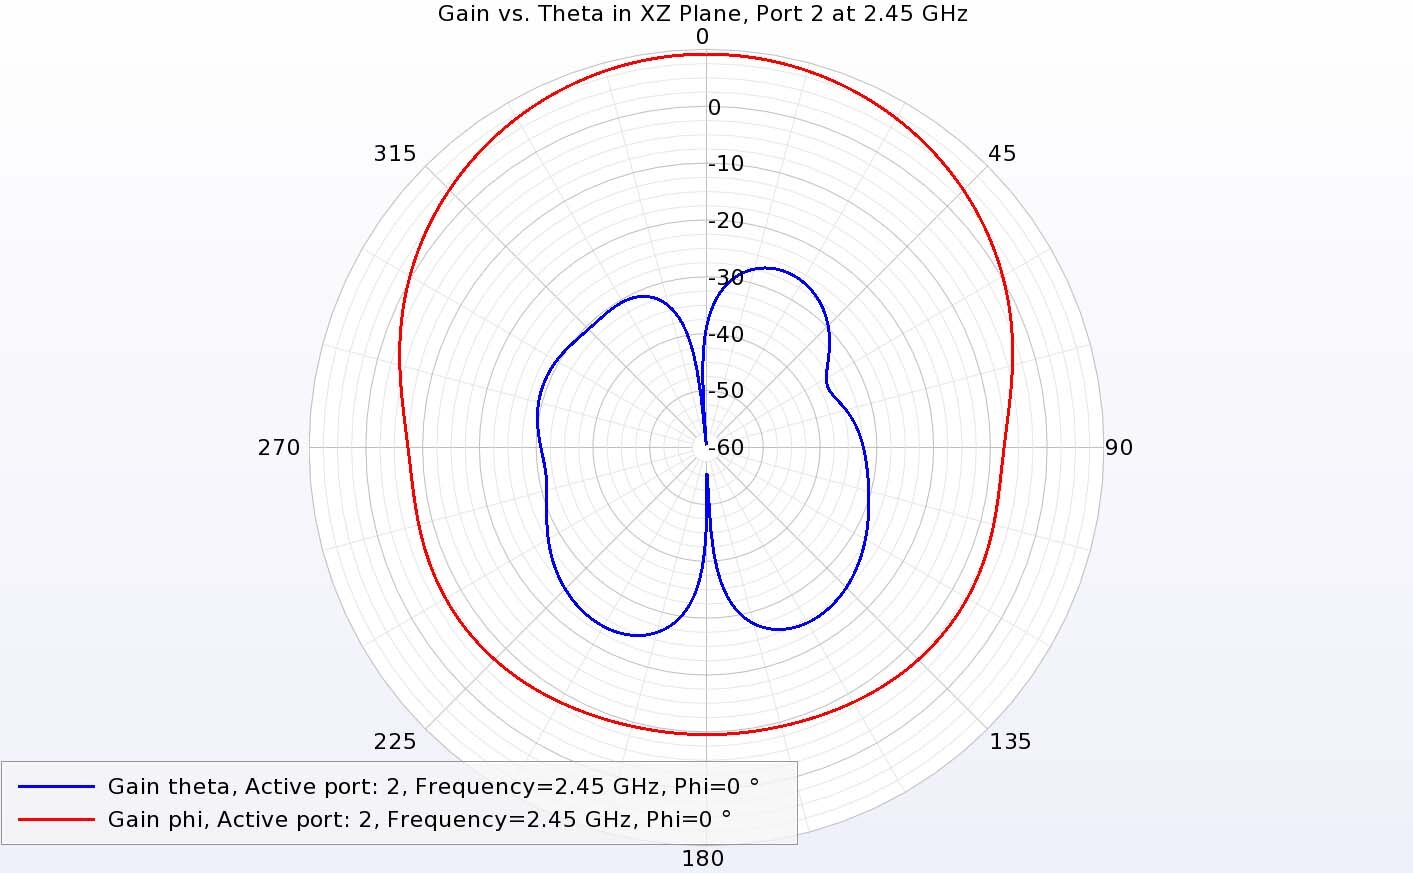
Figure 14: At 2.45 GHz in the XZ plane, port 2 has strong phi-directed gain and low theta-directed gain, the opposite of port 1.
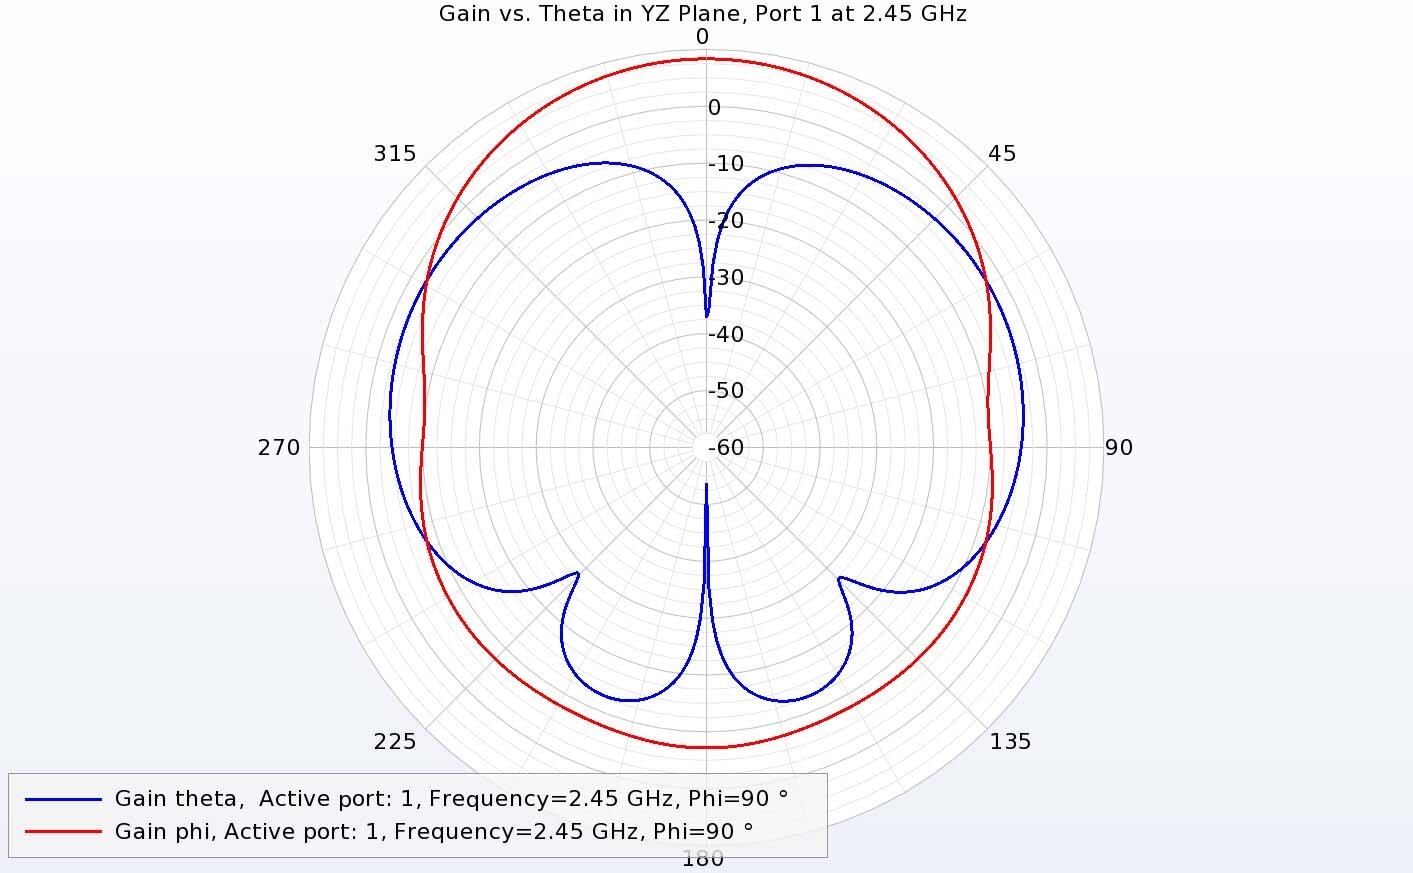
Figure 15: In the YZ plane for port 1 at 2.45 GHz, the co- and cross-polarized gains are not as well separated, but the phi-directed gain is dominant.
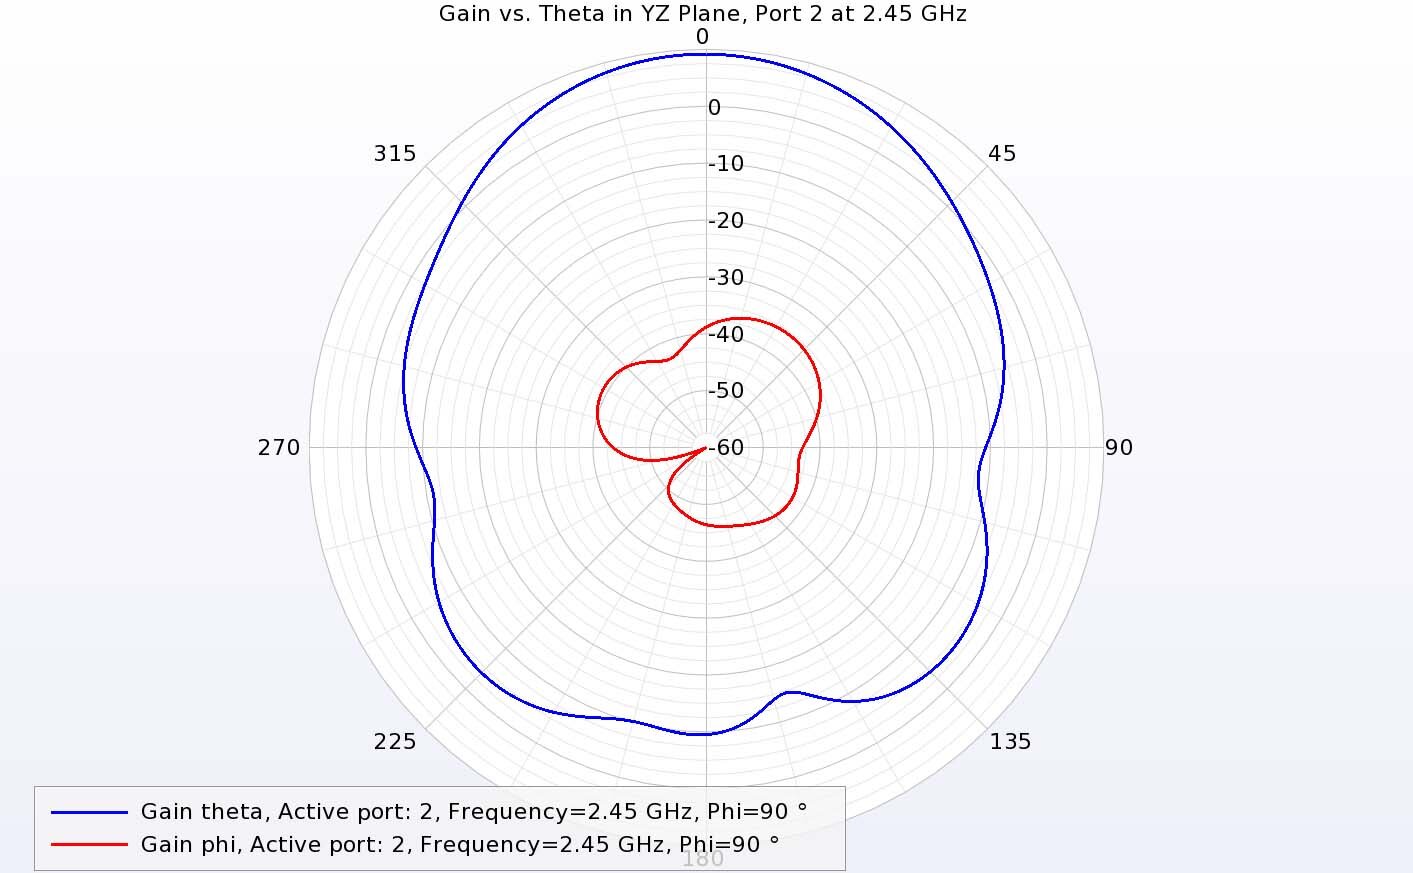
Figure 16: For port 2 at 2.45 GHz in the YZ plane, the theta-directed gain is dominant.
Wideband Antenna
The S-parameters for the wideband antenna show return loss below -10 dB for each port over the entire range of interest, while the isolation of S21 is down -45 dB as shown in Figure 17. The gain versus frequency above the DRA shows gain ranging from a low of about 5.2 dBi at 2.5 GHz to over 8.5 dBi at 2.7 GHz (Figure 18). The efficiencies plotted in Figure 19 show extremely high values for both ports over the entire range of interest due in part to the better match at the input for both ports in this design. The envelope correlation shown in Figure 20 has extremely low numbers,indicating excellent isolation between the polarizations. The three-dimensional gain pattern of the wideband design is shown in Figure 21 at 2.4 GHz and has broad coverage above the ground plane.
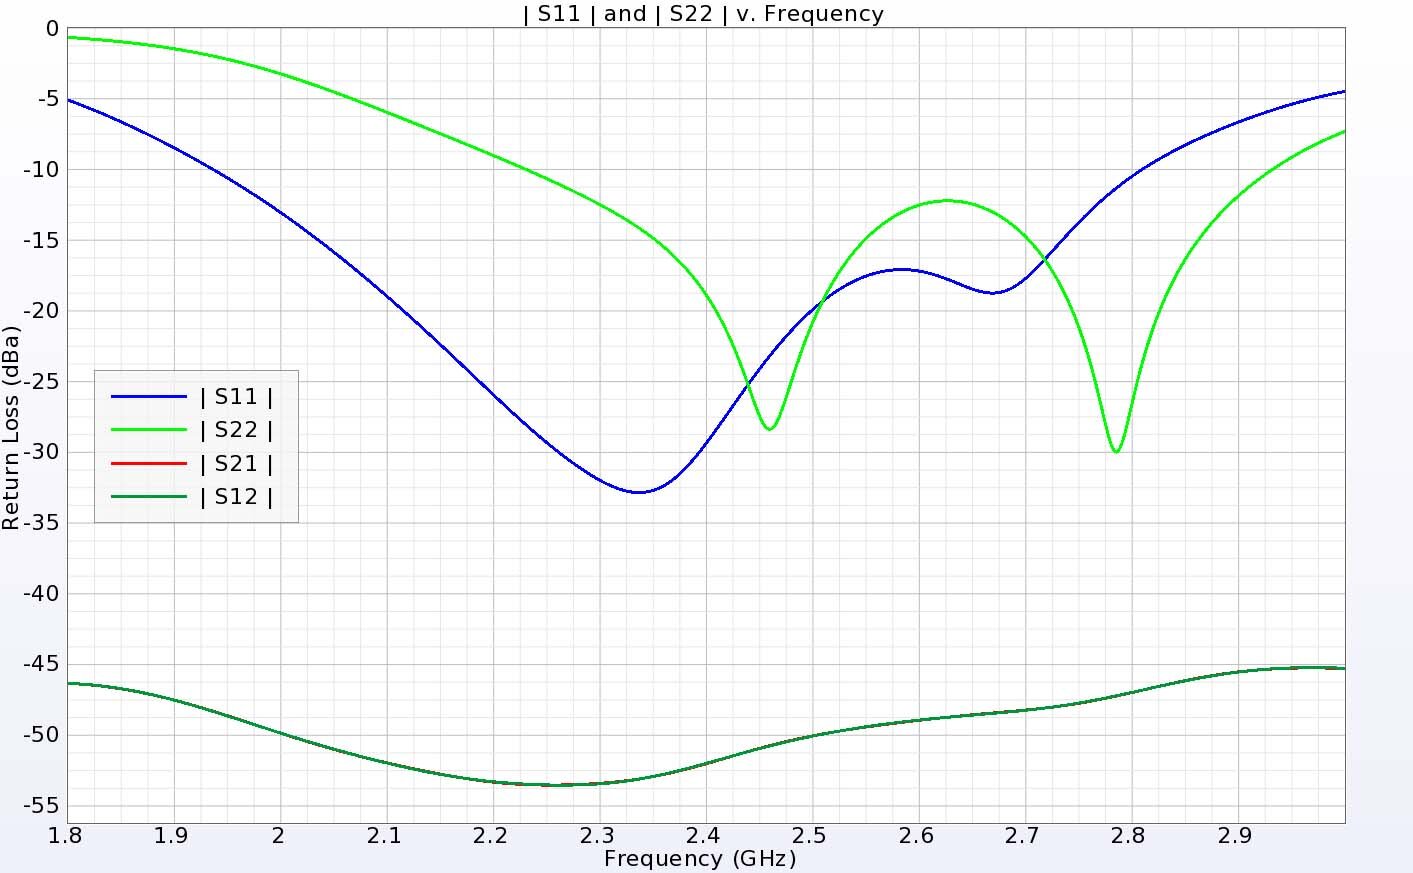
Figure 17: The wideband antenna has return loss below -10 dB from about 2.25 to 2.8 GHz for the two input ports which covers more than the entire bands of interest. The isolation between the ports is greater than 45 dB.
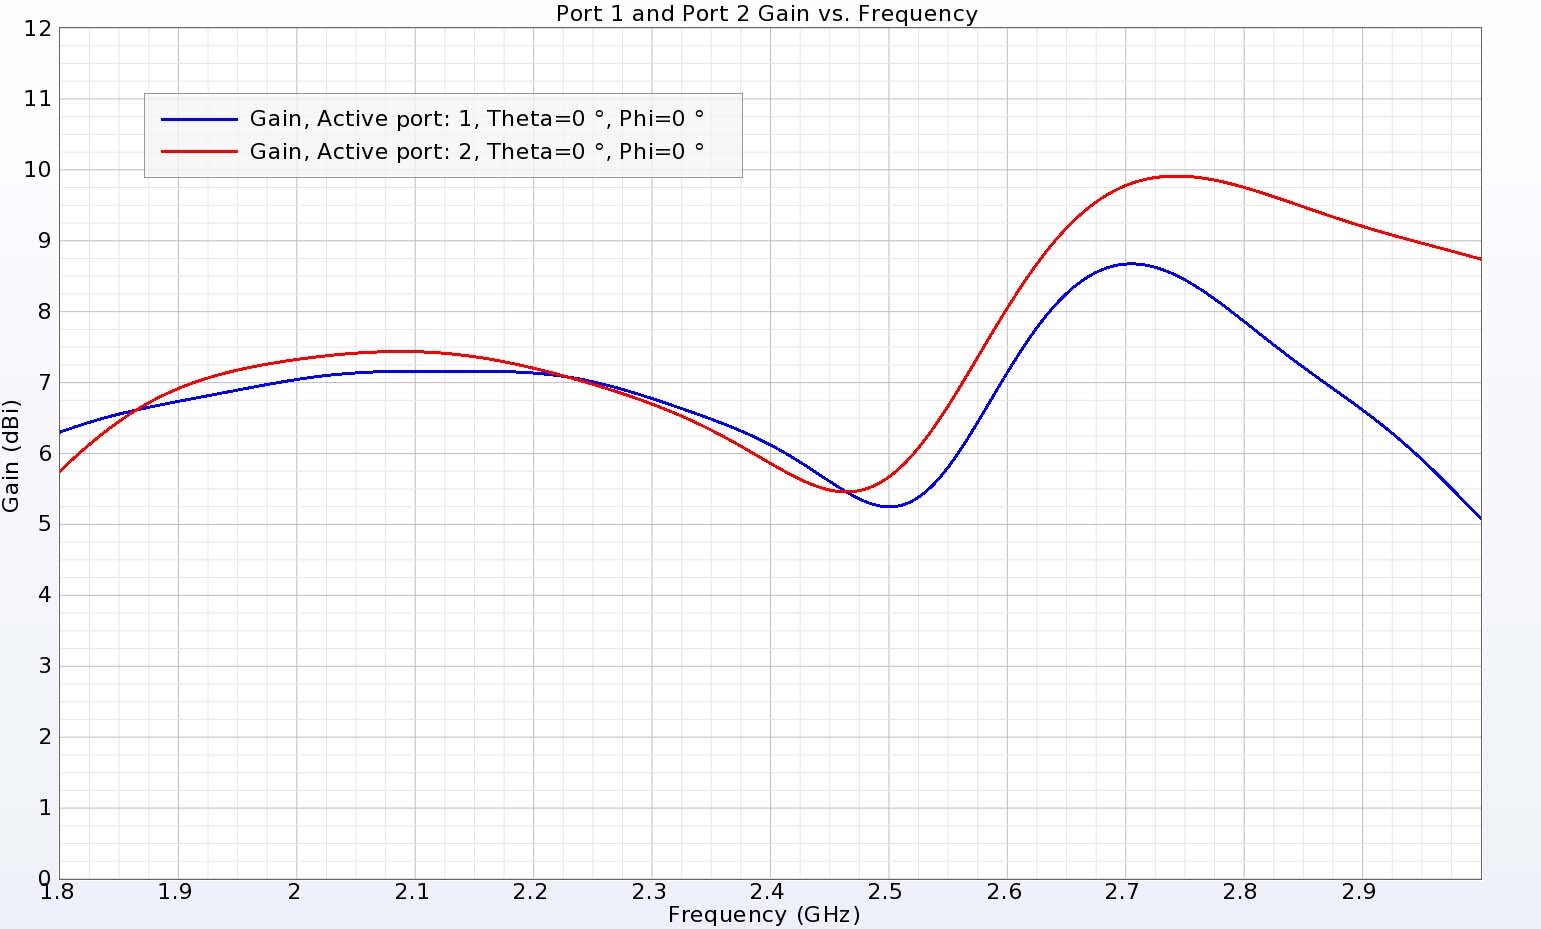
Figure 18: The gain over the DRA versus frequency shows gain ranging from 5.2 to 10 dBi over the bands of the antenna.
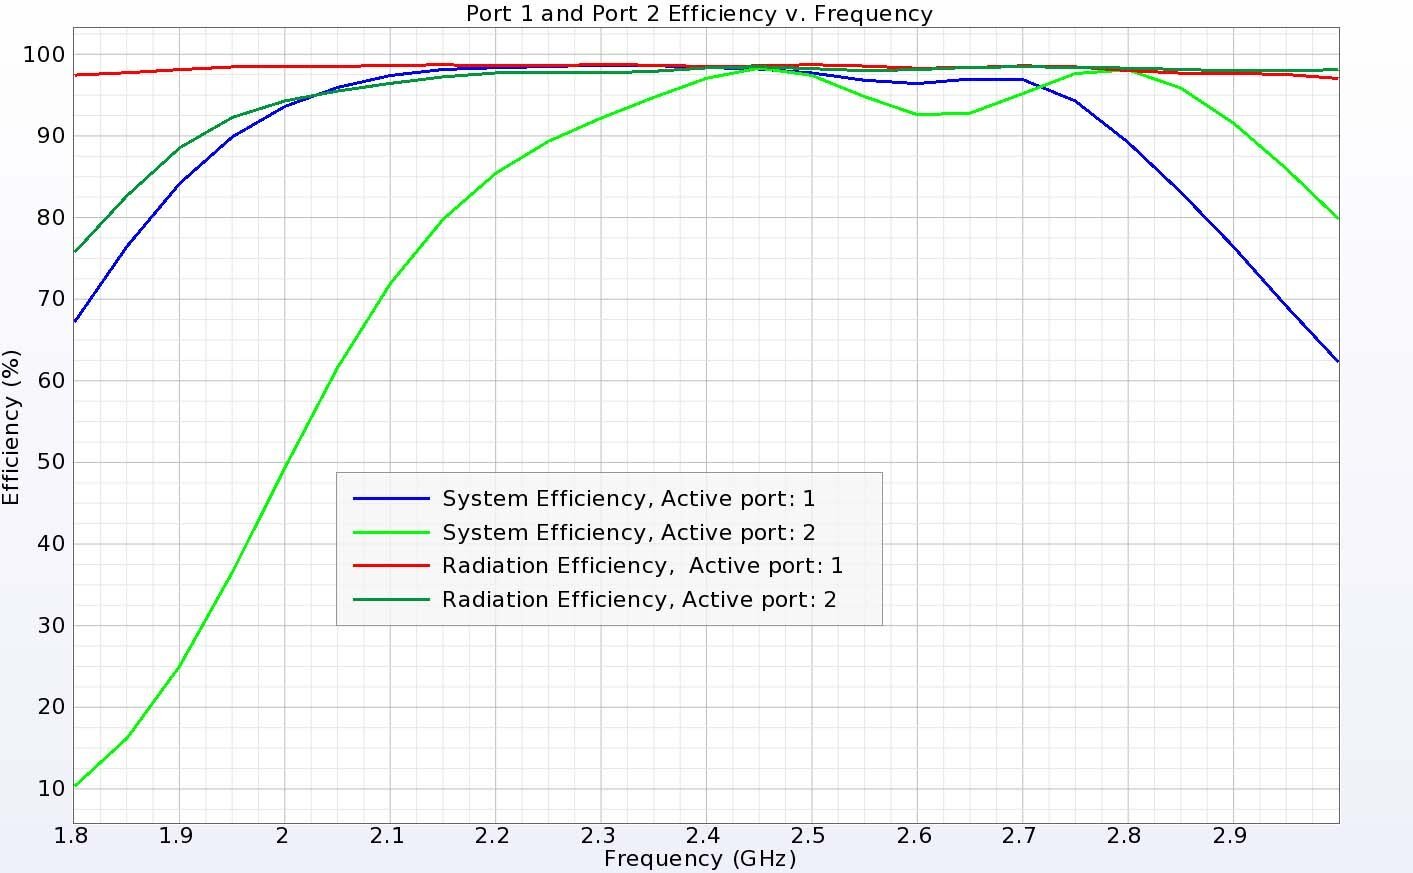
Figure 19: The wideband antenna is very efficient with radiation and system efficiencies near 100 percent over the bands of interest.
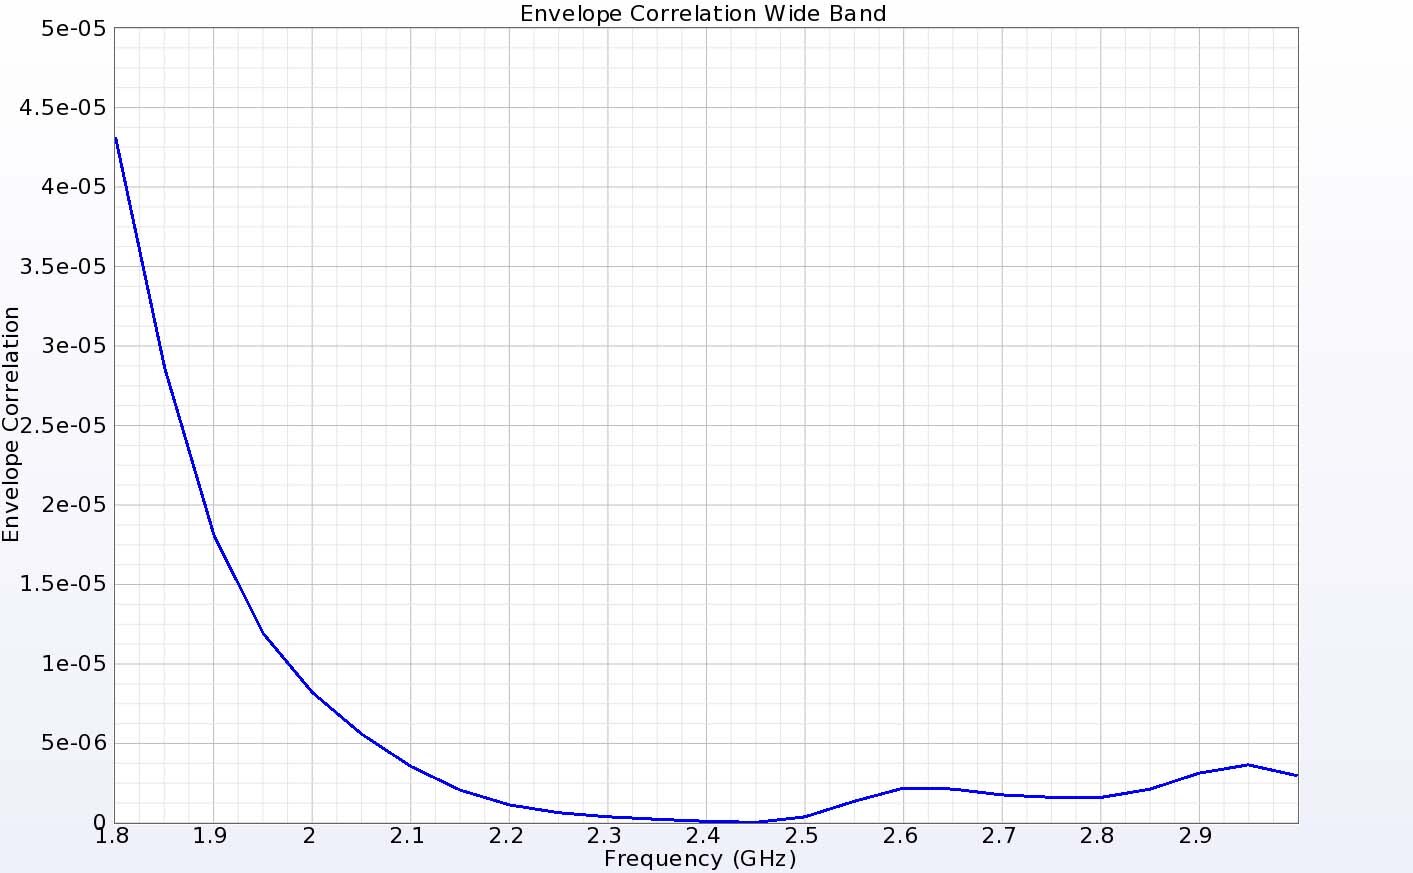
Figure 20: The envelope correlation is extremely low, showing very good isolation between the gain patterns of the two antenna ports.
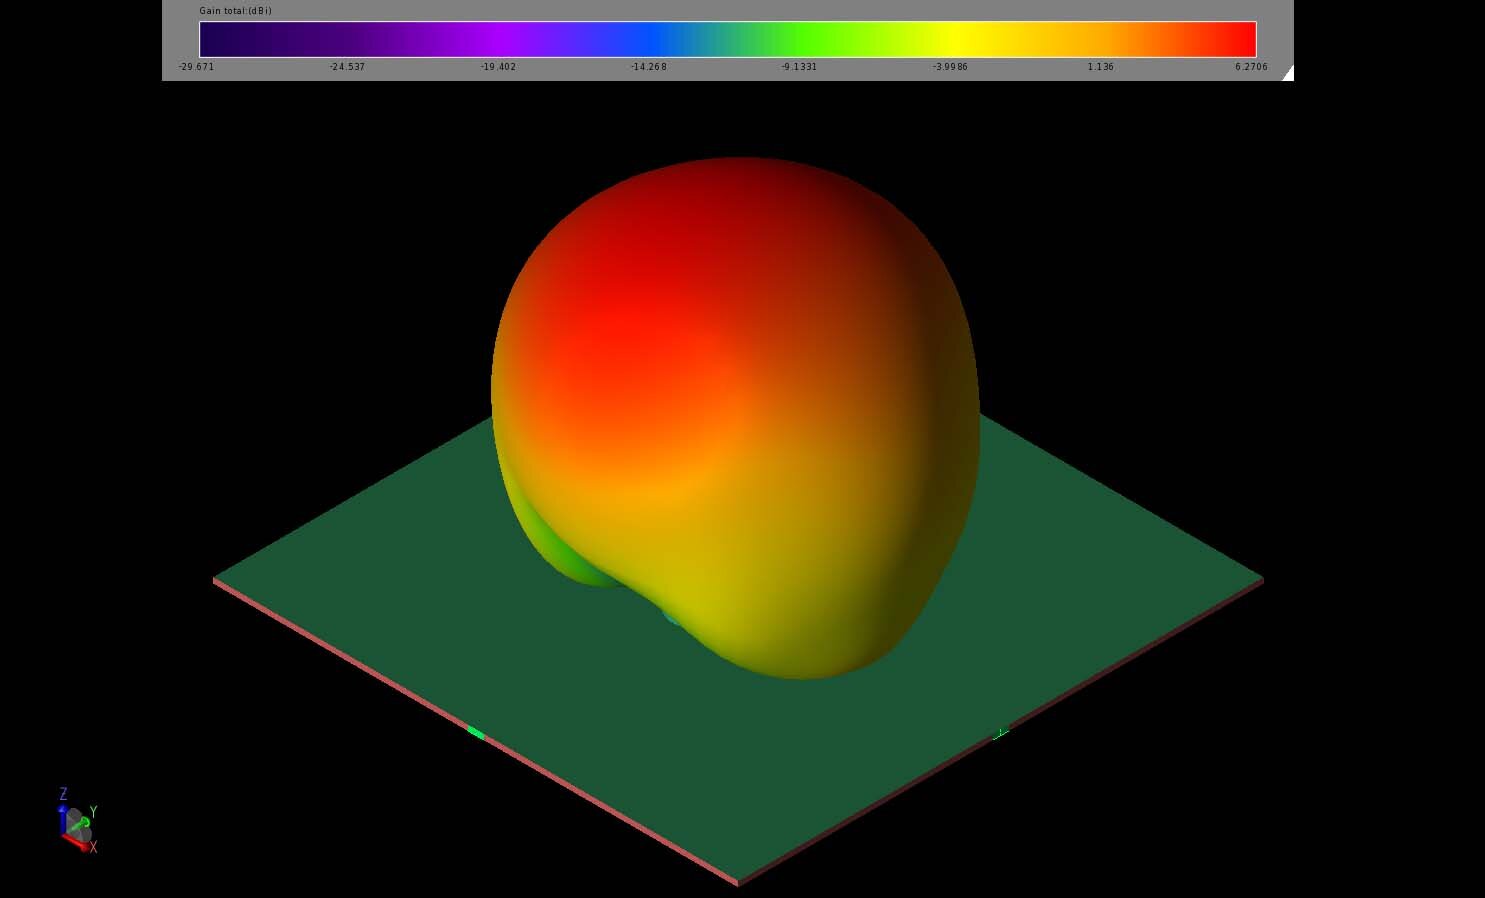
Figure 21: The three-dimensional gain pattern of the wideband antenna at 2.4 GHz is a broad lobe similar to that of the dual-band antenna.
Conclusion
Dielectric resonator antennas have several important characteristics such as low loss and high efficiency, which make them a good choice for some applications such as communications and WLAN. In this example, dual-band and wideband designs of dual-polarized antennas are shown to have good isolation between the ports and the radiation patterns, resulting in excellent performance.
Reference:
[1] Y. X. Sun and K. W. Leung, "Dual-Band and Wideband Dual-Polarized Cylindrical Dielectric Resonator Antennas," in IEEE Antennas and Wireless Propagation Letters, vol. 12, pp. 384-387, 2013, doi: 10.1109/LAWP.2013.2251993.