The IEEE Standard 1528-2003 [1] defines procedures for measuring the SAR generated by wireless devices and contains information regarding the calibration of the measurement system. Here the calibration approach is simulated in XFdtd and compared to the provided reference SAR values.
The subject under test is a flat phantom comprised of a plastic shell and a tissue-equivalent liquid. The phantom size varies with frequency, but is in general 0.6 by 0.4 wavelengths with a depth of 100 mm or more. The material parameters for the tissue equivalent liquid vary with frequency and are given in Table 2 of [1]. The plastic shell should have a relative permittivity less than 5 and a loss tangent less than 0.05. The plastic shell thickness is defined as 2 mm for frequencies in the 800-3000 MHz range and 6.3 mm for lower frequencies. The phantom is to be exposed to the fields of a reference dipole, Table G.1 of [1], which is spaced 15 mm from the shell/liquid interface for frequencies less than or equal to 1000 MHz and 10 mm from the interface for higher frequencies. The solid view of the geometry is shown in Figure 1 for the 900 MHz case.
For the XF simulations, all antenna elements were meshed using the XACT Accurate Cell Technology feature to precisely define the dimensions of the dipole and balun. The phantom was meshed in a cell size that varied from 1 to 3 mm depending on the excitation frequency, but all simulations used a high resolution volume in the region of the phantom directly above the feed point of the antenna.
The applied excitation was a voltage source with a sinusoidal input and the Local, 1 gram average, and 10 gram average SAR values were determined for the location directly above the feed of the dipole. All calculations were run until fields converged to a -35 dB level. Following the simulation, the input power was adjusted from the computed value to the specified 1 W. The simulation values are shown in Table 1 and compared to the reference values from Table 7 of [1]. Images of Local, 1 gram average, and 10 gram average SAR values in the first plane of the liquid (with the shell hidden) for the 900 MHz case are shown in Figures 2, 3, and 4, respectively.
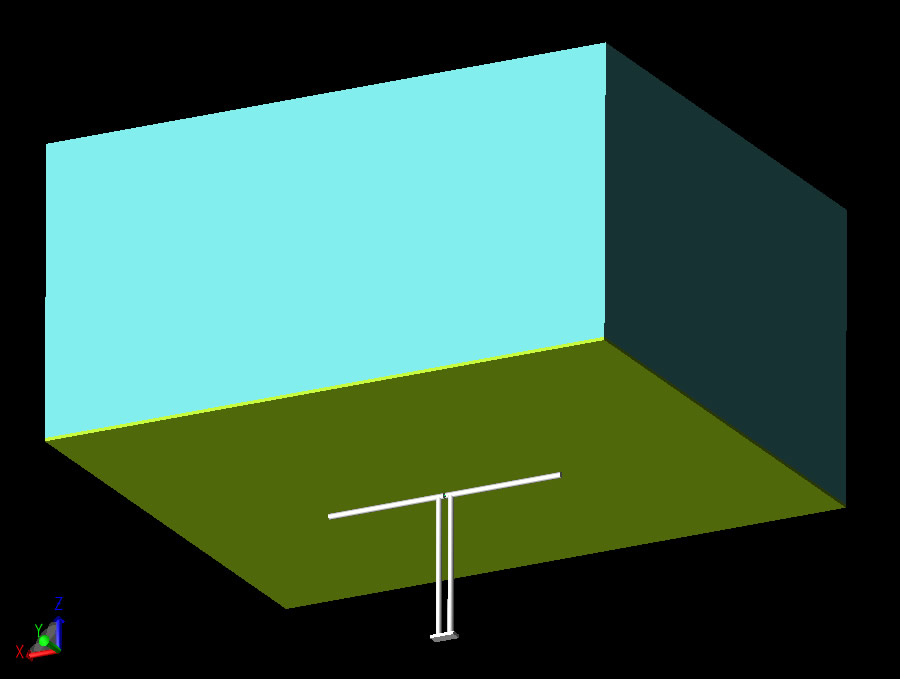
Figure 1: CAD representation of phantom and dipole for 900 MHz.
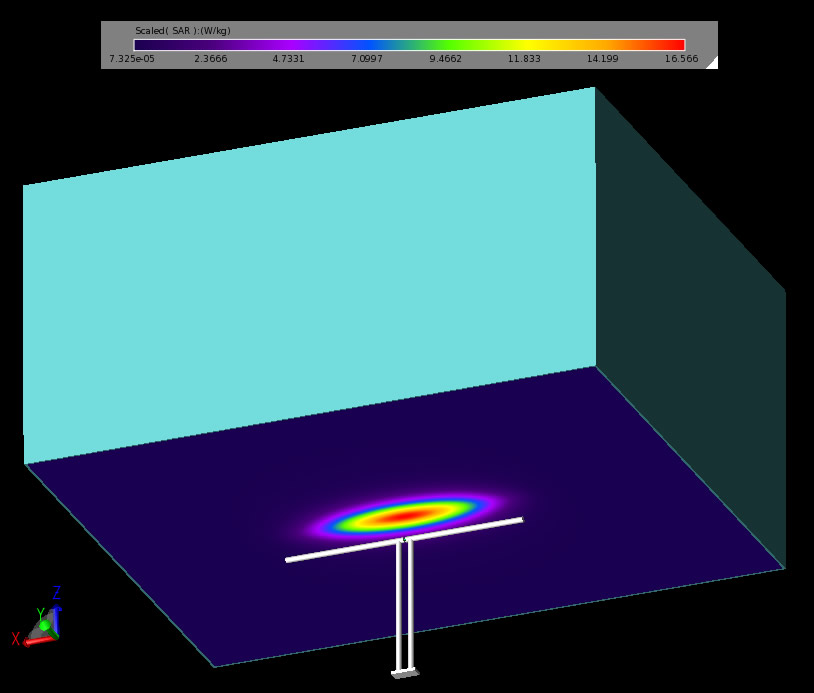
Figure 2: Local SAR values in the liquid for 900 MHz.
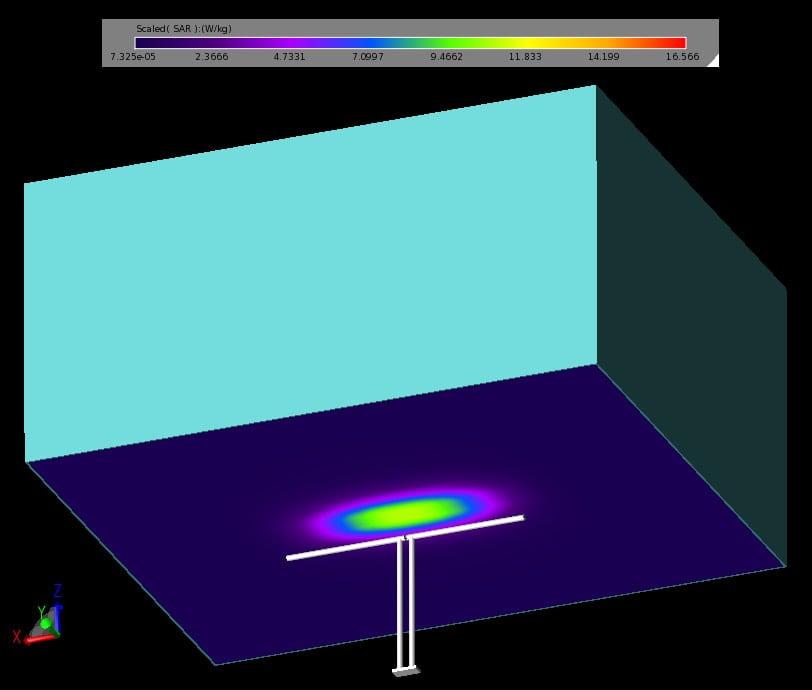
Figure 3: 1 gram average SAR values in the liquid for 900 MHz.
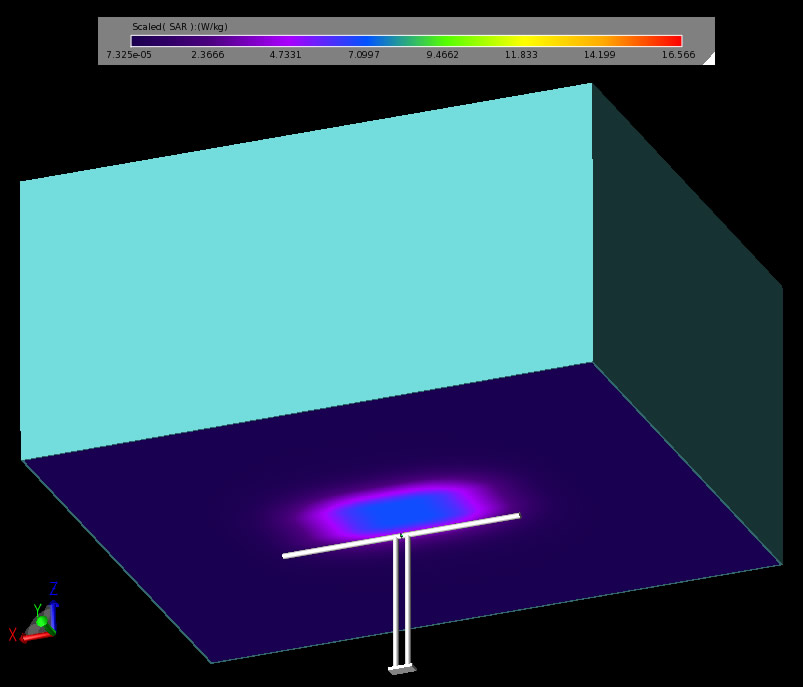
Figure 4: 10 gram average SAR values in the liquid for 900 MHz.
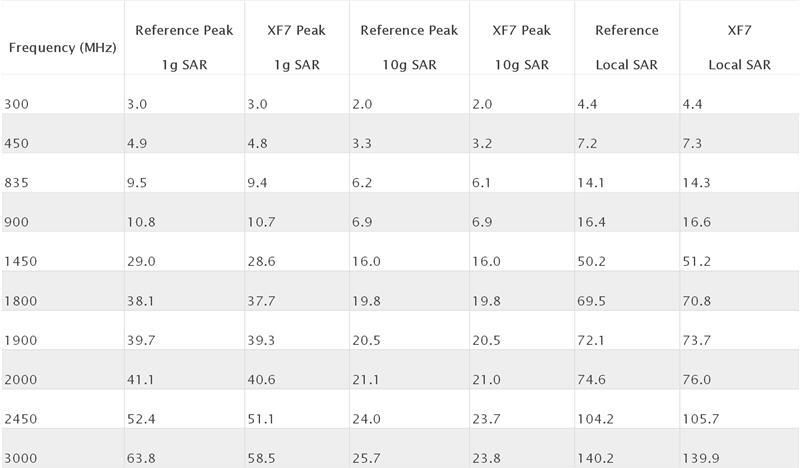
Table 1: SAR results for Flat Phantom.
Reference
-
IEEE. Std. 1528-2003. IEEE Recommended Practice for Determining the Peak Spatial-Average Specific Absorption Rate (SAR) in the Human Head from Wireless Communications Devices: Measurement Techniques. December 2003.