Introduction
In early March of 2020, the Federal Communications Commission (FCC) made 280 MHz of mid-band spectrum available for flexible use in the United States to address the critical need for unoccupied spectrum to deploy 5G wireless services [1]. Another portion of mid-band spectrum, that between 4.2 and 4.4 GHz, is reserved for use by radar altimeters operating on aircraft worldwide. Radar altimeters are critically important for navigation, particularly during low visibility instrument landing system (ILS) approaches to airport runways, and are relatively vulnerable to interference. By releasing the portion of bandwidth between 3.7 and 3.98 GHz for flexible usage, the FCC ensured a 220 MHz guard band interval would exist between future 5G emissions and the radar altimeter spectrum. Though the FCC had determined the 220 MHz guard band sufficient to ameliorate 5G radar altimeter interference, a study prepared by the Radio Technical Commission for Aeronautics (RTCA, Inc.), using empirical data for radar altimeters representative of models currently deployed on civilian aircraft [1], concluded that their results “reveal a major risk that 5G telecommunications systems in the 3.7–3.98 GHz band will cause harmful interference to radar altimeters on all types of civil aircraft” [2]. While the wireless communication industry and the companies (AT&T and Verizon) who won the auction for the released spectrum have taken issue with certain methodologies and conclusions of the RTCA study [3, 4], all interested parties brokered an agreement in early January 2022 to temporarily restrict and/or limit emissions of 5G base stations in buffer zones around 50 designated US airports (see Figure 1) to provide time to resolve outstanding issues with radar altimeter equipment [5, 6].
 Figure 1. Restriction zones for 5G emissions around US airports in place until July 5, 2022.
Those restrictions are scheduled to end on July 5, 2022. However, as US Department of Transportation Secretary Pete Buttigieg told the Senate Appropriations Committee in late April 2022, the long-term technological fix of retrofitting/replacing radar altimeters [7] in the entire US fleet “won’t be completely resolved by this summer” [8, 9].
1 Empirical data for representative radar altimeter models was provided to RTCA by Aerospace Vehicle Systems Institute (AVSI).
On June 17, 2022, the Federal Aviation Administration (FAA) announced that Verizon and AT&T have voluntarily agreed to delay some C-Band 5G usage until July 2023 to allow the process of retrofitting airplanes to complete [10]. Nevertheless, Verizon noted that the agreement will allow the wireless carriers to “lift the voluntary limitations on our 5G network deployment around airports in a staged approach over the coming months” [11]. There is therefore a need in the coming months to accurately determine the degree to which 5G interference with legacy radar altimeters poses a risk for landing approaches around US airports on a site-specific basis so that 5G base stations within the formerly restricted zones can be turned on while simultaneously ensuring safety.

Description of Study
Radar Altimeter Interference from Fundamental and/or Spurious 5G Emissions
Interference between 5G emissions and radar altimeters can occur by one of two means (see Figure 3). (1) 5G fundamental emissions (in the 3.7 – 3.98 GHz band) could overcome the pass-band filter in the altimeter receiver (green dashed line in Figure 3) resulting in saturation of the front-end amplifier. (2) 5G spurious emissions landing within the 4.2 – 4.4 GHz band directly can potentially cause erroneous altimeter readings or failure to return a reading. As radar altimeters are used for instrument landing in low visibility conditions, such interference could potentially have devastating consequences.
 Figure 3. Mid-band spectrum allocation and potential for 5G radar altimeter interference.
Interference Tolerance Masks as Determined by AVSI
To evaluate what constitutes a potentially hazardous level of received power at the radar altimeter, the RTCA study relied on Interference Tolerance Masks (ITMs) provided by AVSI which were based on empirical data and scenario assumptions to set up the test environment. The ITMs are meant to identify an interference threshold specified in terms of power spectral density (PSD) as measured at the radar altimeter’s receiver above which interference from 5G emissions become hazardous. As the signal returned to the altimeter becomes stronger as the aircraft approaches the ground, the interference threshold level increases accordingly. Thus, the interference tolerance mask is a function of altitude as well as frequency.
As described in the RTCA report [2], the ITMs were based on empirical tests of nine radar altimeter models from five different manufacturers but were also based on theoretical calculations and environment assumptions to set up the parameters used for those tests. Assumptions incorporated into the test setup include worst case estimates of the reflection properties of the terrain, the fact that the airplane might be in a steep bank which reduces the operational gain of the altimeter’s antenna, and the potential presence of other radar altimeters on the same aircraft or taxiing aircraft on the runway which contribute interference within the radar altimeter band. Given these estimates and for a given test altitude, a suitable attenuation factor, phase delay, and background interference level was applied to the signal generated by a given radar altimeter model’s output port before feeding it back into the altimeter’s input port. The interference tolerance threshold for a given altimeter could then be determined by applying an additional interference signal of increasing amplitude, either at the 5G fundamental operating frequency or at the center of the radar altimeter band, until erroneous altimeter readings began being reported. This procedure allowed AVSI to perform “black box” testing of the nine altimeter models and avoid a detailed understanding of the internal operation of a given altimeter such as the design of the front-end pass band filter. The interference tolerance mask as a function of altitude and for a given frequency (either 3.85 GHz or 4.3 GHz – in the center of the 5G or radar altimeter band respectively) reported by AVSI is the worst case (i.e. lowest) threshold measured for the nine altimeters tested. Though AT&T and Verizon as well as the wireless industry more broadly have criticized certain assumptions used to generate these ITMs as being overly conservative [3, 4], we employ these ITMs to allow a direct comparison with the RTCA results which are the focus of the present study.
5G Base Station Antenna Gain Patterns for Fundamental and Spurious Emissions
Wireless industry experts advised the RTCA study working group that Active Antenna System (AAS) phased array technology as described in Ref. [13] would most likely be utilized for future 5G base stations to take advantage of capacity improvements obtainable with high-gain, dynamically steerable beams and spatial multiplexing. These industry experts also provided the working group with specific characteristics for the AAS base stations that would likely be deployed in various environments.
For the work on the ILS approach landing scenario, an AAS phase array antenna appropriate for an urban environment was assumed. In this case, the AAS consists of a 16 x 16 rectangular grid of antenna elements with a horizontal spacing given by 0.5 λ and a vertical spacing given by 0.7 λ where λ is the wavelength of the 5G fundamental emissions (e.g., corresponding to 3.85 GHz). Mathematical formulas for the element gain pattern are provided in Ref. [13]. The parameters used for this study specify an element gain of 6.4 dBi, an element horizontal 3 dB beamwidth of 90 degrees, an element vertical 3 dB beamwidth of 65 degrees and a front to back gain ratio of 30 dB. The gain pattern attained with the 16x16 rectangular grid of elements is given by the standard expression for the gain factor for uniform rectangular arrays found in Ref. [14] which is reproduced in Ref. [13]. The maximum array gain factor is 24.08 dBi achieved for a broadside fired array with 0° of electronic up/down-tilt. When combined with the element gain, this gives a total phased array antenna gain of 30.5 dBi.
The maximum conducted power per element is assumed to be 25 dBm, giving a total output power for the 256 element array of 49.1 dBm. When combined with peak phased array antenna gain, the maximum equivalent isotropically radiated power (EIRP) is 79.6 dBm. This power is assumed to be uniformly distributed across a 100 MHz downlink bandwidth giving a peak output power spectral density (PSD) for the EIRP of 59.6 dBm/MHz. This is consistent with, and modestly below, the maximum allowable EIRP within the 3.7 – 3.98 GHz band permitted by the FCC order which specifies a maximum PSD for radiated emissions within the licensed band to 62 dBm/MHz for non-rural environments [1]. Also, for the simulations of the ILS landing approach scenario described below, the power is further derated by 3dB to represent the estimated 50% activity factor for downlink communications from the base station. The parameters for the AAS array as described above are summarized in Table 1.
 Table 1. 5G Base Station Characteristics for a 16x16AAS Array
It is assumed that the phased array can be electronically scanned in the vertical direction from a down-tilt of 20° relative to the boresight of the broadside fired array to having an uptilt of up to 10°. When combined with an assumed mechanical down-tilt of 10°, the beam can be scanned in the vertical direction from 30° below horizontal to being perfectly horizontal. The antenna gain pattern for fundamental emissions of a 5G base station is shown in the left panel of Figure 4. For the gain pattern shown, a maximum electronic down-tilt of 20° in addition to a mechanical down-tilt of 10° degrees is assumed. The gain pattern and associated rectangular array of antenna elements are shown as rendered in Remcom’s Wireless InSite ® propagation tool [15] which is used in the context of this article to model propagation in an outdoor urban environment including reflections off terrain and reflections and diffractions off building structures. The phased array 5G base station shown is surrounded by roadways and building structures imported from OpenStreetMap for the geometry surrounding O’Hare International Airport. The rectangular array of elements, however, is shown at a greatly exaggerated scale so that the array is visible in the scene.
 Figure 4. Antenna gain pattern for fundamental (left) and spurious (right) emissions from 5G base stations.
The discussion above describes the gain pattern used for in-band emissions for the 5G base stations (i.e., at 3.85 GHz) where relative phases between elements are electronically adjusted so as to steer the 5G fundamental emission at 3.85 GHz in certain preferred directions. When considering spurious 5G emissions, which are out of band for the 5G base station but in-band for the radar altimeter (e.g., at ≈4.3 GHz), it is assumed that the relative phases between elements will no longer be suitably correlated to direct beams in preferred directions. Under the assumption of completely uncorrelated phases between elements, the expectation value for the phased array gain would simply average to 0 dB. Thus, in the case of spurious emissions, the phased array is assumed to provide no additional gain factor and the gain is simply that of the radiation pattern for a single element. As was done in the RTCA study, the present study therefore simply assumes that the radiation pattern for the AAS phased array when operating at spurious emission frequencies will be given by the antenna radiation pattern of a single element. Such a radiation pattern is shown in the right panel of Figure 4.
Regarding the magnitude of the PSD to use to simulate spurious emissions from a 5G base station at ≈4.3 GHz, the FCC order specifies that conducted emissions from a 5G base station should not exceed -13 dBm/MHz at frequencies above 3.98 GHz. However, since equipment emissions continue to roll off beyond 3.98 GHz, wireless industry experts recommended to the RTCA working group that a PSD reduced below -13 dBm/MHz would be appropriate for evaluating spurious emissions at 4.3 GHz. For the purposes of the study, RTCA chose to assume a PSD for conducted emissions of -20 dBm/MHz at a frequency of 4.3 GHz when evaluating interference from spurious emissions. To align the present study with the conditions assumed in the RTCA study, a PSD for conducted emissions of -20 dBm/MHz is used here as well.
Radar Altimeter Gain Patterns for RA In-Band and Out-of-Band Signals
To evaluate interference from both 5G fundamental emissions (≈3.85 GHz) and 5G spurious emissions (≈4.3 GHz), the gain pattern for representative antennas used on civilian aircraft is needed for both the in-band (≈4.3 GHz) and out-of-band (≈3.85 GHz) frequencies of the radar altimeter. As part of the RTCA study, the gain pattern for two representative antennas was measured at each of these frequencies and a smoothed average of the two measured patterns was reported and used for subsequent analysis in the study. The gain patterns appear in Figure 6-11 (for 3.85 GHz) and Figure 6-12 (for 4.3 GHz) of Ref. [2]. These gain patterns were digitized directly from Ref. [2] and used for the current study.
 Figure 5. Antenna gain patterns for out-of-band (left) and in-band (right) operation of radar altimeter.
The gain patterns for each of these frequencies as rendered in Wireless InSite are shown in Figure 5. The patterns are rendered at a typical placement of radar altimeters on Boeing 757 airliners. The rendered Boeing 757 geometry is for visualization only and is in no way involved with the radio propagation analyses performed in this study.
The maximum gain at 3.85 GHz is only 1.375 dBi as this is an out-of-band frequency for the altimeter whereas the maximum gain at 4.3 GHz, the center of the radar altimeter band, is 9.397 dBi.
Overview of ILS Approach Flight Path and Presumed 5G Base Station Locations
The ILS landing approach scenario investigated in the RTCA report considered an aircraft landing on runway 27L at O’Hare International Airport (ORD) in Chicago, Illinois. The location of the runway threshold is at a latitude of 41°59’02” N, a longitude of 87°53’21” W and an altitude of 654 feet above mean sea level (MSL). The assumed flight path is based on the official ILS Cat II/III approach plate for runway 27L which specifies a glide slope of 3°, a heading due west, and a touchdown 1040’ (317 meters) beyond the runway threshold. To simulate a realistic 5G interference scenario prior to the existence of 5G base station deployments, the RTCA report chose to identify existing 4G LTE (Long Term Evolution) base stations near to the flight path and assume that future 5G base stations would be mounted to these same cell towers. The RTCA report identified 5 such base stations shown in Table 2, the locations of which have been verified using the FCC Antenna Structure Registration (ASR) Search Tool [16]. These cell towers are also visible in Google Earth [17] imagery which was used in the present study to slightly adjust the tower locations to precisely locate them relative to building structures.
 Table 2. Locations assumed for 5G base stations near flight path.
The flight path used for the RTCA study, and the present study, is shown in Figure 6 as rendered in Wireless InSite. The flight path is indicated by the red squares which plot locations of the radar altimeters at equally spaced points along the flight path. A portion of the O’Hare International Airport is observed at the left edge of the rendering and the flight path is seen to terminate on runway 27L.
 Figure 6. Overview of ILS landing approach flight path and presumed location of 5G base stations.
The precise locations of the 5 base stations used in the study are indicated by small green squares which are labeled by the FCC registration number in orange text nearby. The vast majority of the geometry for building structures, roadways, foliage and water features were obtained from OpenStreetMap [12]. A small number of residential building structures in the vicinity of the flight path were missing from OpenStreetMap. These buildings were filled in with appropriate residential structures based on viewing the residential areas in Google Earth [17]. It should be noted however that the addition of these buildings did not significantly affect the primary conclusions of the study.
Results of Study
Reproduction of ILS Approach Scenario Results from the RTCA Report
In contrast to the study described later which uses Wireless InSite to model radio wave propagation in an outdoor urban environment using the terrain, foliage, water feature, and building structure geometry shown in Figure 6, the RTCA study of the ILS landing approach scenario only considered line-of-sight propagation between the 5G base station and the radar altimeter. To ensure that we could reproduce results of the RTCA report within Wireless InSite, we performed the simulation with identical locations of all base station antennas and radar altimeter receiver route waypoints but with geometry features representing terrain, building structures, etc. de-activated. This ensured that only line-of-sight propagation between the base stations and the radar altimeter would be included in this initial simulation. By demonstrating that we can reproduce the results of the RTCA study, we verify that subtle features of the antenna gain patterns and the relative locations of these antennas are correctly represented in Wireless InSite. Further, we establish a baseline from which changes that are due to interactions with terrain and building structures can be easily identified.
To reproduce the interference results of the RTCA report, it was clearly important to have the geometric placement of antennas closely match that used for the report as well as faithfully implement the precise antenna gain patterns and specified power levels as they were defined in the report. However, two further insights were also critical to reproducing the results. First, the polarization assumed for the radar altimeter antenna was not constant at each waypoint along the flight path but instead was chosen to exactly match that of the incident line-of-sight radiation field from the 5G base station. This ensured that the worst-case scenario was being accounted for at each point along the flight path. Second, the azimuthal orientation of the base station was chosen to yield the highest received power at the radar altimeter antenna. Here again, this ensures a worst-case scenario assessment and accounts for the fact that the azimuthal orientation of the AAS array of a future 5G base station mounted on this cell tower is not known, as well as the fact that the AAS array allows for electronic azimuthal steering of the 5G emissions at arbitrary angles covering a sector. By implementing both assumptions within the Wireless InSite simulation, results which very closely approximate those reported in the RTCA study are readily achieved.
 Figure 7. 5G fundamental emission interference simulated in Wireless InSite for line-of-sight propagation only.
Figure 7 shows the result of the Wireless InSite simulation which calculates the power spectral density of the 5G fundamental emissions as measured by the radar altimeter’s antenna as a function of altitude of the landing aircraft. The received power spectral density is shown as color-coded traces for each of the 5 base station locations. The case shown considers a landing scenario where all the base stations have an electronic down-tilt of 20° corresponding to a total down-tilt (mechanical + electrical) of 30°. For comparison, the interference tolerance mask for the center of the 5G fundamental emissions band, and as a function of altimeter altitude, is shown as the solid black curve. The red shaded region extending below the ITM represents an additional 6 dB safety factor recommended in the ICAO Handbook on Spectrum Requirements for Civil Aviation. The ITM displayed in this figure was taken directly from the RTCA report since we cannot readily reproduce the empirical data collected by AVSI used to generate these curves. What has been independently reproduced in the Wireless InSite simulation is the power spectral density as measured at the radar altimeter receiver port. These PSD curves shown in Figure 7 nearly identically match those reported in Figure D-15 of the RTCA report. The very slight discrepancies between the two results may be due to minor differences in the geometrical positioning of the base station antennas and perhaps slight dissimilarities in the antenna gain pattern used for the radar altimeter antenna as this pattern was not defined mathematically but was reproduced by digitizing the gain pattern in the RTCA report publication. It is notable that, for this analysis, which only considers line-of-sight propagation, neither the ITM itself nor the associated 6 dB safety margin is exceeded.
 Figure 8. 5G spurious emissions interference simulated in Wireless InSite for line-of-sight propagation only.
In addition to simulating the interference due to 5G fundamental emissions from the various base stations, we also simulated the interference due to 5G spurious emissions from the same base stations. The results are shown in Figure 8 and very closely approximate the corresponding results obtained by RTCA which appear as Figure 10-34 in their report. Here again, neither the ITM nor the associated safety margin are exceeded for any point along the flight path.
Comparison of Results when Terrain and Building Structures are Added
In stark contrast with the RTCA study of the ILS approach landing scenario which only considered line-of-site propagation from base stations to the altimeter, use of sophisticated radio wave propagation tools such as Remcom’s Wireless InSite allow for high fidelity models of radio wave propagation in outdoor urban environments. Wireless InSite makes use of three-dimensional ray tracing to model propagation in outdoor environments and can account for ray paths that undergo multiple reflection and diffraction interactions with both terrain and building structures.
 Figure 9. 5G fundamental emissions interference with terrain and building structure interactions included.
For the ILS landing approach scenario considered here, Wireless InSite was used to model radio propagation in the presence of the geometry shown in Figure 6 using reasonable assumptions about material properties and considered ray paths with up to 4 reflections and 1 diffraction along the path. The material characteristics used for the terrain are based on the frequency dependent plots of electrical permittivity and conductivity as recommended by the International Telecommunications Union (ITU) in Ref. [18] for wet ground evaluated near the frequencies of interest for the study. The choice of wet rather than medium dry ground was made considering such conditions were appropriate for situations where an ILS CAT II/III approach is called for. To approximate realistic terrain, a rough surface reflection coefficient following Ref. [19] was used assuming a standard deviation in the surface height of 1 cm. The applied roughness correction modestly reduces the energy reflected in the specular direction to account for stochastic surface roughness. All building geometry, roadways, and runways were assumed to consist of concrete structures where the frequency dependent permittivity and conductivity is based on ITU recommended formulas for building materials presented in Ref. [20]. No surface roughness correction was assumed in this case as building structures can be considered relatively smooth at C-band wavelengths.
Figure 9 shows the power spectral density measured at the radar altimeter receiver port as a function of the aircraft’s altitude as predicted by Wireless InSite when terrain, building structures, foliage and water features are included. There are several notable changes in the results relative to the line-of-sight-only case shown in Figure 7. Foremost among these is the fact that the interfering PSD has increased significantly at a number of points along the flight path relative to the line-of-sight-only case. Indeed, at four locations along the flight path, interactions with the added features have increased the interfering PSD to the point where the ICAO recommended safety margin is exceeded. At two of these locations, due to interference from ASR 1280620 and ASR 1058071 which are both outside the restricted zones shown in Figure 1, the ICAO safety margin is barely violated by less than 1.2 dB. At two other locations on the flight path, however, due to 5G fundamental emissions from base station ASR 1256593 which is the only base station within the restricted zone shown in Figure 1, the interfering PSD approaches the ITM itself. This demonstrates the importance of using high fidelity radio propagation tools to model multipath when assessing 5G radar altimeter interference as interactions with terrain and building structures can redirect energy toward the radar altimeter antenna and yield higher interfering power levels than predicted by line-of-sight analysis alone.
 Figure 10. 5G spurious emissions interference with terrain and building structure interactions included.
In addition to the results for interference from 5G fundamental emissions, we also simulated radio propagation in the presence of terrain, building structures, etc. to predict the interference levels from 5G spurious emissions. The results are shown in Figure 10. There are notable differences between these results where interactions with terrain and building structures have been included and the results of Figure 8 which considers line-of-sight propagation only. Specifically, for certain locations along the flight path, the measured interference at the altimeter is modestly increased relative to the same point on the flight path shown in Figure 8. Also, throughout the data record the measured interference can be seen to fluctuate much more rapidly as a function of aircraft altitude. This fast fading is due to multipath being considered in the results of Figure 10. However, in contrast to the results for 5G fundamental emissions with beyond line-of-sight propagation included, there is no point along the flight path where the predicted interference from 5G spurious emissions increases above either the ICAO recommended safety margin or the ITM itself. These results continue to support the conclusion of the RTCA report that spurious emissions from 5G base stations do not pose a significant threat to radar altimeter operation for Usage Category 1 (commercial air transport aircraft) in contrast to 5G fundamental emissions.
Interactions with Terrain and Building Structures Yield Excessive Interference
The results from the previous section for 5G fundamental emissions indicated that the measured interference at the radar altimeter receiver can, along certain points of the flight path, increase significantly enough due to interactions with terrain, building structures, etc. that either the ICAO recommended safety margin is violated or the ITM itself (for Usage Category 1) aircraft is approached. In this section we examine in more detail the radio propagation conditions that exist at locations along the flight path where violations occur.
 Figure 11. Rendering of 20 highest-power ray paths at the point along the flight path where the 5G fundamental interference from base station ASR 1280620 reaches its peak.
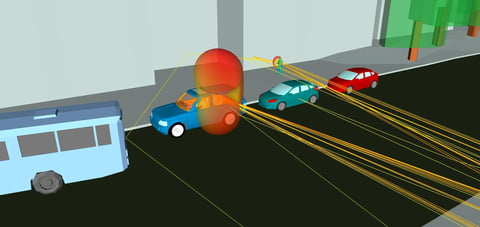
First, we consider the point of peak interference due to 5G fundamental interference from the ASR 1280620 base station which occurs when the approaching aircraft is 1429 feet above the ground level measured at the runway threshold (see peak of green trace in Figure 9). Figure 11 shows the conditions at this point with the azimuthal orientation of the base station adjusted for worst-case scenario conditions for interference. The rendering in Figure 11 shows the 20 highest power ray paths which contribute to the interference signal at the radar altimeter.
The main figure shows the entire ray path as it travels between the base station and the airplane altimeter. The inset shows an enlarged view of the ray path interactions near the base station which direct energy in the direction of the radar altimeter. Notably, there is an interaction with the terrain which contributes a higher received PSD than the line-of-sight propagation itself. In addition, there are numerous other ray paths that interact with both the ground and building structures or diffract directly off the building structures themselves which re-direct radiation toward the radar altimeter. These multiple paths coherently add together at the radar altimeter to yield the resulting measured PSD of interfering radiation.
This scenario provides a notable example of how including terrain and building structures and the associated radio wave interactions with these features in the propagation analysis can dramatically enhance the predicted level of interference. In this case, the predicted level of interference increased by 16 dB above that expected from line-of-sight propagation alone. For the scenario simulated, the primary increase results from interactions with terrain alone while interactions involving building geometry contribute to a much lesser extent. This situation could change significantly if detailed knowledge of building material composition was available and incorporated in the simulation. As noted above, all building structures were simply assumed to consist of concrete structures. If some of these structures were known to be composed of metal rather than concrete, the worst-case scenario for measured interference could increase substantially. Still, the scenario shown already indicates a substantial increase for predicted interference such that the ICAO recommended safety margin for Usage Category 1 aircraft is violated once beyond line-of-sight ray paths are considered.
As a second example highlighting the importance of including terrain and building structures and beyond line-of-sight propagation analysis, we consider the point along the flight path where the interference measured at the altimeter receiver reaches a maximum due to 5G fundamental emissions from base station ASR 1058071. This point occurs when the aircraft is at an altitude of 1398 feet above the ground level measured at the runway threshold (see peak of orange trace in Figure 9). In this case, the ray paths for the base station azimuthally oriented for the worst-case scenario are shown in Figure 12. Here again, the main figure shows the ray path trajectories all the way from the base station to the radar altimeter while the inset shows an enlarged view of the ray path interactions near the base station which re-direct energy toward the radar altimeter. Much like in the previous case, the predicted interference level has increased dramatically with the inclusion of terrain and building features and the associated radio wave interactions. Relative to the line-of-sight propagation analysis, the multi-path analysis predicts an increase in the interference level by just over 15 dB at this point on the flight path. Here again, the primary ray path responsible for this increase involves a single reflection from the terrain. However, it is clear from Figure 12 that other ray paths involving interactions with roadway and building structures contribute as well but at a much more modest level. As before, all building structures are assumed to be concrete for the purposes of this simulation as are the roadways. Here again, the increase in interference once beyond line-of-sight propagation is included is significant enough that the ICAO recommended safety margin for Usage Category 1 aircraft is violated.
 Figure 12. Rendering of 20 highest-power ray paths at the point along the flight path where the 5G fundamental interference from base station ASR 1058071 reaches its peak.
Finally, we consider in detail the situations at specific locations along the flight path where the ITM for Usage Category 1 aircraft is closely approached due to 5G fundamental emissions from base station ASR 1256593. This is the only base station in the study within the restricted 5G emission zone agreed to exist from January 2022 until July 5, 2022. The first interference maximum occurs when the aircraft is at an altitude of 319 feet above the ground level measured at the runway threshold (see first maximum reached along flight path for purple trace in Figure 9). The rendering of the ray paths for this case are shown in Figure 13. The main view shows the 20 highest power ray paths which contribute to the interference for the entire ray path from transmitter to receiver. The inset shows an enlarged view highlighting the most important interactions which redirect 5G radio waves toward the altimeter. At this particular location, the predicted interference level for the multi-path case is 26 dB larger than the interference level at the same location when only line-of-sight propagation is considered.
 Figure 13. Rendering of 20 highest-power ray paths at the point along the flight path where the 5G fundamental interference from base station ASR 1256593 reaches a local maximum.
This extremely large increase in the interference is due primarily to interactions with the terrain but also is due in part to a coincidence that the line-of-sight path lies along a local minimum of the 5G base station antenna gain pattern. Reflections and diffractions off the building structures surrounding base station ASR 1256593 contribute to a relatively small degree when compared to the prior two examples with interactions, with the terrain and roadways dominating the interference signal.
A second maximum in the interference due to base station ASR 125653 occurs along the flight path when the aircraft is 256 feet above the ground level measured at the runway threshold (see interference maximum nearest touch down of aircraft for purple trace in Figure 9). Again, the interference level closely approaches the ITM for Usage Category 1 aircraft at this location. The 20 highest power ray paths contributing to this interference signal are shown in Figure 14. As in the previous example, the dominant contributions to the interference signal are due to interactions with terrain and roadways, with interactions with building structures contributing to a much smaller degree. At this precise location along the flight path, the interference level predicted for the multi-path analysis exceeds the prediction for line-of-sight propagation only by 25 dB. Again, this large difference between the results is due to strong interactions with the terrain and roadways and to a much lesser extent building structures but is also coincidental in that the line-of-sight ray is along a local minimum of the 5G base station antenna gain pattern.
 Figure 14. Rendering of 20 highest-power ray paths at the point along the flight path where the 5G fundamental interference from base station ASR 1256593 reaches its peak.
Variations of Terrain Properties
Given that the most serious violations of the ICAO-recommended safety margin for the chosen scenario primarily result from interactions with the terrain, it is interesting to investigate the degree to which these results vary when different assumptions are made about the material properties of the terrain features. For the analysis above, the terrain was assumed to be described by wet earth since recent or ongoing precipitation is likely when an ILS CAT II/III landing approach is called for. Further, a realistic supposition about the terrain was made by also including a roughness correction factor assuming a standard deviation of surface height about the mean of 1 cm. This roughness correction acts to reduce the energy of the specular reflection off the terrain potentially reducing the amount of energy re-directed toward the radar altimeter.
 Figure 15. Variation of 5G fundamental emissions interference with terrain properties.
Given that it is appropriate to consider realistic worst-case scenarios when evaluating safety risks, it is of interest to consider the case where the terrain is described as smooth, wet earth as it would have a moderately higher reflection coefficient and could direct more energy from the 5G base stations to the radar altimeter. At the other end of the extreme, we could also consider the material properties of the terrain that might be expected on a typical day, namely rough, medium dry earth.
To this end, we have re-run the simulations above assuming that the terrain is described by a smooth wet earth material, where the surface roughness correction to the reflection coefficient is ignored, as well as by a rough, medium dry earth where the surface roughness is assumed to have a standard deviation of 1 cm in height as before but now the permittivity and conductivity are based on the ITU recommendation for that of medium dry soil [18]. The results are shown in Figure 15. Here, the blue trace summarizes the previous results assuming a rough, wet earth and the purple shaded region seen to occasionally extend outside the blue trace describes the extremes in the variation of the interference PSD when either the rough, medium dry earth or the smooth, wet earth surface materials are assumed to describe the terrain. At each point along the flight path, the largest interference from any one of the base stations is chosen to describe the interference PSD data point when constructing these traces. For the majority of the data, the variation of terrain material properties does not noticeably affect the results.
However, at a few locations along the flight path, and in particular those locations where the safety margin is violated due to a large contribution from reflections off the terrain, the interference PSD can be seen to extend above and sometimes somewhat below that of the blue trace. In particular, at the locations where the safety margin had only been barely violated due to interference from ASR 1280620 and ASR 1058071, the violation is more significant for the case where the terrain is described by a smooth, wet earth as the interference PSD has increased by approximately 3 dB at these locations. Furthermore, for the locations where the safety margin was significantly violated before due to interference from ASR 1256593, the interference PSD in the case of terrain described by smooth, wet soil has increased sufficiently that the ITM itself is now slightly violated. Thus, we see that it can be important to include variations of material properties that incorporate realistic worst-case scenarios when evaluating potential interference sources. For this scenario, a modest change in assumptions about the surface material for the terrain resulted in a 3 dB increase in the interference for points along the flight path where terrain reflections directed significant energy toward the radar altimeter.
Concluding Remarks
In this article we have re-analyzed the ILS Cat II/III landing approach scenario that was considered in the RTCA study on 5G radar altimeter interference. In contrast to the RTCA analysis which only considered line-of-sight propagation for the landing scenario, the simulations described here include multi-path propagation of radio waves and scatter off terrain and building structures. We demonstrated that the inclusion of such multi-path analysis in assessing 5G radar altimeter interference levels is crucial as interference levels were observed to increase substantially for certain locations along the flight path. At times the interference exceeded the ICAO safety margin and, depending on assumptions made about terrain material properties, either approached or even exceeded the interference tolerance mask published by RTCA/AVSI for Usage Category 1 aircraft.
Specifically, the ILS Cat II/III landing approach scenario for runway 27L of O’Hare International Airport was considered both here and in the RTCA report. For the present analysis, site-specific terrain, roadways, water features, and building structures surrounding the airport and beneath the flight path were imported into Wireless InSite, Remcom’s propagation tool, from OpenStreetMap geometry. This enabled the use of Wireless InSite to realistically estimate the magnitude of the power spectral density of 5G interfering signals reaching the radar altimeter receiver as the aircraft proceeded along its flight path. In agreement with the conclusions of the RTCA report, interference due to 5G spurious emissions were found to be below both the ITM for Usage Category 1 aircraft and its associated ICAO recommended safety margin. However, for the case when the 5G base stations along the flight path have a 20° electronic down-tilt (30° total, electronic + mechanical, down-tilt) the multi-path analysis performed with Wireless InSite indicates that the safety margin is exceeded and the ITM itself is closely approached for certain points along the flight path whereas the RTCA study reported no such violations as only line-of-sight propagation was considered for the landing scenario.
For the multi-path propagation analysis performed here, the safety margin was predicted to be violated due to emissions from a 5G base station mounted to a cell tower located outside of the 5G restricted emission zone that was agreed to be maintained around airport runways until July 5, 2022. Notably, the ITM itself was closely approached for a 5G base station mounted to a cell tower located inside the restricted zone. As mentioned above, the site-specific geometry used in making these predictions was imported from OpenStreetMap. Realistic assumptions about material composition for terrain, roadways, water features, foliage and building structures were applied to this geometry to carry out the simulations. However, even larger interference levels may result if other materials/more accurate geometries are used for specific features (e.g. metal instead of concrete building structures). Indeed, by making modest changes to assumptions about the terrain, namely modeling it as smooth rather than rough earth, the interference measured at the radar altimeter increased by approximately 3 dB at certain points along the flight path in the present scenario.
For best results, a detailed survey of building/feature geometry and material composition surrounding a deployed 5G base station should be performed on a site-specific basis along with multi-path ray tracing analysis in order to properly assess the interference levels potentially present at the radar altimeter receiver of landing aircraft. A more thorough analysis (beyond the single 20° electronic down-tilt case considered here) can be readily performed as soon as the mechanical orientation and electronic scanning capabilities of a particular 5G base station is specified either pre- or post-deployment.
The results presented above highlight the need for performing multi-path, site-specific analysis of radio wave propagation including multi-path effects in order to accurately assess the degree to which 5G fundamental emissions may interfere with radar altimeters. This analysis is especially important to allow the safe activation of 5G base stations in formerly restricted zones given that radar altimeters which are acutely susceptible to out-of-band interference remain deployed on aircraft at the beginning of summer 2022.
References
- FCC, “In the Matter of Expanding Flexible Use in the 3.7-4.2 GHz Band, GN Docket No. 18-12,” 3 March 2020. [Online]. Available: https://www.fcc.gov/document/fcc-expands-flexible-use-c-band-5g-0.
- RTCA, Inc., “Assessment of C-Band Mobile Telecommunications Interference Impact on Low Range Radar Altimeter Operations,” RTCA, Inc., Washington, DC, 2020.
- 5G Americas, “Mid-Band Spectrum and the Co-Existence with Radio Altimeters,” 5G Americas, Bellevue, WA, 2021.5G Americas, “Mid-Band Spectrum and the Co-Existence with Radio Altimeters,” 5G Americas, Bellevue, WA, 2021.
- CTIA, “CTIA Ex Parte Presentation, Expanding Flexible Use of the 3.7-4.2 GHz Band, GN Docket No. 18-122,” 3 September 2021. [Online]. Available: https://www.fcc.gov/ecfs/file/download/210903%20CTIA%20Ex%20Parte%20-%205G-Aviation%20Technical%20Annex.pdf?folder=109033106828089. [Accessed 9 6 2022].
- J. Stankey, H. Vestberg, J. Marsh and W. H. Johnson, “The Wall Street Journal,” 2 January 2022. [Online]. Available: https://s.wsj.net/public/resources/documents/ATT_Verizon_Letter.pdf. [Accessed 9 6 2022].
- P. Buttigieg and S. Dickson, “The Wall Street Journal,” 3 January 2022. [Online]. Available: https://www.faa.gov/sites/faa.gov/files/2022-01/USDOT%20Letter%20to%20ATT%20Verizon_20220103.pdf. [Accessed 9 6 2022].
- D. Shepardson, “FAA wants U.S. airlines to retrofit, replace radio altimeters,” [Online]. Available: https://www.reuters.com/business/aerospace-defense/faa-wants-us-airlines-retrofit-replace-radio-altimeters-2022-05-03/.
- United States Senate Committee on Appropriations, “United States Senate Committee on Appropriations,” 28 April 2022. [Online]. Available: https://www.appropriations.senate.gov/hearings/a-review-of-the-presidents-fy-2023-funding-request-and-budget-justification-for-the-us-department-of-transportation-. [Accessed 9 6 2022].
- M. Reardon, “CNET,” 29 April 2022. [Online]. Available: https://www.cnet.com/news/buttigieg-5gfaa-interference-issue-wont-be-resolved-by-summer/. [Accessed 9 6 2022].
- Federal Aviation Administration, “FAA Statements on 5G,” 17 June 2022. [Online]. Available: https://www.faa.gov/newsroom/faa-statements-5g. [Accessed 20 June 2022].
- D. Shepardson, “Verizon, AT&T agree to delay some 5G deployment until mid-2023,” Reuters, 17 June 2022. [Online]. Available: https://www.reuters.com/technology/verizon-att-agree-some-c-band-aviation-protections-until-mid-2023-2022-06-17. [Accessed 20 June 2022].
- OpenStreetMap Foundation, “OpenStreetMap,” [Online]. Available: https://www.openstreetmap.org/. [Accessed 20 June 2022].
- ITU-R M.2101-0, “Modelling and simulation of IMT networks and systems for use in sharing and compatibilty studies,” International Telecommunication Union, 2017. [Online]. Available: https://www.itu.int/rec/R-REC-M.2101/en.
- C. A. Balanis, Antenna Theory, Hoboken, NJ: John Wiley & Sons, Inc., 2016.
- Remcom Inc., Wireless InSite, 2022.
- FCC, “FCC Antenna Structure Registration (ASR) Search Tool.,” [Online]. Available: https://wireless2.fcc.gov/UlsApp/AsrSearch/asrRegistrationSearch.jsp. [Accessed 20 June 2022].
- Google, “Google Earth,” [Online]. Available: https://earth.google.com/. [Accessed 20 June 2022].
- ITU-R P.527-3, “Electrical characteristics of the surface of the earth,” International Telecommunications Union, 1992. [Online]. Available: https://www.itu.int/rec/R-REC-P.527-6-202109-I/en.
- L. Boithias, Radio Wave Propagation, New York: McGraw-Hill, 1987.
- ITU-R P.2040-1, “Effects of building materials and structures on radiowave propagation above about 100 MHz,” International Telecommunications Union, 2015. [Online]. Available: https://www.itu.int/rec/R-REC-P.2040/en.