- Products & Solutions
- WaveFarer
- Chirp Waveforms and Range-Doppler in Radar Simulations
Chirp Waveforms and Range-Doppler in Radar Simulations
Use WaveFarer linear chirp scripts and utilities to simulate radar systems using chirp waveforms, and post-process results to generate I&Q data, range-Doppler plots, and other useful outputs.
Chirp waveforms are commonly used in automotive radar and other sensor applications to provide the required information for calculating range and Doppler velocity of objects in a scene from the radar returns. An example is a frequency modulated continuous wave (FMCW) radar, which transmits a sequence of chirps within a frame as shown in Figure 1. The term chirp refers to the adjustment of frequency over a band. The diagram shows a sequence of linear chirps, generally referred to as a “sawtooth” pattern, where the frequency is adjusted from the lower end of the band to the upper end, and is then reset again to the lower frequency. In the image, the lower and upper frequencies are listed as f1 and f2, respectively, the duration of each chirp is T, and the reset time between chirps is Tr.
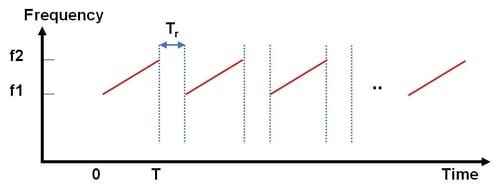
Figure 1: Sequence of linear chirps.
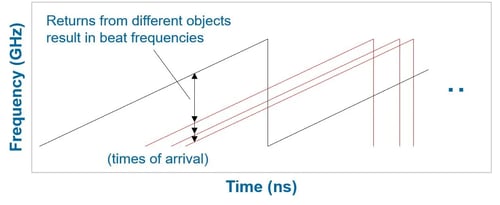
Figure 2: Beat frequencies are derived by mixing returns with transmitted chirp.
As copies of the chirp waveform interact with objects in a scene and return to the radar, the signal is mixed with the outgoing transmit signal, using it as a phase reference, and the offset creates beat frequencies that can be used to determine the range of the object by the radar simulation software. Figure 2 shows a diagrammatic representation of returning signals and the beat frequency that will be created by the offset that is created by the delay in the arrival of the return.
Each propagation path produces a mixed-down signal with its own amplitude, phase shift, and beat frequency. The total signal is a coherent sum of the contributions from all of these paths. The radar system generally separates this into in-phase and quadrature phase (I&Q) components, mathematically the real and imaginary components of the waveform. Figure 3 shows a high-level schematic diagram for the generation of I&Q and an example of an I&Q waveform.
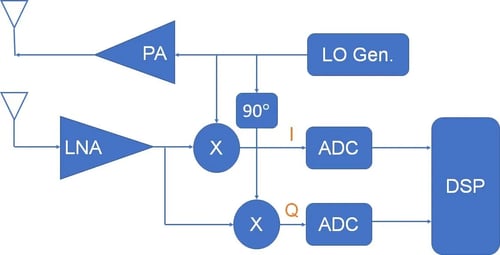
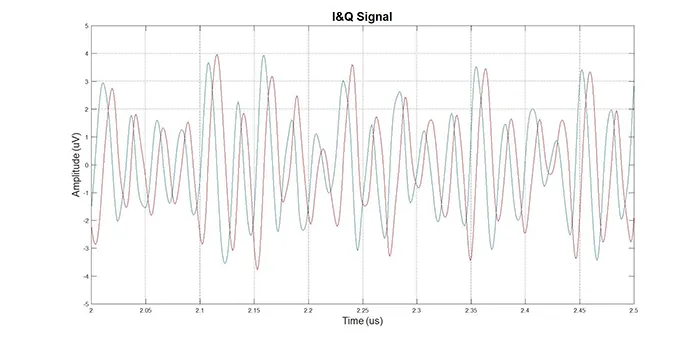
Figure 3: High-level system schematic and sample I&Q waveform.
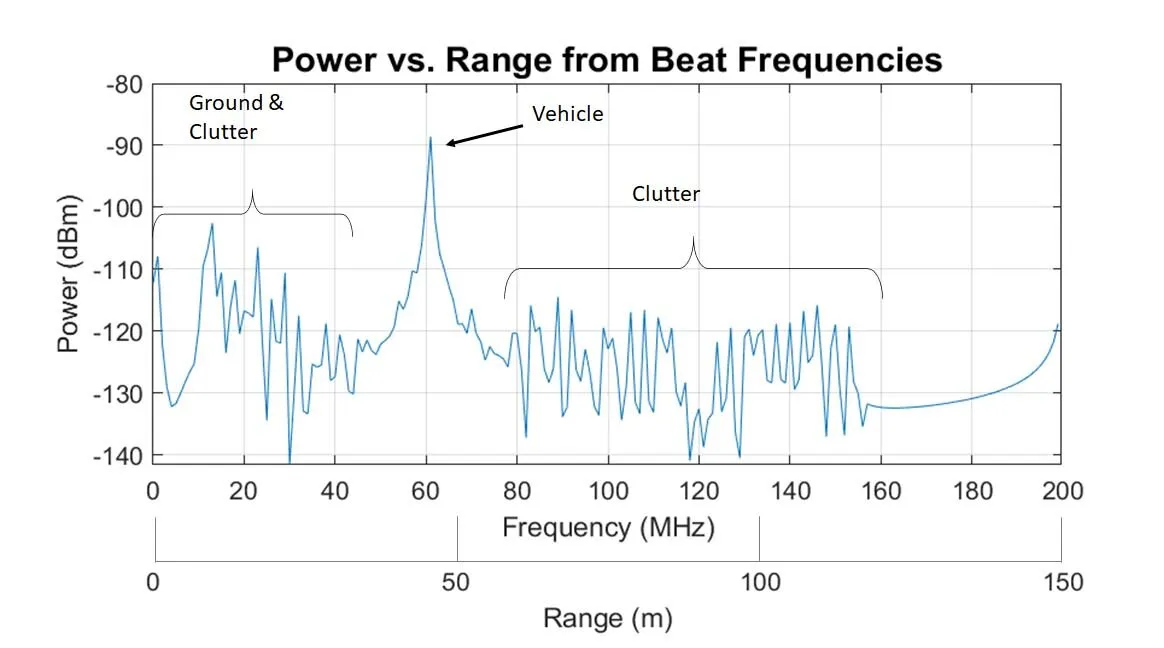
Figure 4: Power vs. range from beat frequencies.
The I&Q waveform can be processed with a discrete Fourier transform (DFT), giving a spectrum of power versus frequency (see our presentation "Using WaveFarer Automotive Radar Simulation Software and Chirp Doppler to Assess Radar Performance for Drive Scenarios"). This can then be converted to power spectral density versus range. A typical example is shown in Figure 4, with the x-axis showing both the frequency spectrum and the equivalent range for the processed returns.
When the objects in a scene are in motion, such as with a drive scenario, a second DFT can be applied to the sequence of chirps in each frame to calculate the Doppler frequency spectrum resulting from changes in phase that are caused by the continuous shortening or lengthening of paths that are interacting with those structures. The Doppler shifts can be converted to equivalent velocities to provide a range-Doppler map, showing magnitude of the return as a function of both range and velocity, described below.
WaveFarer Radar Post-Processing to Generate Range-Doppler
Along with WaveFarer 2.1, Remcom has released a package of scripts and utilities that can be used to extract path data from simulations. Once a user has defined parameters for the motion of vehicles, pedestrians, or other objects for a drive scenario or other radar or sensor application, these scripts can be executed to set up the simulation sets and post-process their results to generate a range of outputs.
The first script, CreateLinearChirpSimulation, sets up a series of snapshots in time, each of which will simulate a frame containing a sequence of chirps, as specified by the user. This will generate a series of simulation results that capture the propagation paths and unique interaction chain data that allow these paths to be mapped between the simulation points that bound each frame. The user specifies the following key parameters to define the chirp:
-
Snapshots in time for each frame that will be simulated
-
Chirp minimum and maximum frequencies
-
Chirp length and reset time
-
Number of chirps in each frame
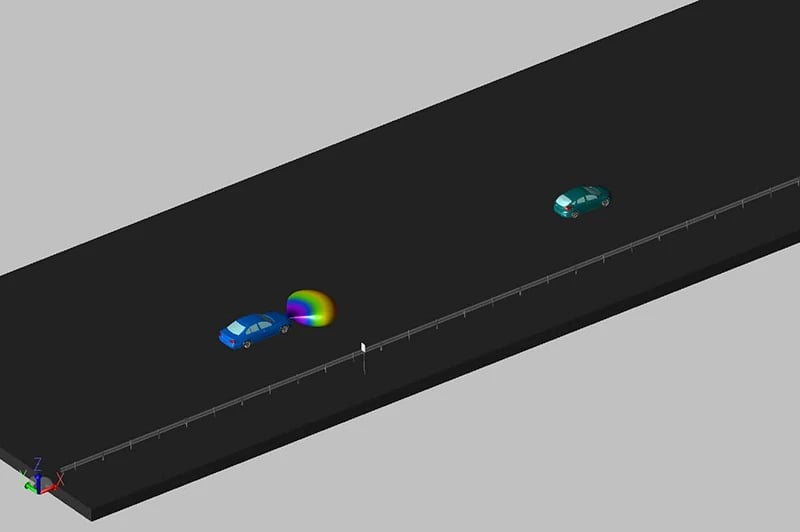
The script then creates and queues the required simulations for execution, moving vehicles, or other objects over a series of points in time that bound each requested frame, generating the required data needed for post-processing. Figure 5 shows a sample drive scenario that contains a moving vehicle with a radar, a lead vehicle, and stationary guard rails and a road sign. The radar is moving 20 meters per second while the target vehicle is moving 15 meters per second and braking at a rate of 4 meters per second squared. When the script is executed, it will move these vehicles to their relative positions at key points for each requested frame of chirps and run simulations, creating detailed path data to be used in later post-processing. A number of optimizations have been used to carefully map path data so that the number of required simulations can be minimized, providing a very efficient run time.
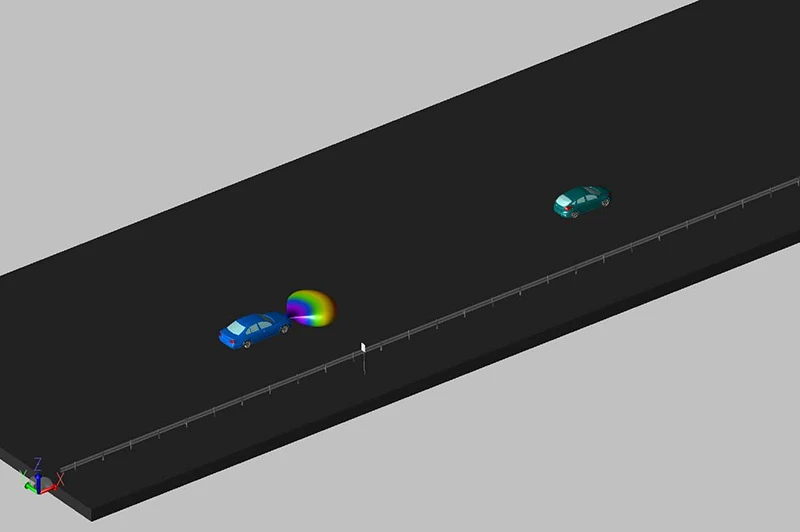
Figure 5: Drive scenario.
Next, the GenerateRangeDoppler script post-processes the simulation results to generate a variety of additional outputs. The user specifies a sensor or sensor array that will be analyzed as well as the chirp sampling parameters, such as the number of samples and the sample spacing within each chirp. This then uses a combination of utilities to extract path data, carefully mapped between points in time that bound each frame, and processes these mapped path returns to calculate the impulse response and I&Q at the specified sample points across all of the chirps in each requested frame. From these results, it generates the following types of outputs:
-
Power spectral density vs. range for the first chirp in each frame
-
Power spectral density vs. range and Doppler velocity for each frame
-
Complex impulse response at the midpoint of each chirp
-
S-parameters vs. frequency at the midpoint of each chirp
-
I&Q waveform at user-specified sample points for each chirp
Figure 6 shows the power spectral density as a function of. range for two snapshots, showing a clear return from the target vehicle as the radar is closing on it, as well as a large number of secondary returns coming from the guard rail posts, which act as corner reflectors. Figure 7 shows the range Doppler for these same two snapshots, showing both the reduction in range and change in velocity due to the vehicle’s braking.
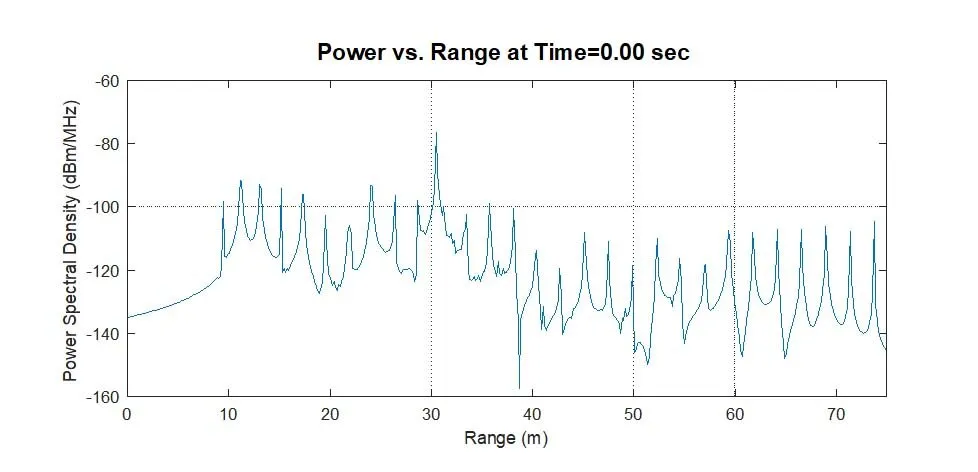
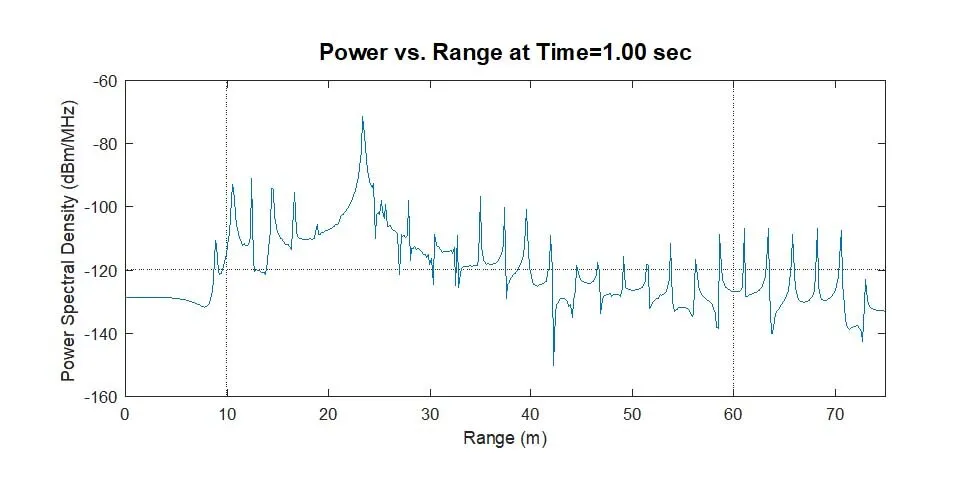
Figure 6: Power spectral density vs. range from first chirp in each frame.
In addition to the range-Doppler plots, the script also optionally generates and exports the complex impulse response, S-parameters, and I&Q waveform for every chirp of every frame.
Representative plots are generated for the first chirp of each frame. Examples of the complex impulse response and S-parameter plots are shown in Figure 8; a sample I&Q plot was presented above in Figure 3.
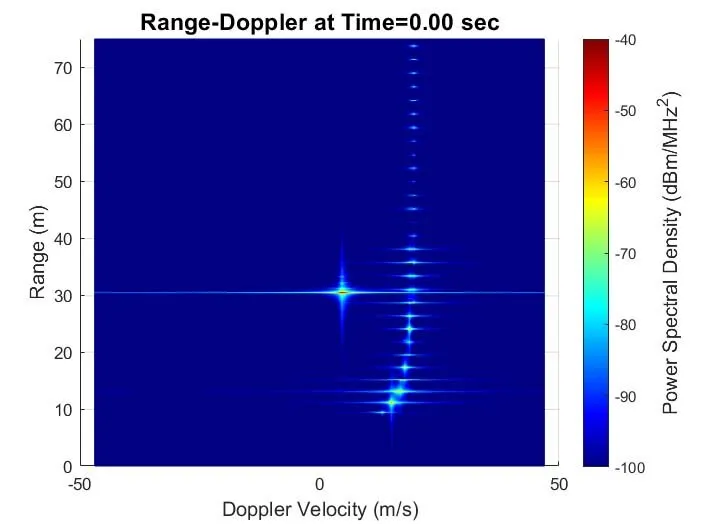
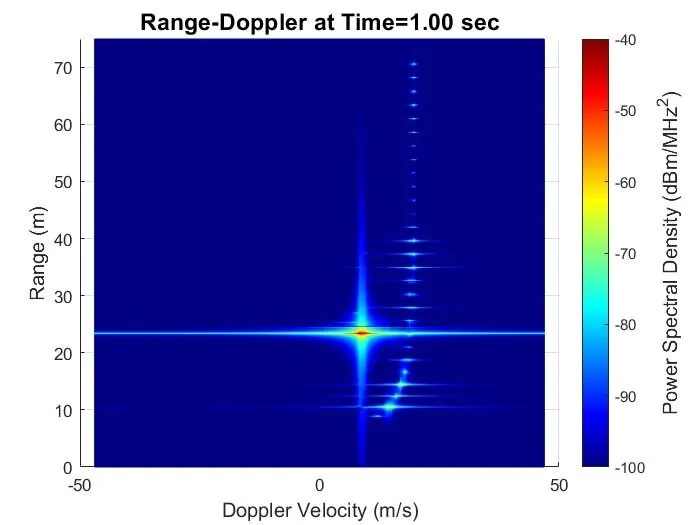
Figure 7: Range-Doppler for frames at two snapshots in time.
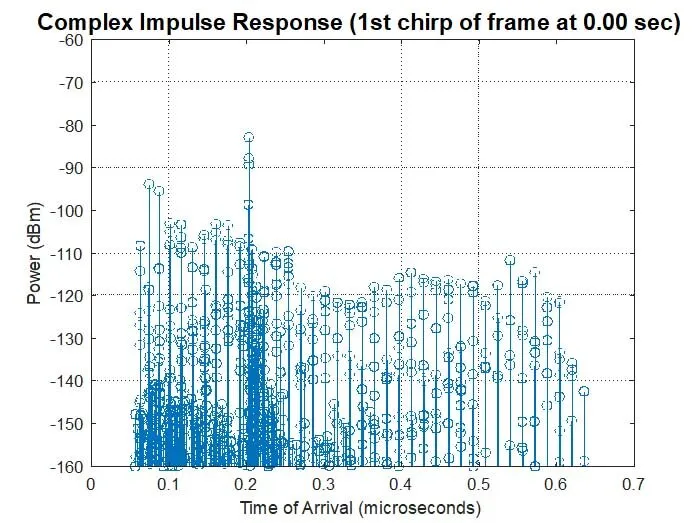
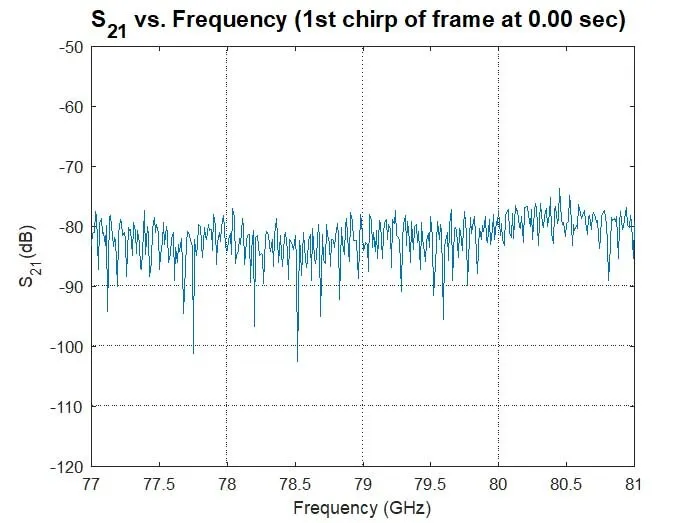
Figure 8: Complex Impulse Response and S21 for the first chirp in the above example.
For More Information:
Return to the WaveFarer main product page to explore more about the software's features and technology for fast and accurate analysis of repeatable drive test scenarios.
Save time and reduce costs.
Contact Remcom today for a customized solution to your most complex electromagnetic challenges.
Request a Quote