Antenna Coupling Simulation for Aircraft Circular Patch Antennas
This example analyzes the coupling between four circular patch antennas mounted on the sides of a Boeing 757. The antennas transmit and receive at a frequency of 2.4 GHz. Coupling between each antenna is characterized using XGtd’s S-Parameter output, which can be displayed in the user interface or exported to a v1.1 Touchstone file.
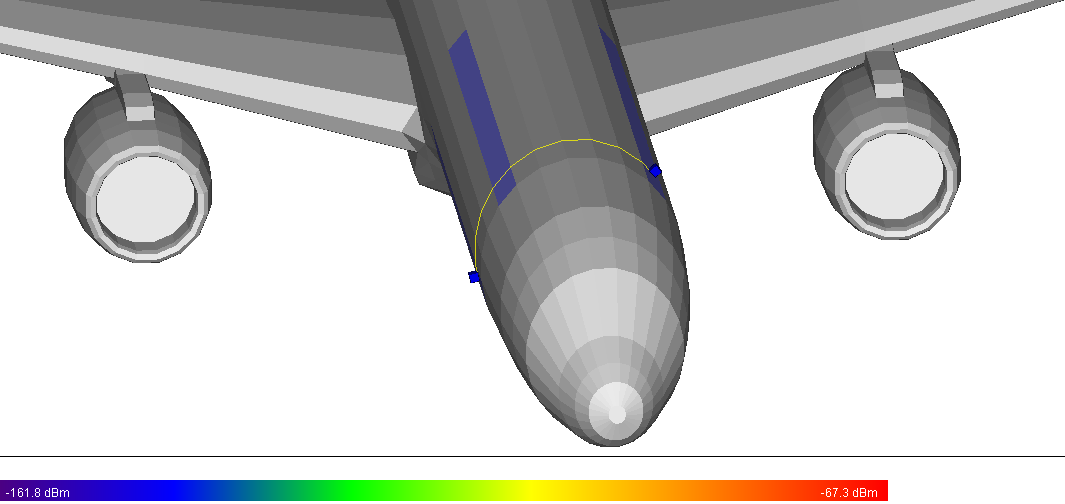
The Boeing 757 geometry consists of 1,096 faces, assigned perfect electrical conductor material properties. Figure 1 shows the airplane geometry with four facets colored blue to identify where the antennas will be mounted.
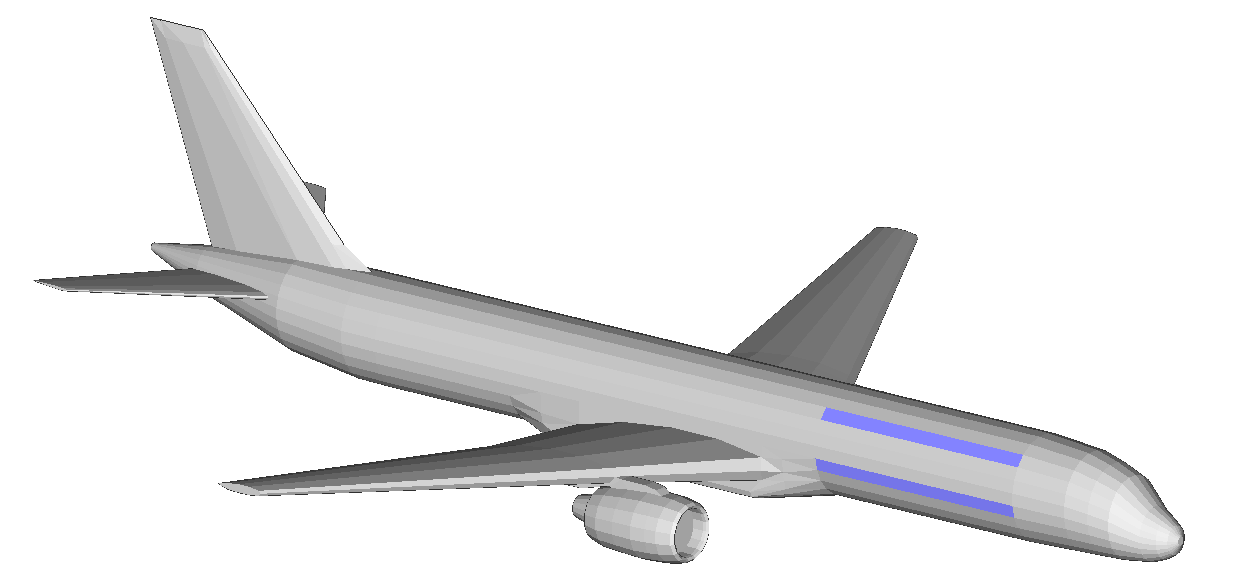
Figure 1: Boeing 757 geometry.
The simulations use the Full 3D model, with one reflection, no transmissions, two wedge diffractions, and 16 surface diffractions. The operating frequency of the antennas is 2.4 GHz and is modeled using the basic sinusoid option.
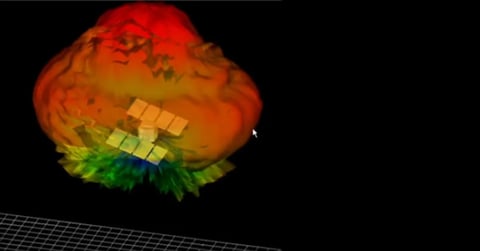
The antenna gain pattern at each of the four transceiver locations, defined by the built-in circular patch antenna, has a relative dielectric constant of 2.2, radius of 0.0226 m, height of 0.0032 m, and frequency of 2.4 GHz (Figure 2).
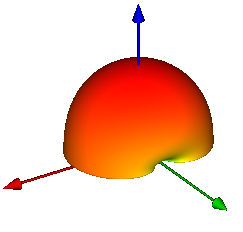
Figure 2: Circular Patch Antenna.
The circular patch antennas are mounted at four locations on the fuselage of the aircraft. They act as both transmitting and receiving antennas, so they can conveniently be modeled using a transceiver point. Transceivers are mounted on any facet of the geometry and are automatically oriented using the facet’s normal. The transceiver point can be graphically placed on the selected facet or, from the transceiver’s properties window, exact coordinates can be entered to locate the transceiver.
Figure 3 shows all four of the patch antennas placed on the aircraft, with the 3-D antenna patterns and control vectors visible.
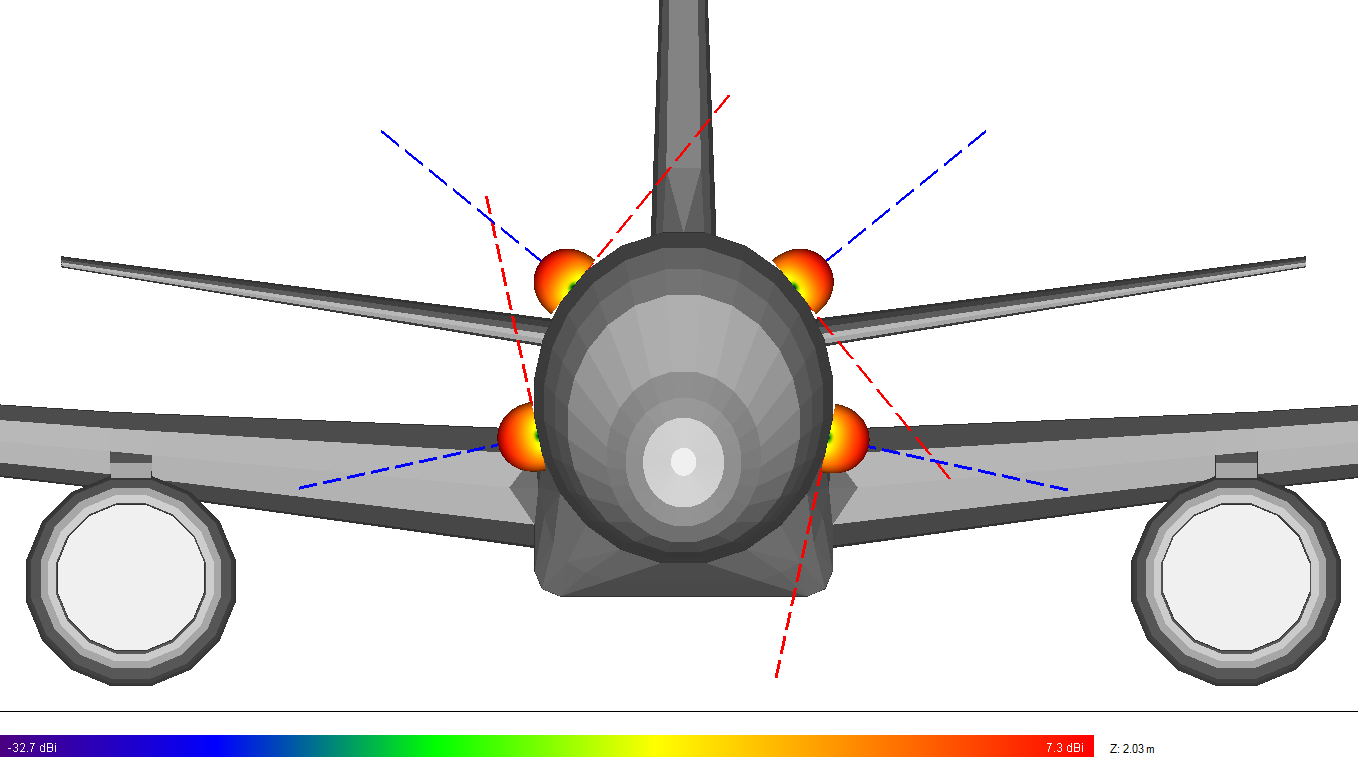
Figure 3: Transceivers on the 757 with antenna patterns and control vectors visible.
S-parameter output is accessible in three ways: as color-coded output viewable in the project view (Figure 4), numerically via the output file properties window (Figure 5), or by exporting the associated Touchstone file (Figure 6).
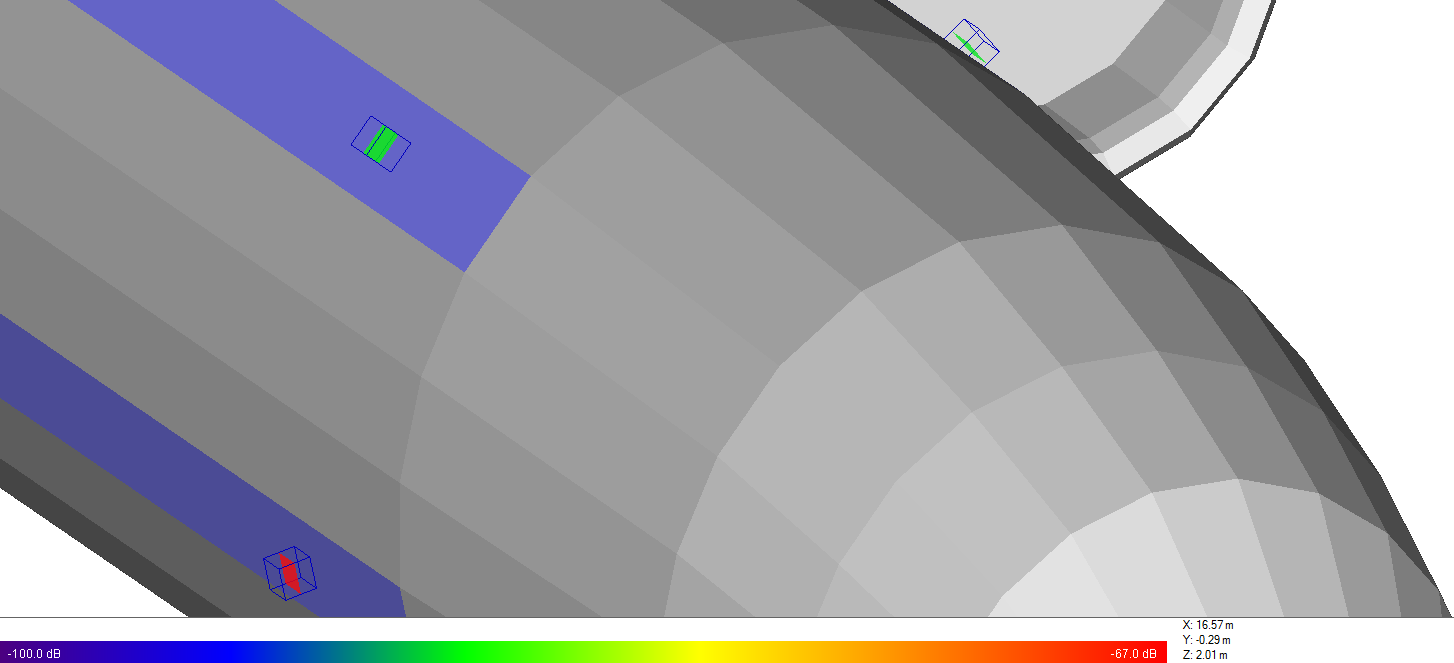
Figure 4: Color-coded S-Parameter display in the Project View.
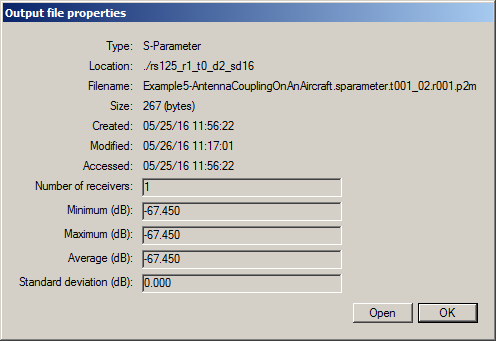
Figure 5: S-Parameter S21 – numerical value shown in the Output file properties window.
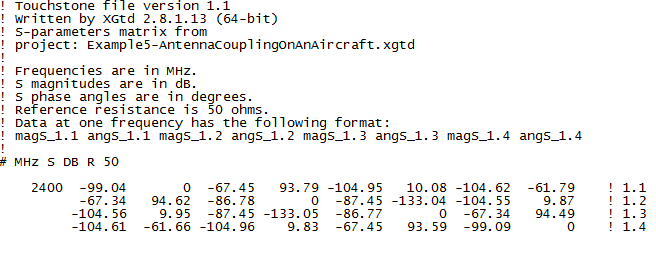
Figure 6: S-Parameter exported to a Touchstone file.
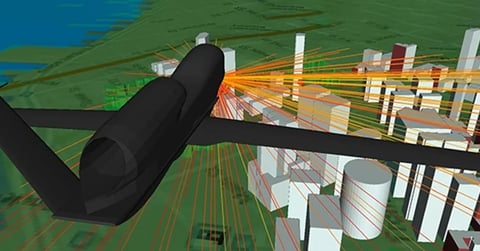
Viewing the ray paths from the calculation gives detailed information on the coupling between any two antennas mounted on the aircraft and can reveal what structures contribute to the coupling. For instance, the two main contributors to coupling between transceiver 1 and transceiver 2 are scattering from the right engine and the creeping wave contribution that travels along the surface of the aircraft fuselage as shown in Figure 7. There exists a similar set of paths on the left side of the aircraft, coupling transceivers 3 and 4. The S-Parameters for these locations are listed in Table 1:

Table 1: S-Parameter output between transceivers on the same side of the aircraft.
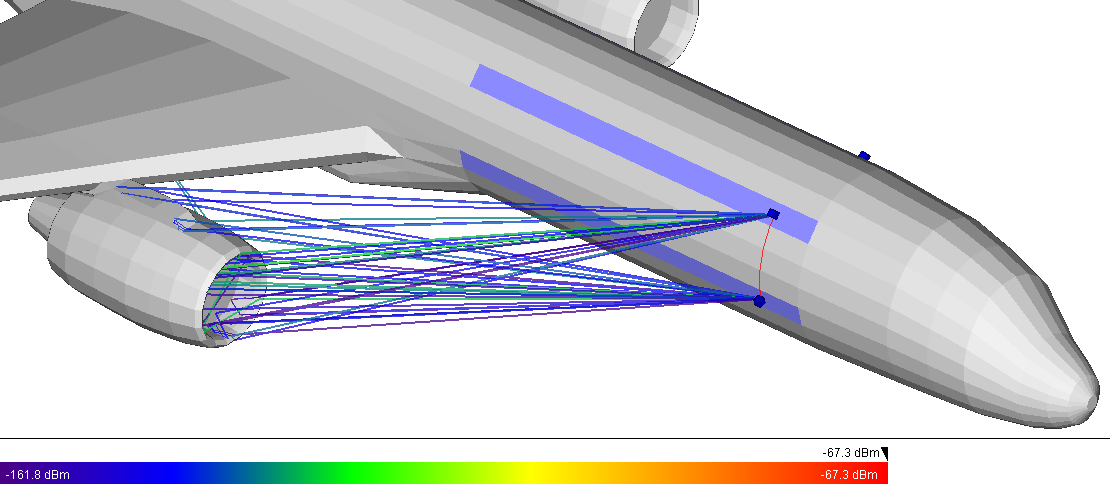
Figure 7: Ray paths between transceivers 1 and 2 (S12 & S21).
The coupling between transceivers 1 (lower right) and 4 (lower left), yielding S14 = -104.62 dB and S41 = -104.61 dB, is primarily via the creeping wave along the bottom of the aircraft as shown in Figure 8.
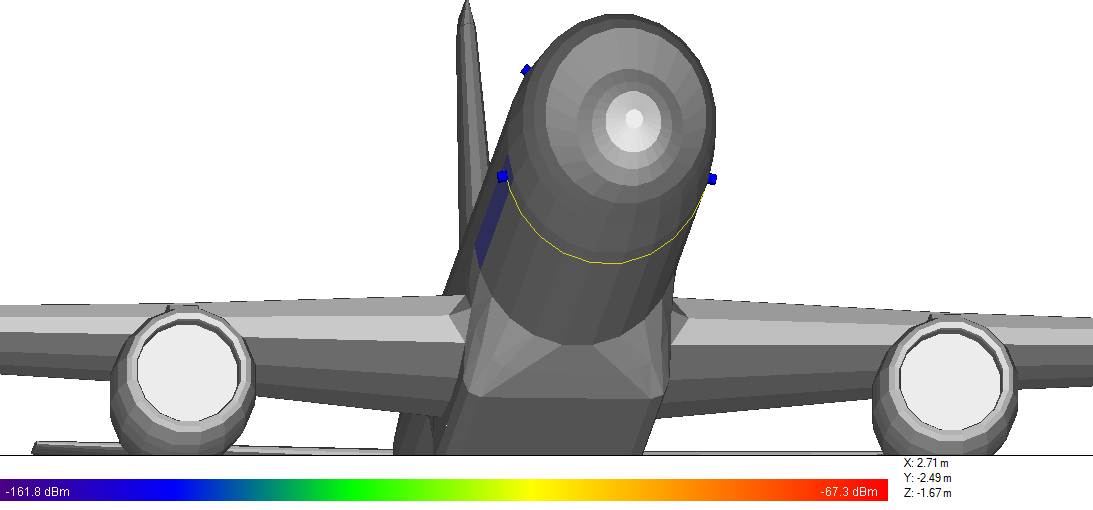
Figure 8: Ray paths between transceivers 1 and 4 (S14 & S41).
Similarly, the coupling between transceivers 2 (upper right) and 3 (upper left), with S23 = S32 =-87.45 dB, is due to the creeping wave that travels over the top of the aircraft as shown in Figure 9.
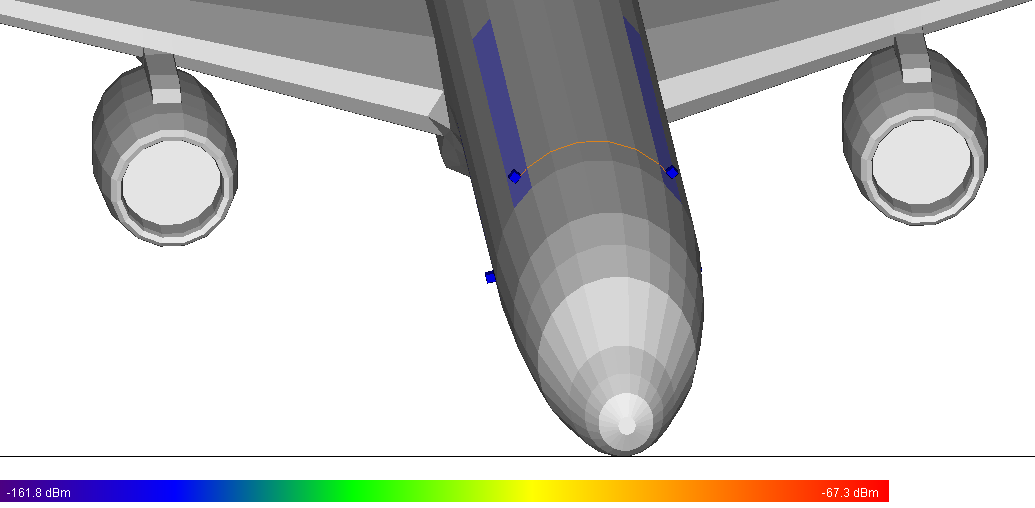
Figure 9: Ray paths between transceivers 2 and 3 (S23 & S32).
Coupling between the bottom antenna and the upper antenna on the opposite side of the aircraft is also due to the creeping wave contribution as shown in Figure 10, where S-parameters S13, S31, S24, S42, are all approximately -104.56 dB.
