Monopole On A Box
This example considers the far zone antenna gain patterns from a 0.125 m monopole antenna situated on top of a metal box.
This example considers the far zone antenna gain patterns from a 0.125 m monopole antenna situated on top of a metal box. Results from XGtd are compared to Finite Difference-Time Domain (FDTD) calculations. Figure 1 shows the XGtd representation of the problem geometry.
Table 1 summarizes the box dimensions and transmitter location used in the XGtd and FDTD simulations. The box dimensions differ because the FDTD method uses offset grids for calculating the electric and magnetic fields. The offset effectively increases the size of the object being modeled. To account for this, the dimensions of the metal box in XGtd were increased by half of the FDTD cell size. The offset also affects the location of the transmitter on the top face of the metal box. For the FDTD calculation, the cell spacing was 25 mm (20 cells per wavelength at 600 MHz). The material properties of the box were set to a perfect electrical conductor in both simulations, and a 600 MHz sinusoid was used as the transmitting signal.
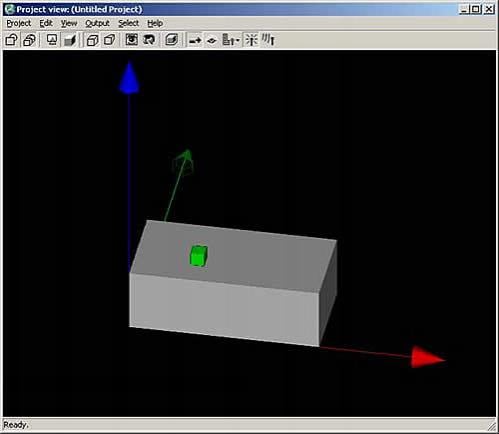
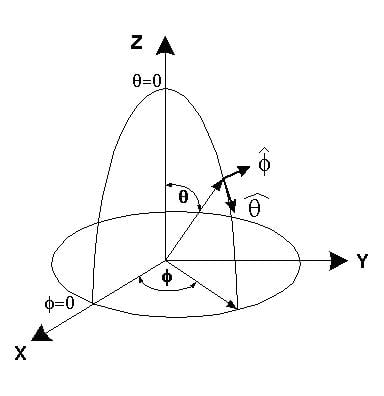
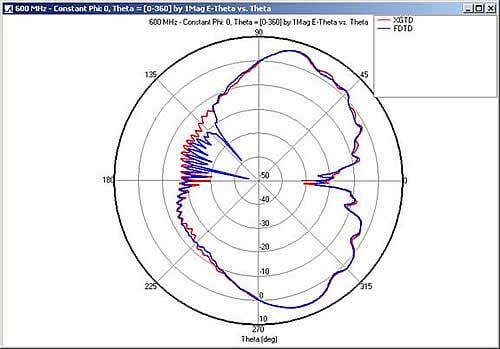
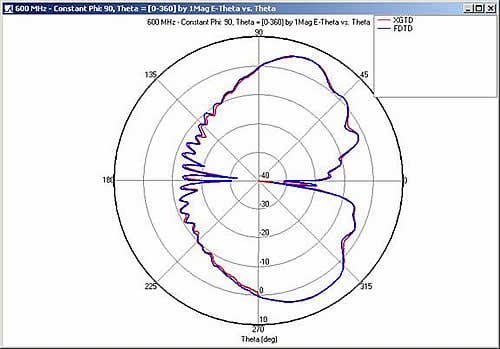
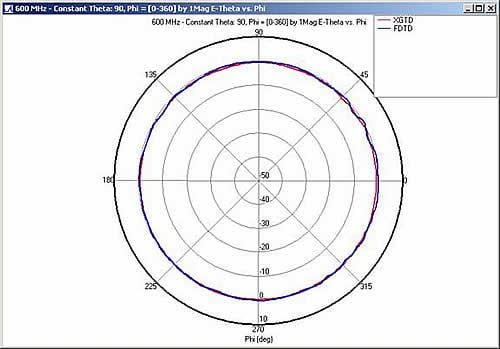

Table 1: Metal box dimensions
Far Zone Antenna Gain Patterns
Both XGtd and FDTD are capable of calculating far zone antenna gain patterns for circles of constant polar (theta) or azimuth angle (phi), where the angles theta and phi are defined by the conventional spherical coordinate system shown in Figure 2.
FDTD far zone results were generated using a cells spacing of 25 mm and 1500 total times steps. The XGtd results were calculated using the Full 3D model with 1 reflection and 2 diffractions. Table 2 compares the run times for each method on a 2.6 GHz Intel Xeon processor.
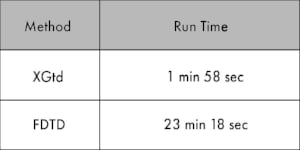
Table 2: Comparison of XGtd and FDTD run time
Figure 3, Figure 4, and Figure 5 compare the far zone patterns for constant azimuth angles phi = 0° and phi = 90° and constant polar angle theta = 90° .
The XGtd results show generally good agreement with the FDTD solution. In the line of sight region for the phi cut planes (Figure 3 & Figure 4), the results of the methods match. The XGtd result is slightly off from the FDTD solution in Figure 3 near theta = 135° , but overall, the magnitude of the gain and the locations of the peaks and nulls line up. The far zone pattern for the phi = 90° cut plane shows particularly good agreement between each method in the shadow region. For the theta = 90° cut plane, both the XGtd and the FDTD results give an omni-directional pattern.

