LTE devices are the latest technology to be used for various wireless data systems. These systems provide better coverage than previous technology. In an urban environment, coverage is impacted greatly by the elements within the city like buildings, terrain, cars, etc. These elements need to be accurately modeled to determine the LTE performance.
Usually within an urban environment, there are multiple transmitters and receivers operating simultaneously. Having multiple transmitters ensures optimal coverage but it is important to properly place the transmitters to guarantee all active receivers have adequate signal. It is nearly impossible to accurately perform a field test in a scenario like this due to time, money, and resource limitations. Simulation software like Wireless InSite can do this fast and efficiently. Wireless InSite can also run multiple placement locations for the transmitters to determine the optimal coverage location.
Within Wireless InSite, a multiple input analysis is very simple to model and efficient to calculate. In this example, using a model of the city of Ottawa, there are two active transmitters located on top of buildings located roughly two city blocks apart. These transmitters are simulating LTE transmitters operating in an urban environment with an input power of 30 dBm. There are multiple receivers defined within the scene. Each receiver can communicate with both transmitters.
The city environment can be imported into the software using a variety of formats including DXF and Shapefiles; alternatively, the geometry can be constructed within the GUI. Various materials can be defined using the built-in material library or custom materials can be defined using Wireless InSite utilities. In addition, terrain is defined for the environment to ensure that an accurate model is used within the simulation. Terrain can be imported from DTED data, DEM data, etc., or it can be defined by the user in the GUI.
The transmitter locations are depicted in Figure 1. They are defined as a half-wave dipole for each location operating at 700 MHz. They are easily placed within the city with a few mouse clicks. The receiver locations are on a grid defined within the software as seen in Figure 2. Each receiver is defined as an isotropic antenna receiving at 700 MHz. There were over 61,000 receivers defined in the city.
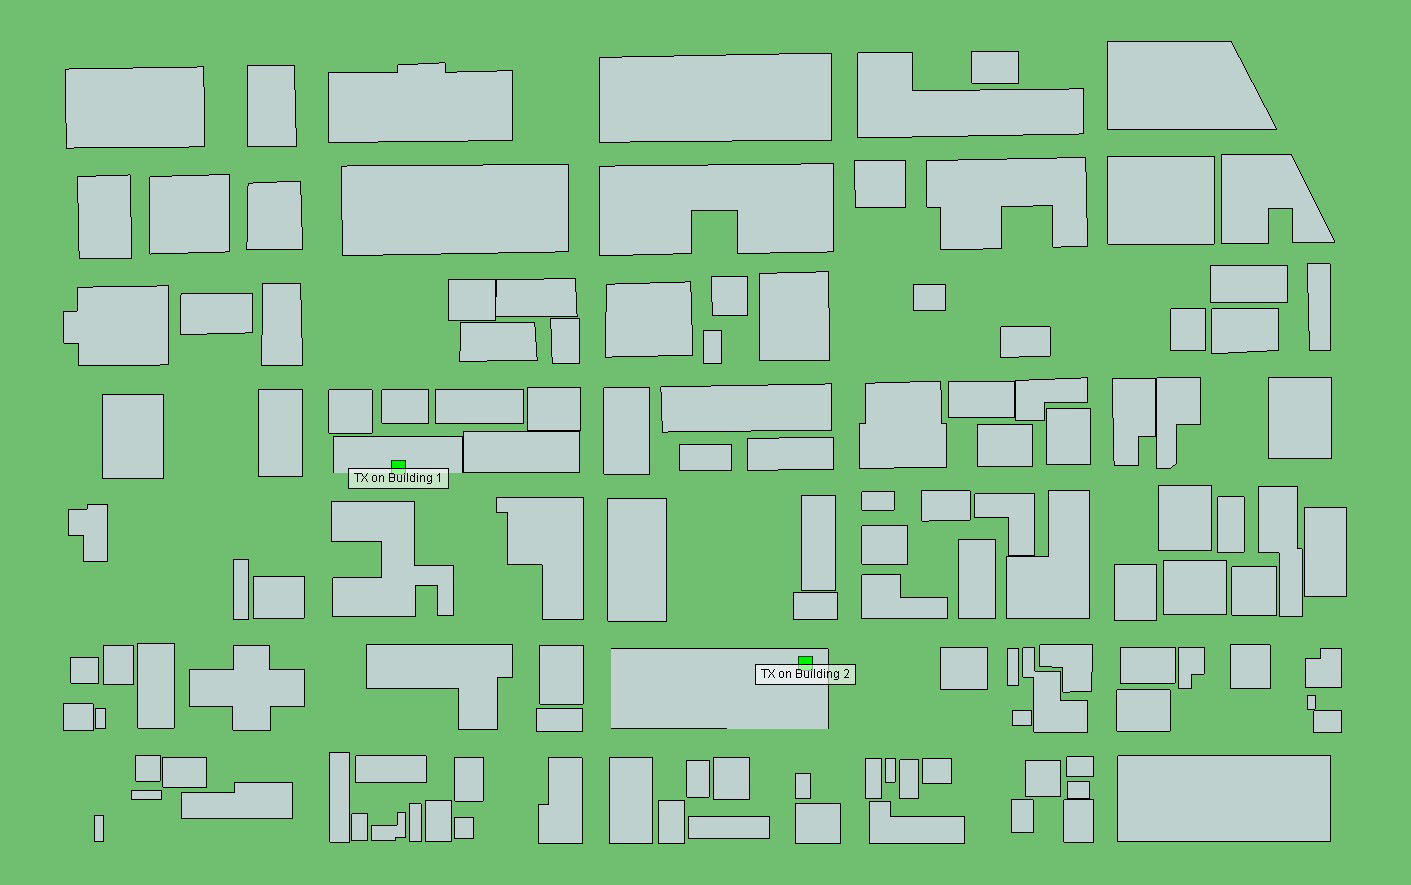
Figure 1: Transmitter locations within an urban environment represented by green boxes.
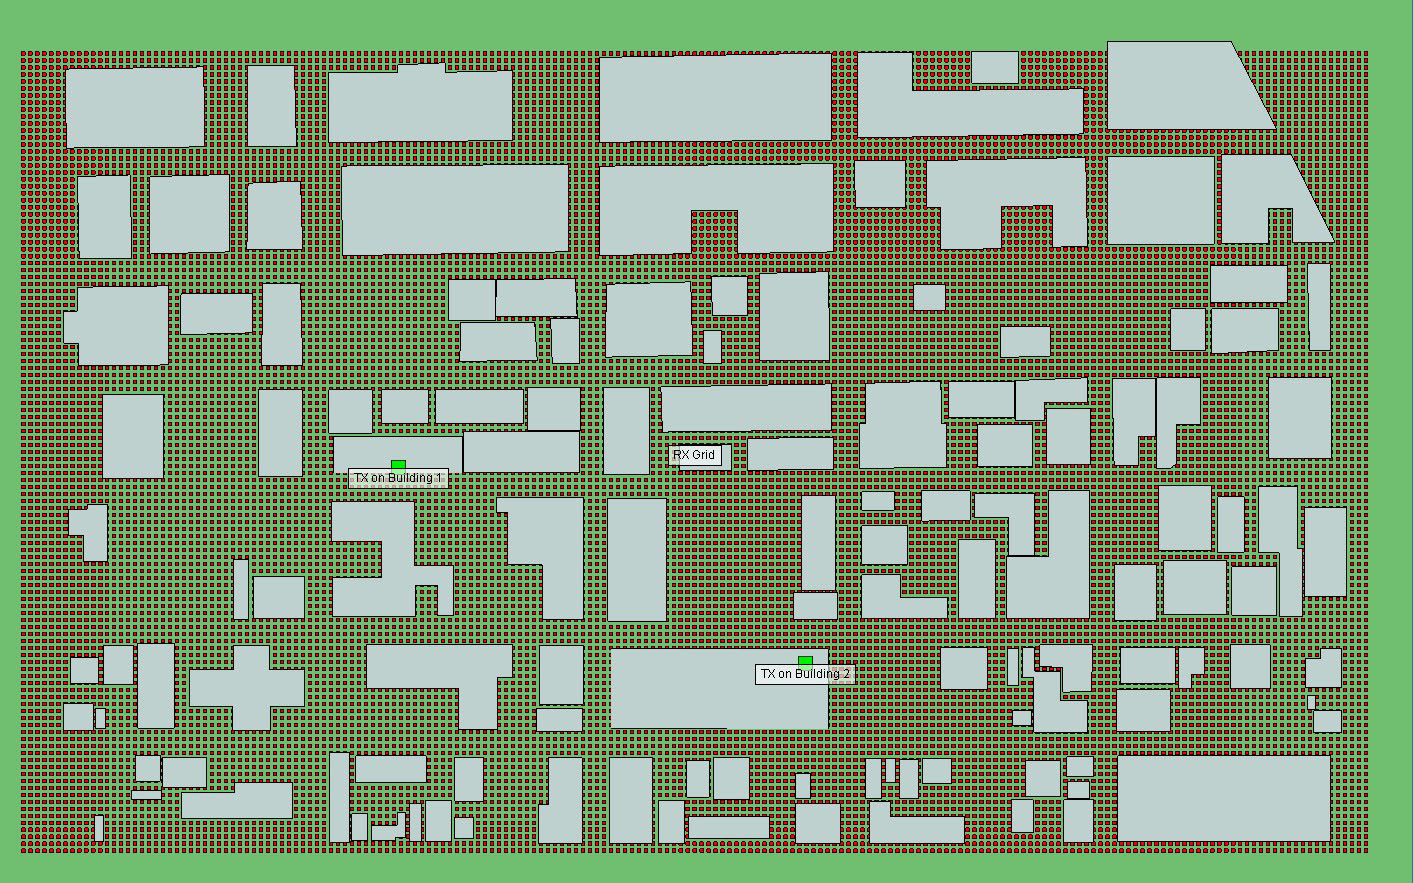
Figure 2: Receiver locations within urban environment represented by red boxes.
A Communication System Analysis calculation was defined and run within Wireless InSite as shown in Figure 3. This is a tool incorporated within Wireless InSite for post processing the propagation data. It calculates output such as the total combined power at each receiver location, the strongest transmitter at each receiver location, and throughput, to name a few.
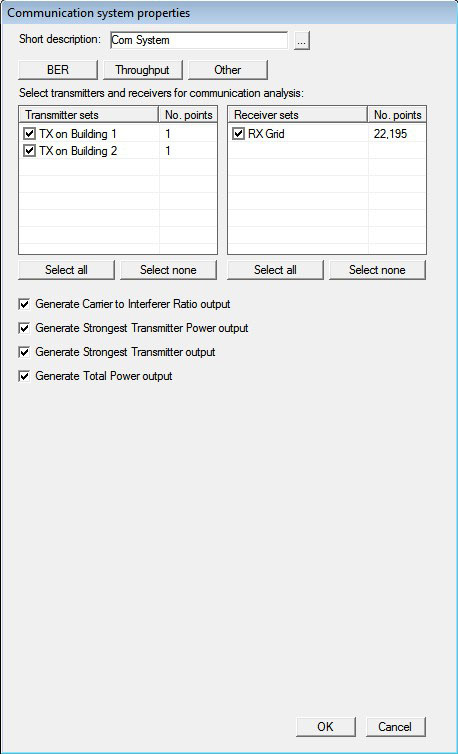
Figure 3: The Communication System Properties window within Wireless InSite.
The X3D model was utilized for this scenario with the interactions set to auto. The X3D utilizes GPU capabilities during the ray tracing phase of the calculation.
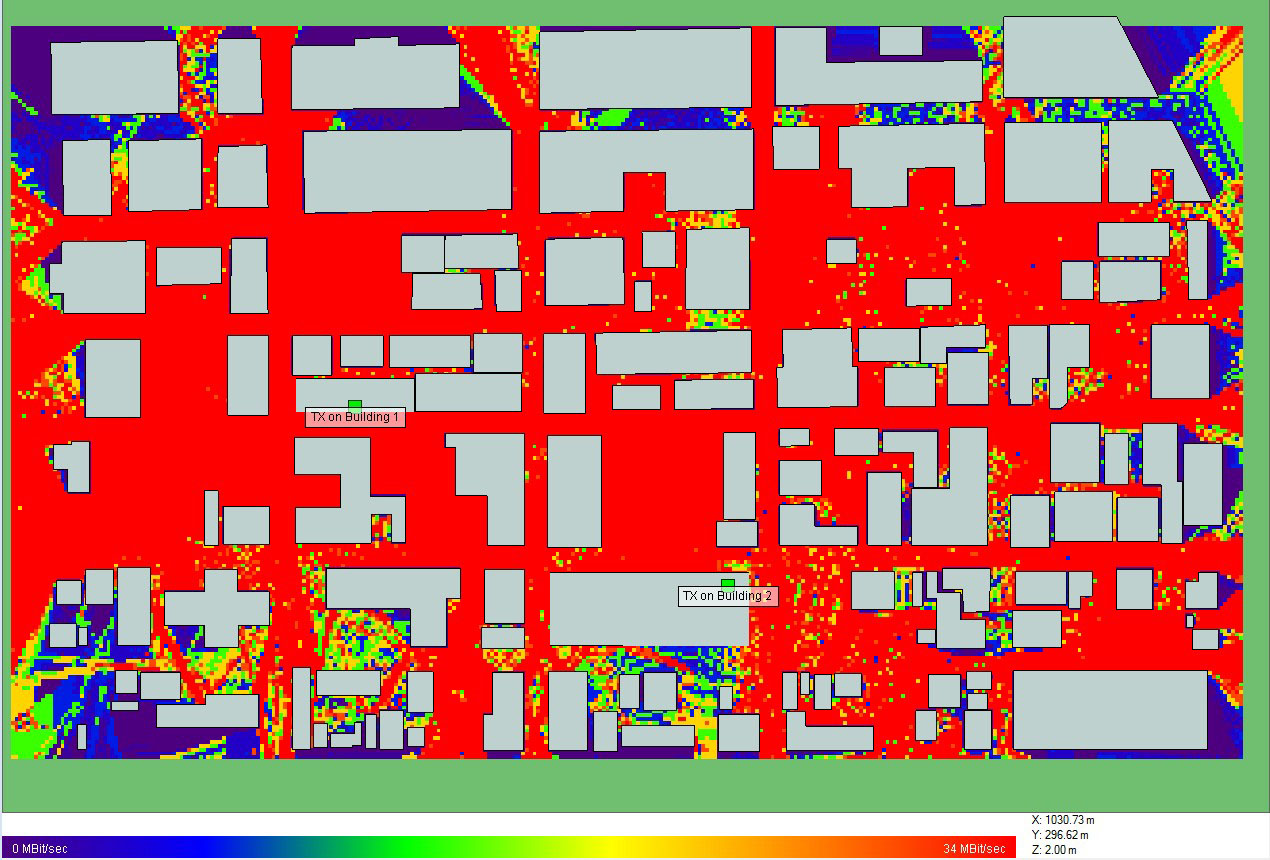
Like all output in Wireless InSite, the Communication Analysis results can be viewed inside the 3D representation of the city once the calculation is complete. Figure 4 shows the received power results throughout the whole space when Transmitter 1 is active. Figure 5 shows the received power results throughout the whole space when Transmitter 2 is active. Figure 6 depicts the total combined power at each receiver location. This output combines the received power from both transmitters for a given receiver location. The Communication Systems Analyzer can also perform throughput estimates based on LTE protocols. Figure 7 displays the LTE throughput for both transmitters at once.
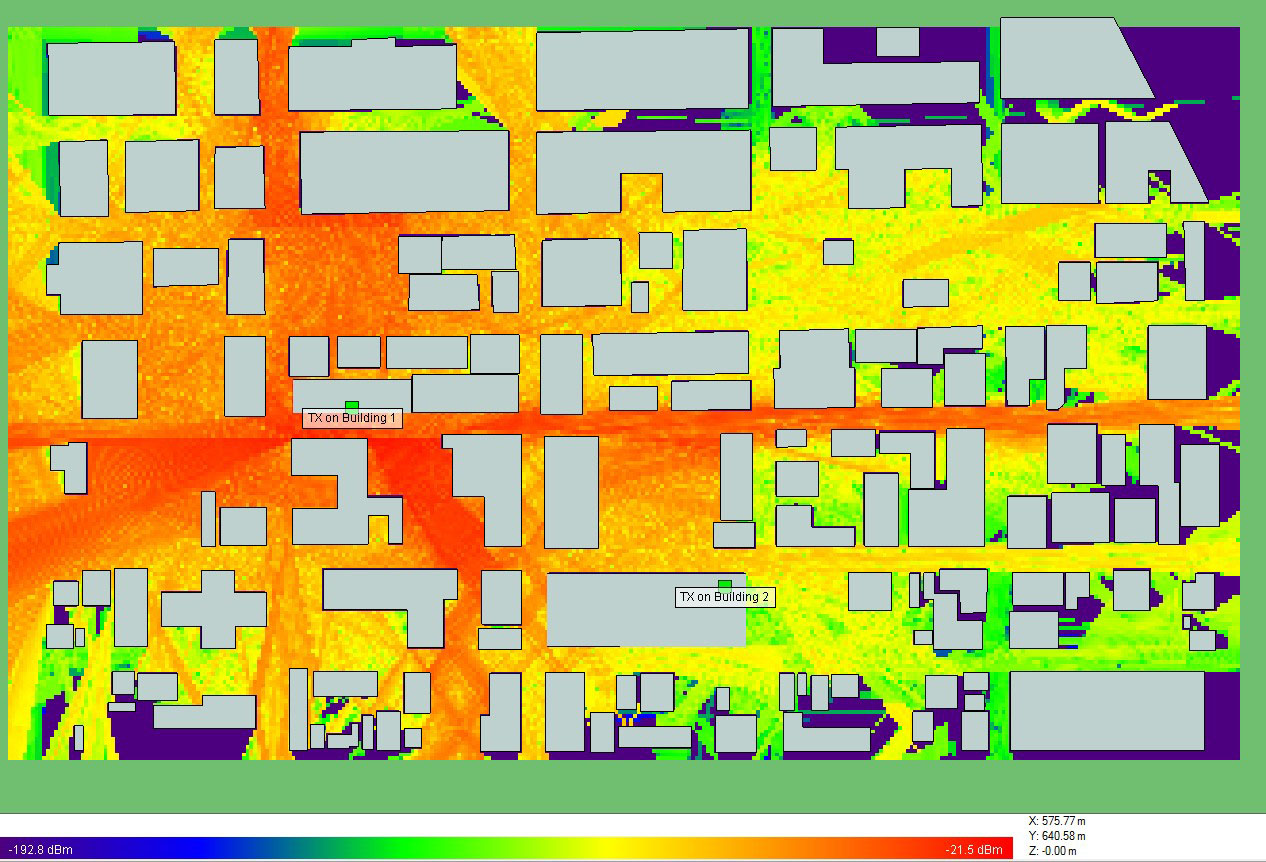
Figure 4: Received power through the scene when Transmitter 1 is active.
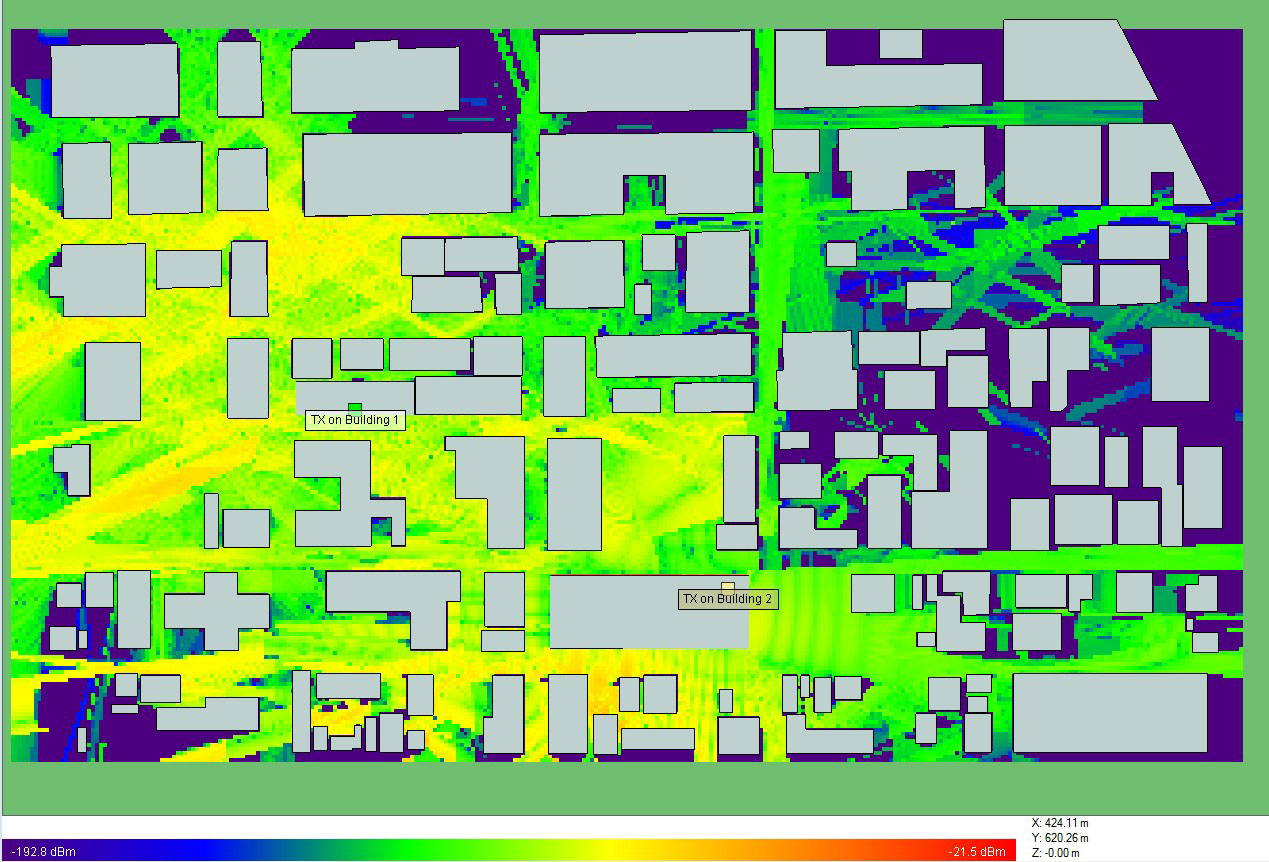
Figure 5: Received power through the scene when Transmitter 2 is active.
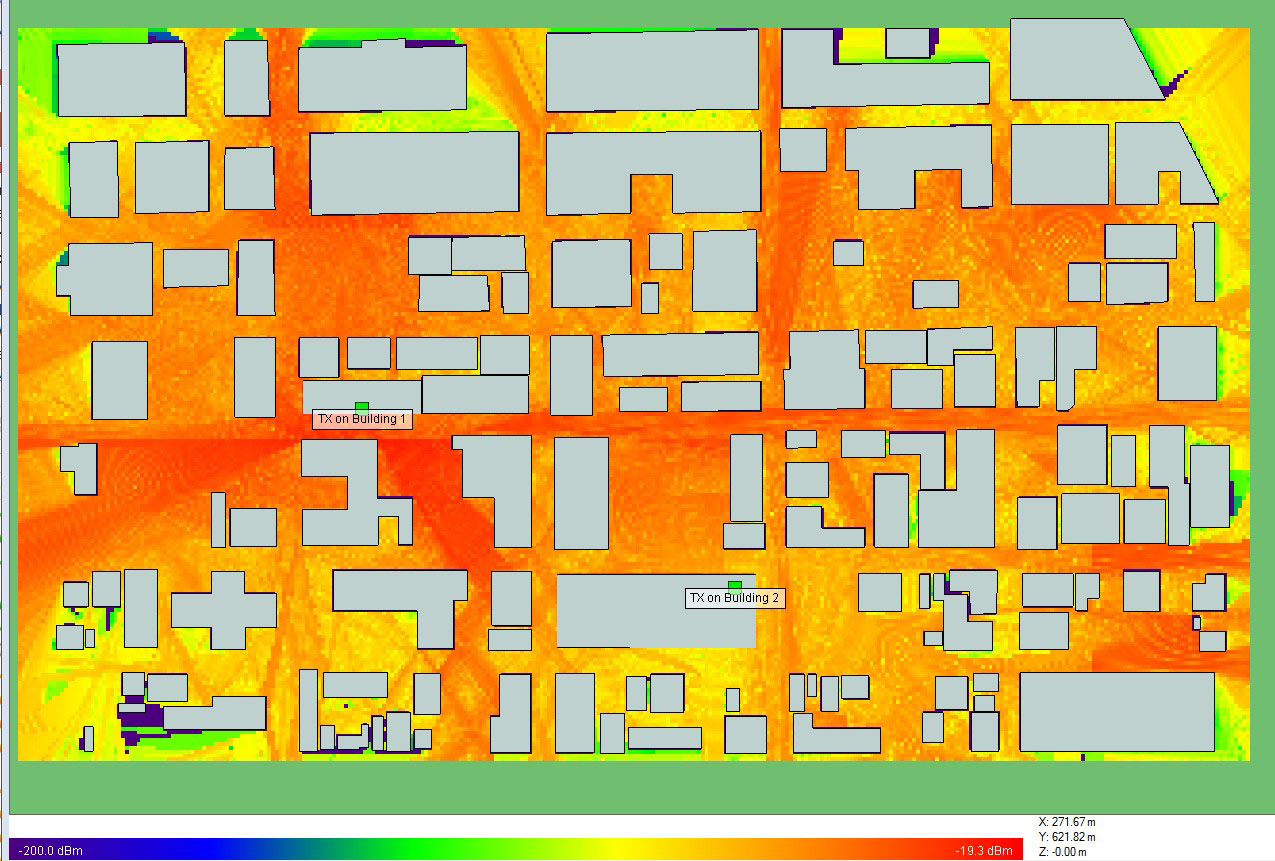
Figure 6: Total power from combined Transmitters at each Receiver location.