Wireless InSite's Vertical Plane propagation model uses the UTD wedge diffraction coefficients with the modifications for finite conductivity given in Luebbers [1] , and for multiple diffractions given in Luebbers [2] . The advantages of wedge diffraction over knife-edge diffraction models and semi-empirical models in propagation prediction have been addressed in several papers [1,3]. The advantages include the capability to include reflections, to accurately model the actual terrain and to include effects of finite conductivity and surface roughness. The UTD based model can provide precise predictions for situations where the terrain profile is accurately known, especially for shorter paths, since its computations include the reflections and diffractions for the particular terrain profile being considered.
In many cases it is possible to calculate the path loss and other propagation characteristics using only the features in the vertical plane containing the transmitter and receiver of interest. Wireless InSite automatically extracts the vertical planes from the three-dimensional terrain data. The calculations are performed for all active transmitter and receiver sets.
Wireless InSite is more accurate than other models because it computes both amplitude and phase of the electric fields for all the paths from the transmitter to the receiver and sums the complex valued fields to determine the total electric field and other derived quantities. The paths can undergo a maximum of four diffractions and an arbitrary number of reflections.
In order to validate InSite's ability to model propagation over irregular terrain, Vertical Plane results were compared to path gain measurements performed by the Institute for Telecommunication Sciences (ITS) in near Longmont , Colorado [4]. Measurements from various transmitting sites were taken by a common receiving tower. Path gain measurements and the latitude/longitude coordinates of the receiver and transmitters were obtained from the ITS website.
Importing Terrain Data
Based on the latitude/longitude coordinates of the transmitters and receivers, surrounding terrain data was imported into Wireless InSite from Digital Terrain Elevation Data (DTED) of the area. The extent of the terrain was specified by entering the long/lat coordinates of the terrain's southwest and northeast corners. InSite's terrain importer also allows users to set the sampling rate of terrain. For this example, every second point of the DTED data was imported to create the terrain feature.
Project Set Up
The imported terrain was assigned a relative permittivity of 4.0 and a conductivity of 0.001 S/m. After creating the terrain, transmitters and receivers can be placed in the project by entering their longitude and latitude coordinates and the transmitter's height above the terrain. All seven transmitters are located 7.3 meters above the ground, and the receiver tower extends vertically from ground level to 13 meters. Horizontally polarized isotropic antennas were assigned to both the transmitters and receiver, and a 910 MHz sinusoid was used to describe the waveform. Figure 2 shows the imported terrain along with the transmitter and receiver locations in the Wireless InSite project. Path profiles are labeled above the transmitter locations in the figure.
Terrain Viewing Options
Wireless InSite contains several functions to aid in placing antennas on terrains and viewing the terrains features. To emphasize changes in elevations which may be difficult to see because of the overall size of the terrain area, a ‘Z-scaling' factor can be entered. The terrain shown in Figure 2 is scaled in the z direction by a factor of 5. In addition to Z-Scaling, terrain elevations can be displayed in the project view using the ‘Color by Height' option as shown in Figure 3. Users can choose either a continuous color scale or a discrete scale.
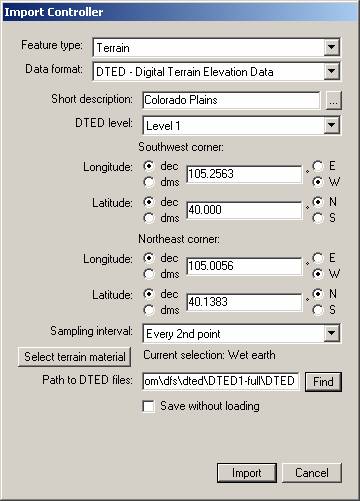
Figure 1: Terrain import controller
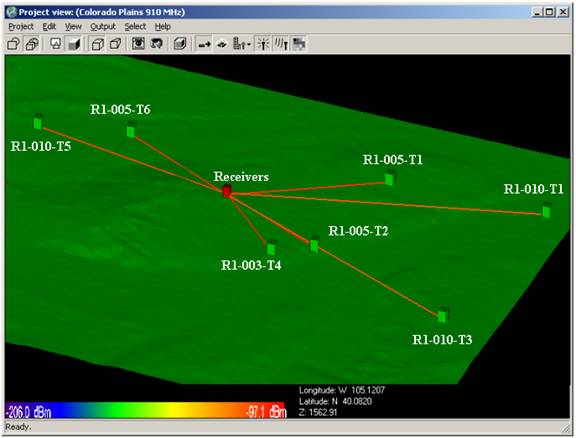
Figure 2 : Imported terrain with transmitters (green) and receiver tower (red)
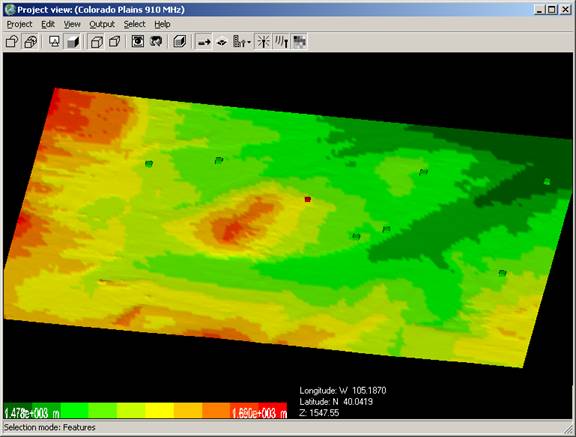
Figure 3: Terrain elevations viewed using InSite's ‘Color by height' option
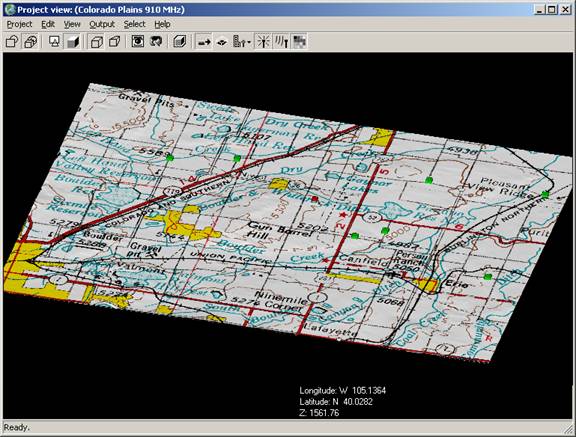
Figure 4: Terrain with imported image of the surrounding area
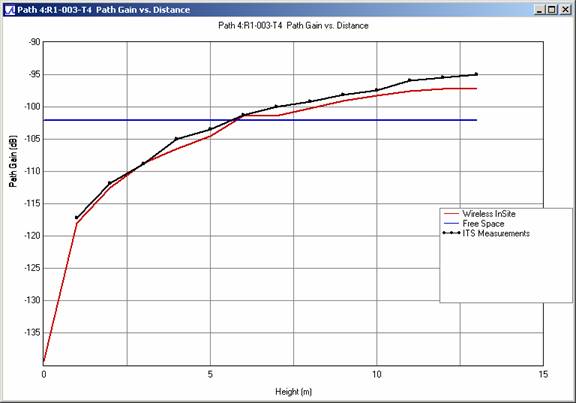
Figure 5: Path gain comparison versus receiving antenna height for profile R1-003-T4 at 910 MHz
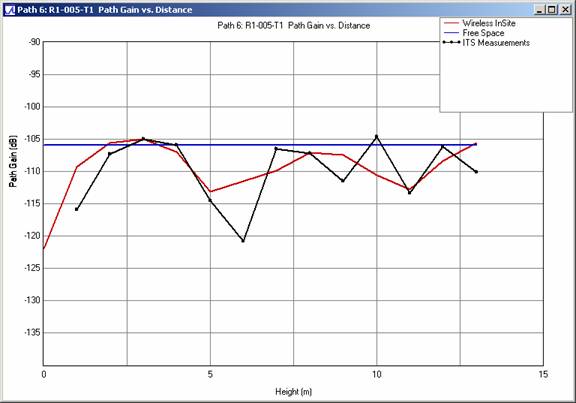
Figure 6: Path gain comparison versus receiving antenna height for profile R1-005-T1 at 910 MHz
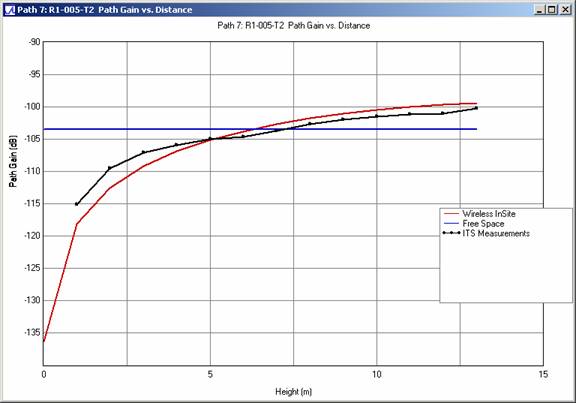
Figure 7: Path gain comparison versus receiving antenna height for profile R1-005-T2 at 910 MHz
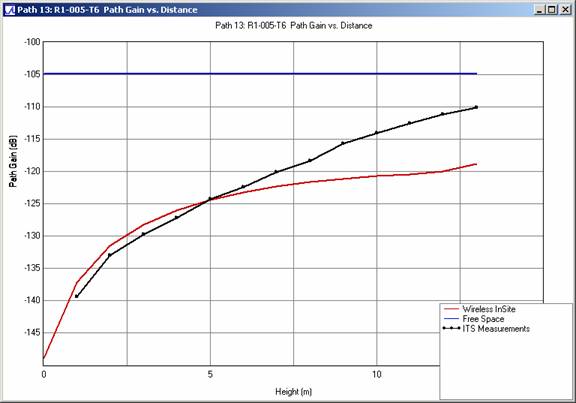
Figure 8: Path gain comparison versus receiving antenna height for profile R1-005-T6 at 910 MHz
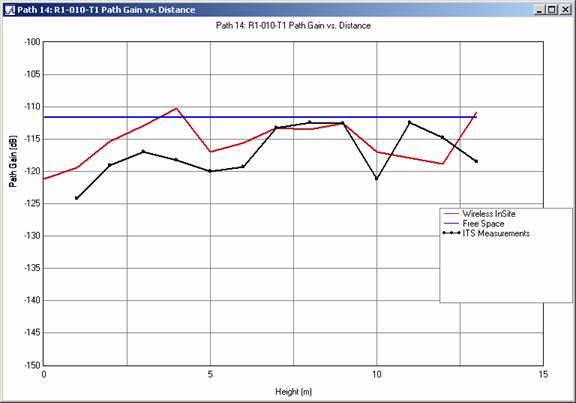
Figure 9: Path gain comparison versus receiving antenna height for profile R1-010-T1 at 910 MHz
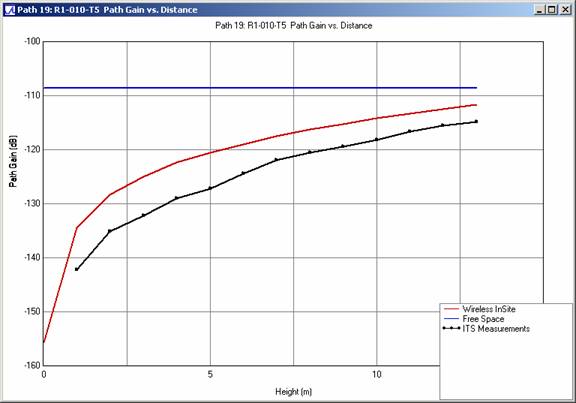
Figure 11: Path gain comparison versus receiving antenna height for profile R1-010-T5 at 910 MHz
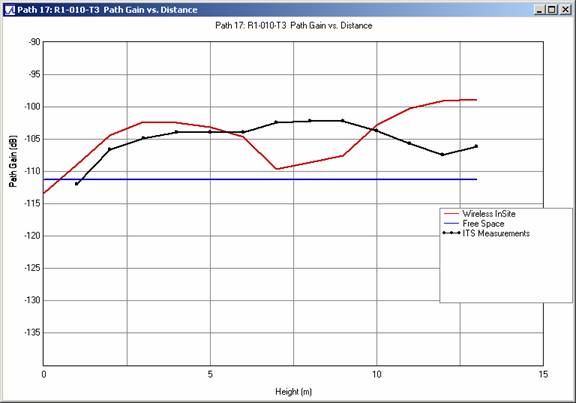
Figure 10: Path gain comparison versus receiving antenna height for profile R1-010-T3 at 910 MHz
Calculation Parameters and Results
Path gain predictions were made using InSite's Vertical Plane model with a maximum of 2 reflections and 4 diffractions. Terrain profiles were linearized with a 3% maximum allowed error. Results for each transmitter are compared to the ITS measurements (black). The free space path gain is represented in each figure as a blue line.
For the selected paths, predictions from Wireless InSite's Vertical Plane model show good agreement with the ITS measurements.
References
R. J. Luebbers, "Finite conductivity uniform GTD versus knife-edge diffraction in prediction of propagation path loss," IEEE Trans. Antennas Propagat. , vol. AP-32, pp. 70-76, Jan. 1984.
R. J. Luebbers, "Propagation prediction for hilly terrain using GTD wedge diffraction," IEEE Trans. Antennas Propagat. , vol 32, no 9, pp. 951-955, Sept. 1984.
K. Chamberlin and R. Luebbers, "An evaluation of Longley-Rice and GTD propagation models," IEEE Trans. Antennas Propagat. , vol. AP-30, pp. 1093-1098, Nov. 1982.
McQuate, P. L., J. M. Harman, and A. P. Barsis (1968), “Tabulations of propagation data over irregular terrain in the 230-9200 MHz frequency range”, Part I: Gunbarrel Hill receiver site, ESSA Tech. Report ERL 65-ITS.