How XGtd Calculates Antenna Gain on a Large Spacecraft
The following example demonstrates XGtd's abilities to import geometry from CAD files and calculate received power and far zone antenna gain patterns for a transmitter located in the cargo bay of the space shuttle.
Shuttle Geometry
Shuttle geometry was imported into XGtd from a DXF file. The shuttle was rotated in XGtd to align the geometry along the project's y-axis (green). The blue and read arrows in the figure below represent the z and x axes, respectively.
The shuttle model in Figure 1 initially contained about 13,000 faces. Although XGtd projects are capable of containing up to 32,000 faces, CAD files commonly contain excessive details that can prolong calculation times without significantly improving the accuracy of the results.

After replacing the engines with simplified geometry, XGtd's Simplify Feature utility was used to further reduce the number of faces in the model in Figure 2.

Waveform Definition
A 1 GHz Blackman pulse was used as the transmitter's waveform. The parameters defining this waveform are visible in the properties window in Figure 3.

Antenna Definition
The transmitter was modeled using a horizontally polarized, ideal dipole antenna. To verify antenna patterns, 2D cut planes and full 3D plots can be created of the antenna gain. The dipole's antenna pattern can be viewed from the antenna's properties window (see Figure 4 or in XGtd's project view).
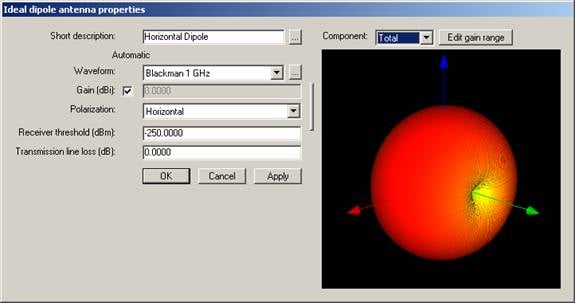
Figure 4
Placing transmitter and receiver points in the project
With a defined antenna and waveform, the transmitter and receivers can be added to the project. The transmitter antenna was placed in the center of the shuttle's bay as show in Figure 5. An arc of receivers and a vertical surface of receiver were added to the project to investigate the scattering of energy from the shuttle and the bay doors.
The antenna pattern of any transmitter or receiver point in the project can be displayed in the Project view (Figure 6). Viewing antenna patterns provides visual feedback that ensures antennas are oriented in the desired direction relative to the project's geometry. The horizontal dipole was oriented in the cargo bay with the dipole's nulls aligned with the length of the shuttle.


Study area definition and parameter
After creating the transmitter and receiver sets, all features, transmitters, and receivers in the project were enclosed in an auto-bounding study area. Propagation near the shuttle was modeled using XGtd's full 3D propagation model. The maximum number of reflections was set to 2 and the maximum number of diffractions was set to 3 in the Study Area Properties window (Figure 7).

Requesting output – far zone antenna gain patterns
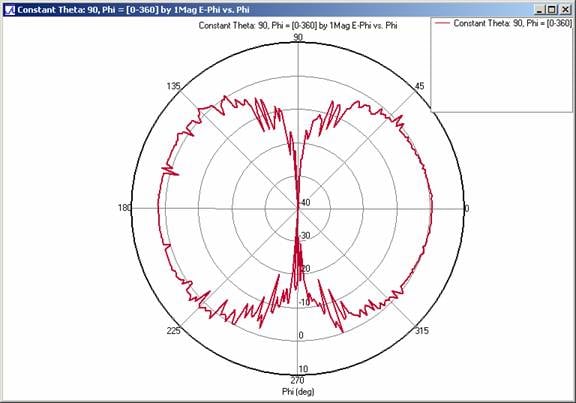
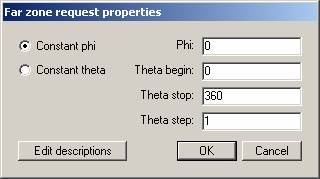
Before starting the calculation, received power, electric field magnitude/phase, and propagation paths are identified as desired output. In addition, far zone antenna gain data in the XZ plane and in the XY plane were also requested (Figure 8).
Running the calculation and viewing the results
The calculation was run with 2.66 GHz Xeon processor and finished in just under 2 hours. After the calculation finishes, results can be plotted or displayed in XGtd's Project View. Figure 9 shows the calculated received power for the vertical receiver grid intersecting the shuttle. As expected the body of the shuttle and the open bay doors block most of the energy from reaching the area below the shuttle.
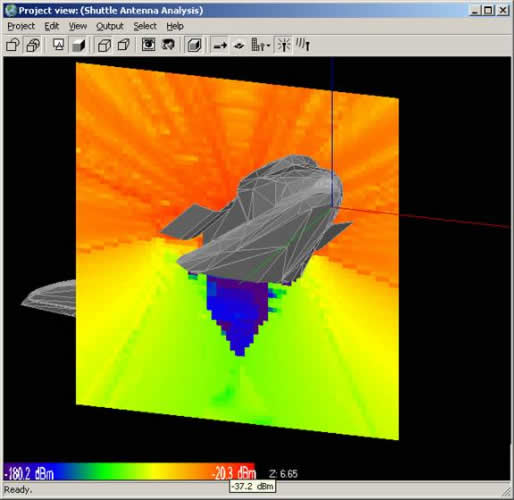
Figure 9
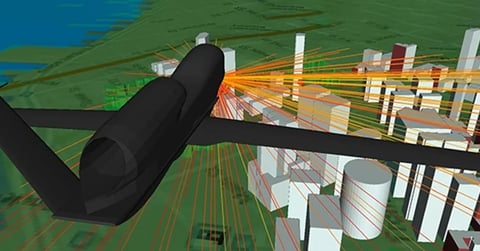
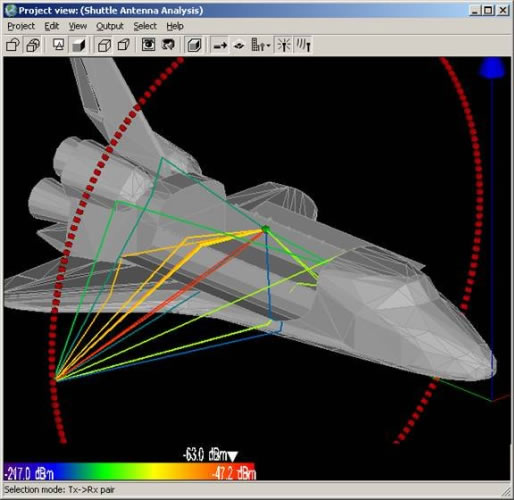
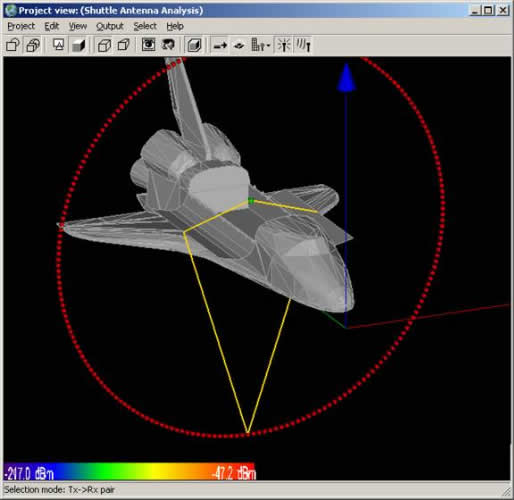
Propagation paths between the transmitter and receivers in the project can be viewed directly in the project view (Figure 10. Examining the paths to a particular receiver point provides users with a quick method for understanding of signal propagation between two points. Figure 11 shows ray paths from the transmitter to a point on the arc of receivers. The rays include a line-of-sight, diffractions from the edge of the bay doors, and rays that reflect off of the body of the shuttle.
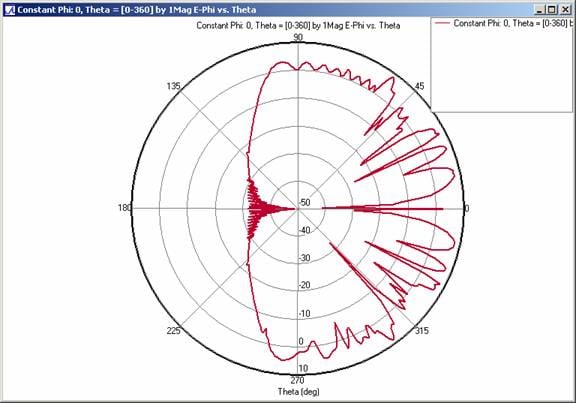
Calculated far zone antenna gain results can be plotted on polar graphs from XGtd's user interface. In Figure 12, the antenna gain in XZ plane is given. In this plot, theta = 0 corresponds to the z-axis. The far zone pattern shows constructive and destructive interference along the z-axis. The gain quickly attenuates in the shadow region.
