Simulation of MIMO Handset Antenna Array Performance with Varying Hand Positions
A proposed design for a 12-port 5G massive MIMO mobile terminal was presented for operating in sub-6 GHz range, specifically LTE band 42 (3400-3600 MHz), band 43 (3600-3800 MHz), and band 46 (5150-5925 MHz) [1]. This device was shown to have good performance for 8x8 MIMO operation in bands 42/43 and 6x6 MIMO operation in band 46 by using several different antenna designs spaced around the edges of a mobile handset PCB. Here the performance of the antenna is simulated in XFdtd first with the handset alone and then in various configurations of either one or two hand grasping. The performance criteria evaluated are the return loss, isolation between antennas, the efficiency, gain, and the envelope correlation coefficient (ECC) which is an indicator of the diversity performance of antenna pairs.
Antenna Layout
The device is shown in Figure 1 where the 12 antenna elements are visible and labeled around the edges of the PCB. At the top and bottom left are dual band inverted PI-shaped antennas which operate in all bands under consideration. These antennas are sometimes labeled as IA in the figures that follow and are numbered as Antennas 1 and 2. Along both sides of the antenna are six longer inverted L-shaped open slot antennas (LA) for the lower (LTE 42/43) bands and four shorter inverted L-shaped open slot antennas (SA) for LTE band 46. The antennas alternate between LA and SA down the sides with three LA and two SA antennas per side. The numbering of antennas is 3 through 7 on the right (numbers 3, 5, and 7 are LA) and 8 through 12 on the left (with 8, 10, and 12 being LA). The dual band antennas are designed with a longer and shorter arm for the lower and higher frequency bands. In Figure 2, Antenna 1 is shown with conduction currents flowing at 3.6 GHz onto the longer arm and at 5.5 GHz on the shorter arm. Two elements of the LA and SA antennas are shown in Figure 3 for comparison purposes.
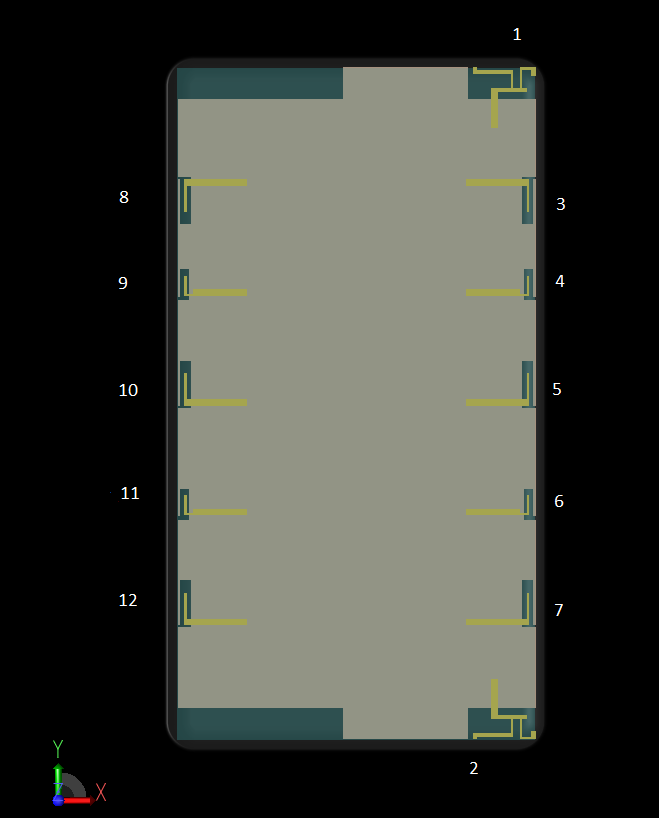
Figure 1: A CAD view of the device in the XFdtd software interface is shown where the screen and all antennas lie in the XY plane. The antenna elements are numbered 1 through 12 around the edge of the device.
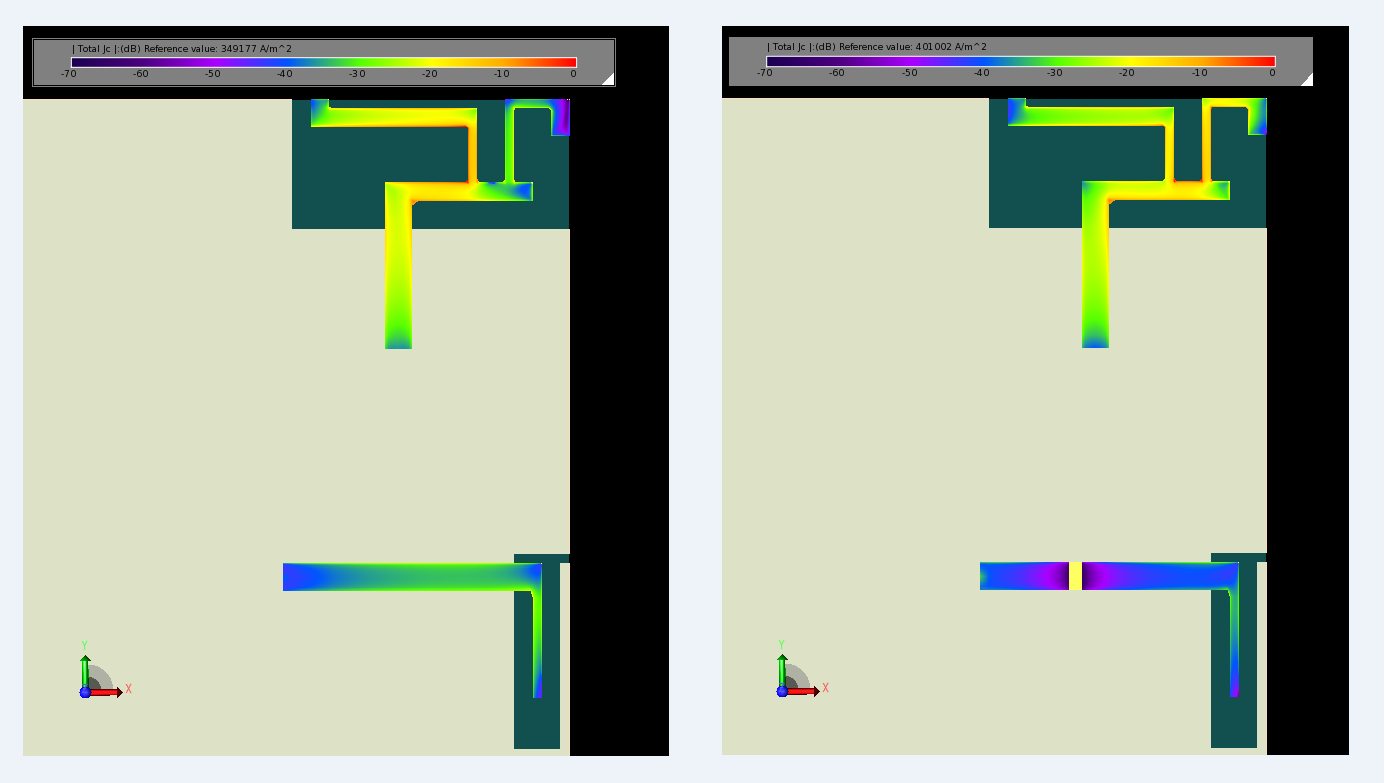
Figure 2: At the left of the figure are shown the conduction currents computed by XFdtd on the longer portion of antenna element 1 at 3.6 GHz in the LTE band 42/43 range. On the right are the conduction currents on the shorter arm of antenna element 1 at 5.5 GHz in the LTE band 46 range.
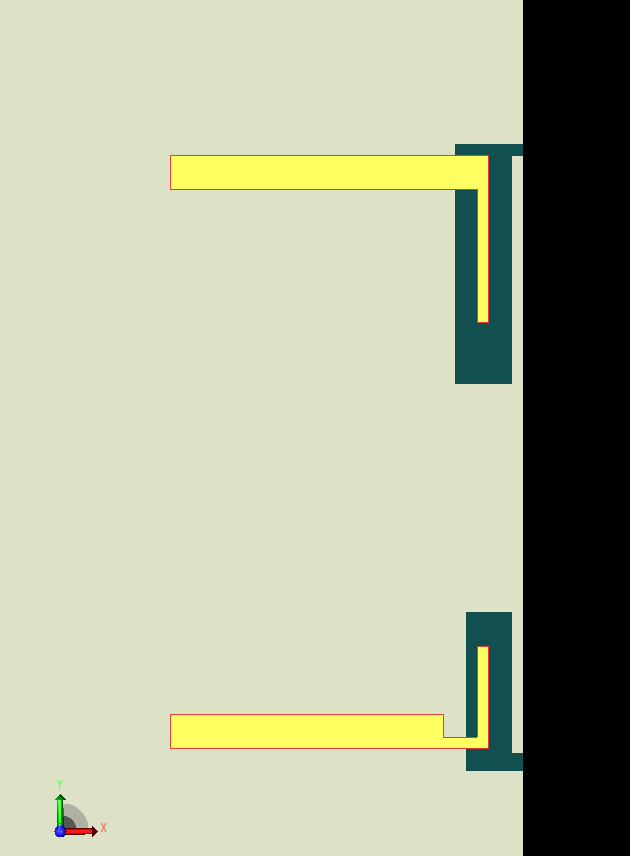
Figure 3: At the top of this view of the XFdtd interface is one of the longer arm open slot (LA) antennas for 3.6 GHz operation on the edge of the device. At the bottom is a shorter arm open slot (SA) antenna for 5.5 GHz use.
Simulation in Free Space
As one measure of performance, the S-parameters of various antennas will be considered to show the return loss and isolation of the antennas. In Figure 4, the return loss for antennas 1 and 2 (the top and bottom IA antennas) is shown along with the S21 between them. As can be seen, the antennas have good return loss values in the lower LTE 42/43 bands and the higher LTE 46 band. S21 remains low over both bands, which is expected since the antennas are on extreme ends of the PCB. The return loss of all the LA antennas in LTE bands 42/43 is shown in Figure 5. Figure 6 shows the return loss of the SA antennas in band 46 along with the isolation between adjacent SA antennas and between adjacent SA and IA antennas. The isolation between adjacent LA antennas (and between adjacent LA and IA antennas) for the lower frequency bands is shown in Figure 7. In all cases the results are within the design tolerances of return loss under -6 dB (3:1 VSWR) and isolation -11 dB or better.
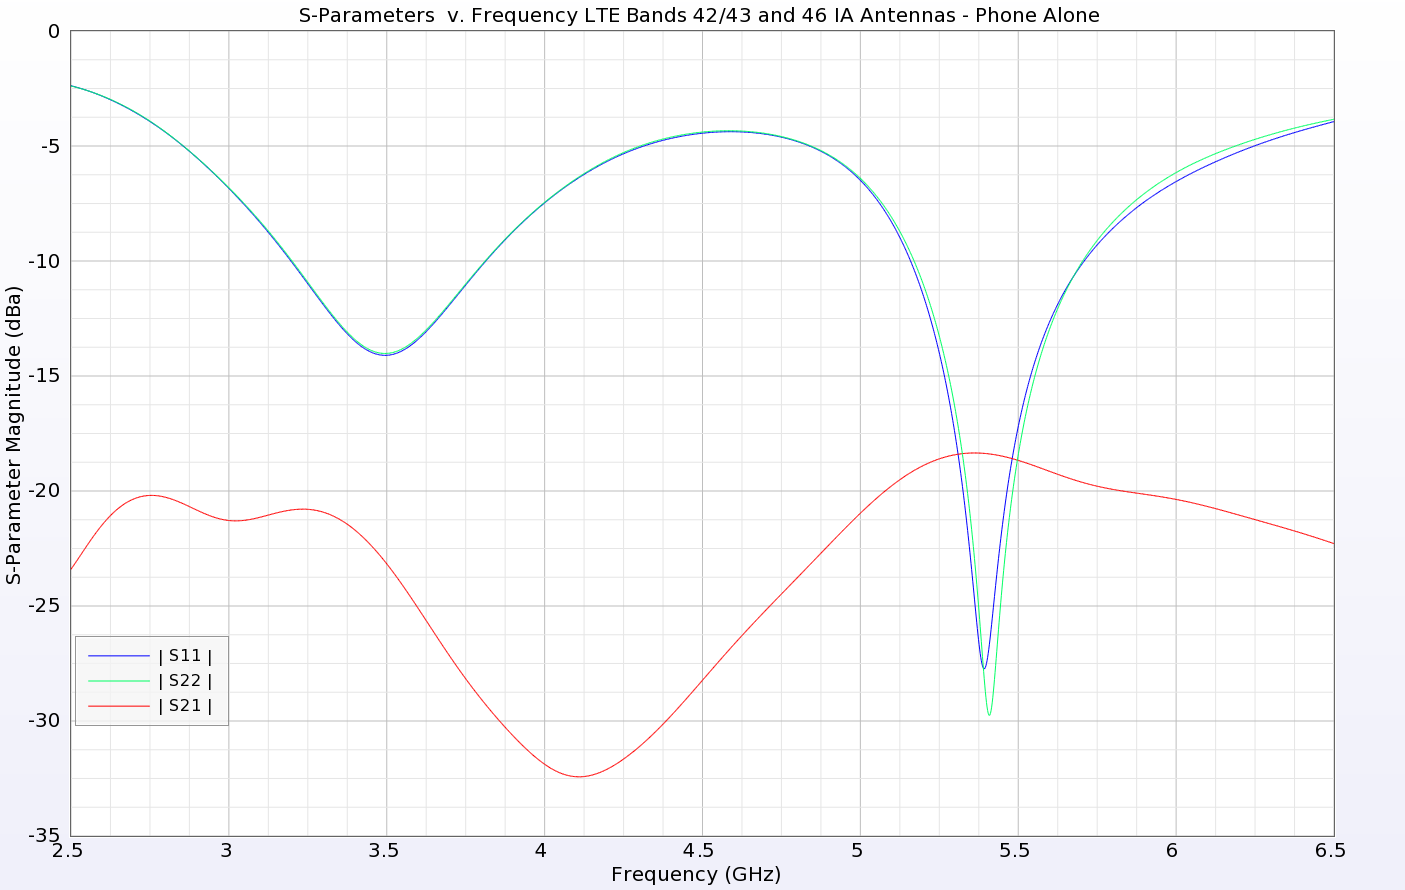
Figure 4: The S-parameters for antennas 1 and 2 are shown over all bands of operation of the device. There are two distinct operating regions: around 3.6 GHz and around 5.5 GHz. For both, the return loss is well below required levels while the isolation determined by S21 is down around -18 dB.
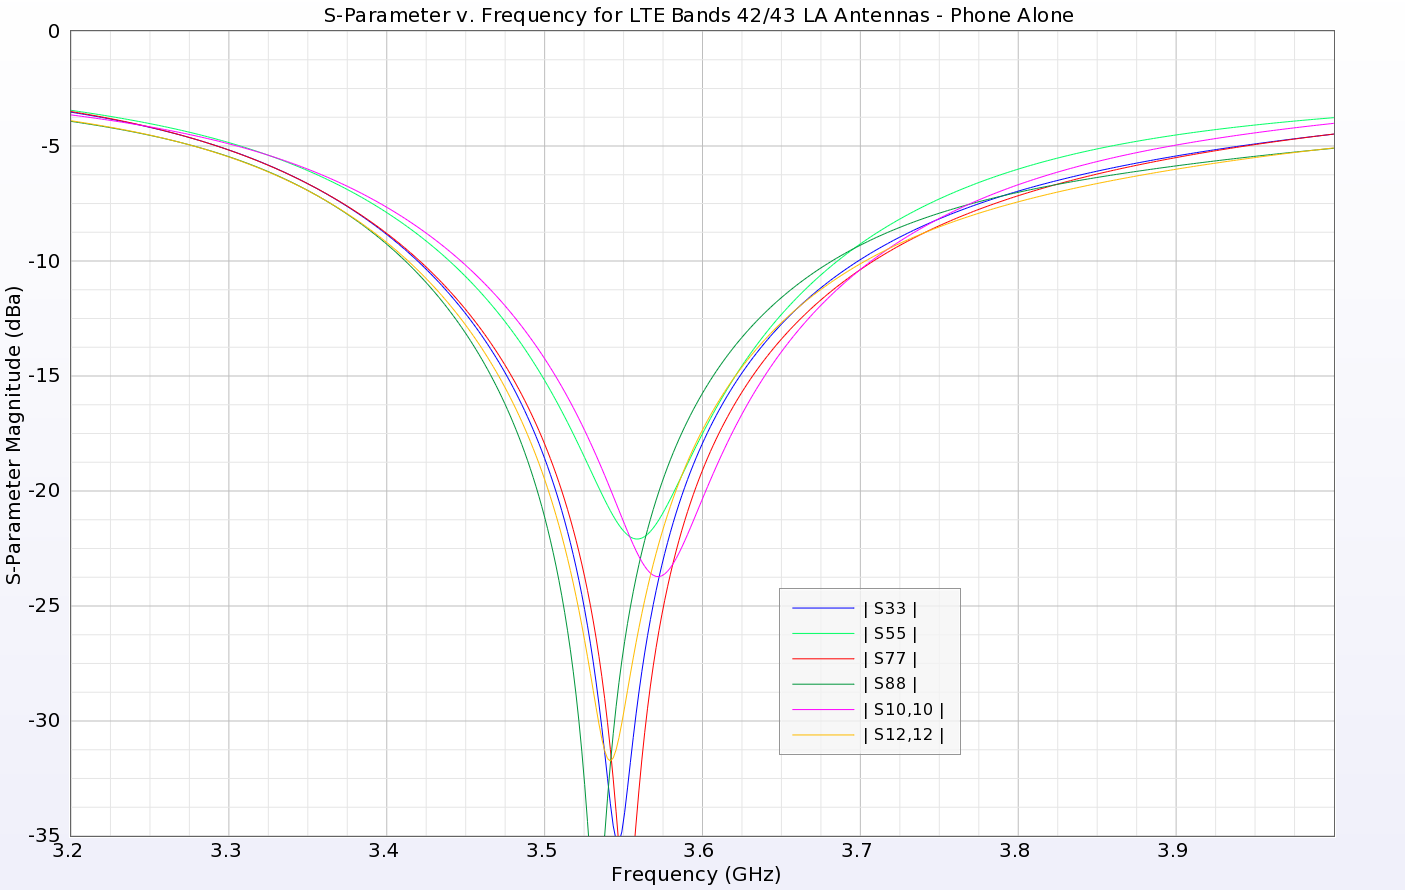
Figure 5: The return loss for all antennas in the lower band (LTE 42/43) are shown and have very good results.
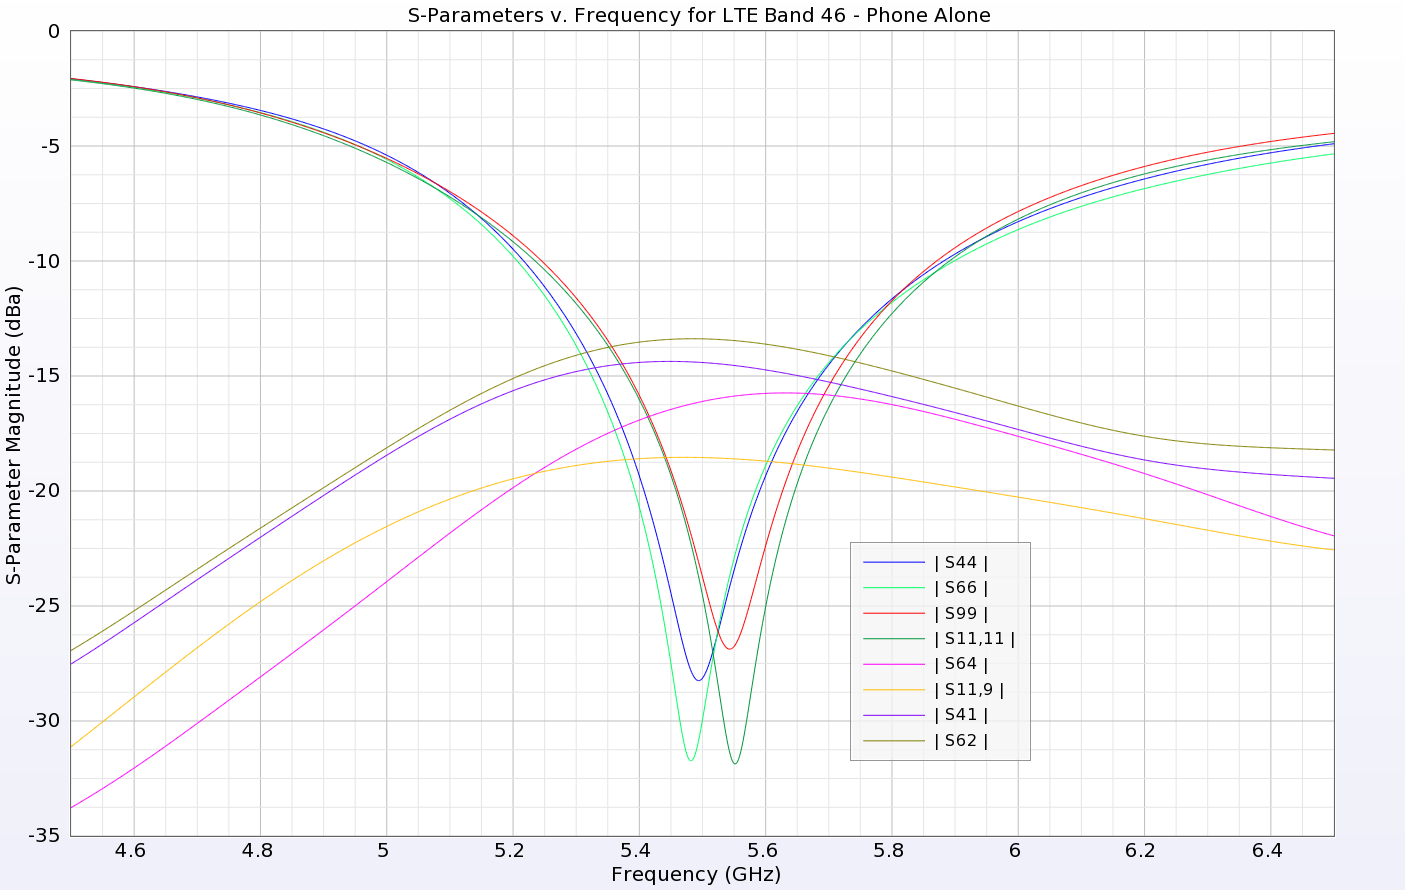
Figure 6: The return loss and isolation of select elements is shown for the higher band (LTE 46) with good results.
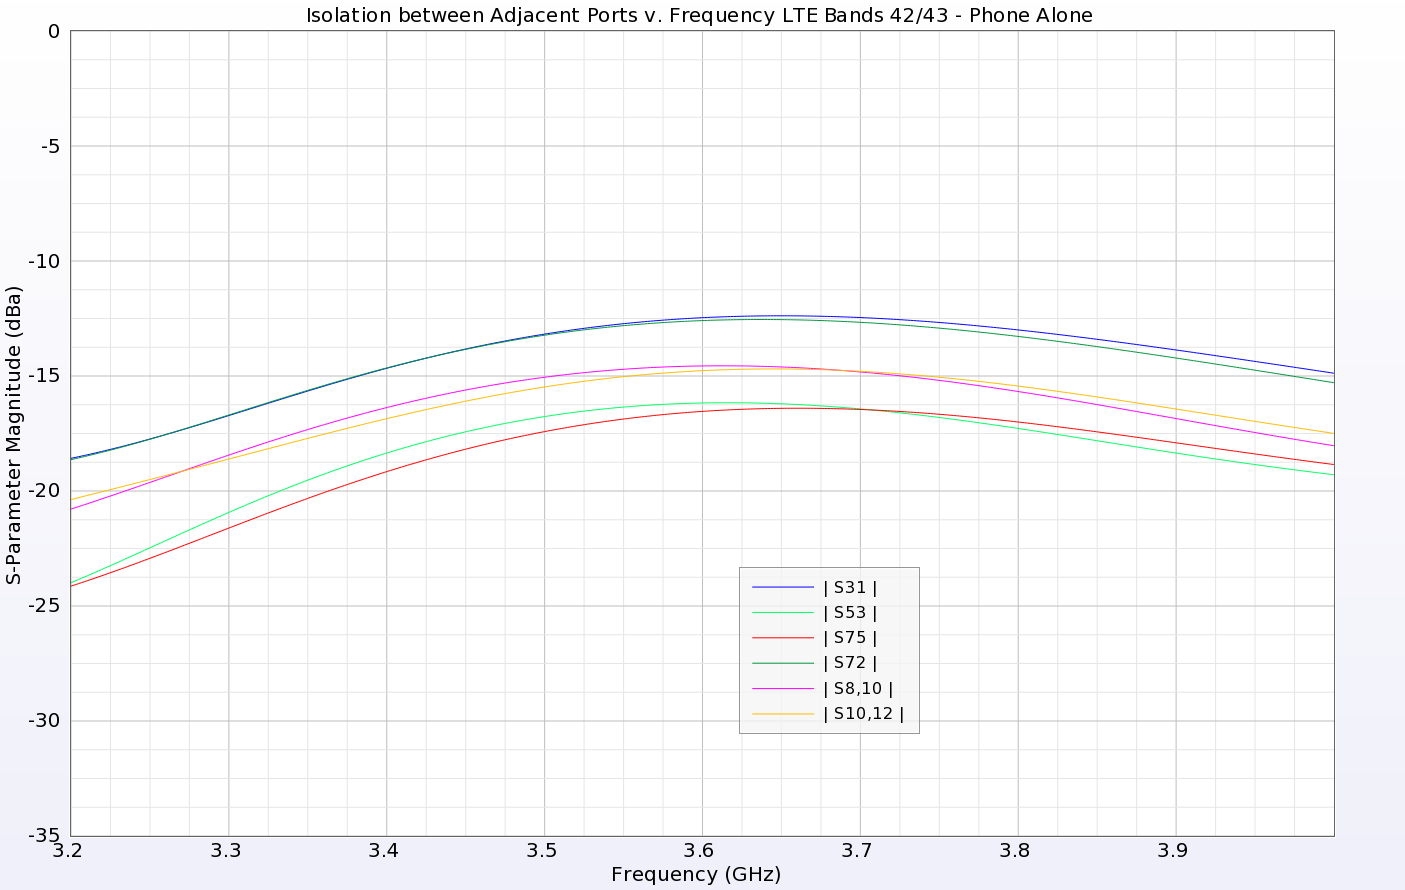
Figure 7: The isolation between select elements in LTE bands 42/43 are shown.
The antenna performance is determined by viewing the efficiency and gain of the various elements over their bands of operation. In Figure 8 the efficiency of the LTE Band 42/43 antennas is shown and is reasonable for the IA antennas (1 and 2) and moderate for the LA antennas (3, 5, 7, 8, 10, and 12). In the LTE 46 band, the antenna performance is better, with efficiencies above 50% as shown in Figure 9. Gain is plotted in the XY plane (the plane of the device screen) for various combinations of antennas. In each case, the antenna gain patterns are designed to radiate away from the center of the device. In Figure 10, the gain for the IA antennas at LTE bands 42/43 are shown and can be seen to have a maximum gain at a 45 degree angle from the antenna which is toward the corner of the device screen. In Figure 11, the gain for the LA antennas in the LTE 42/43 band on the right side of the phone is shown and, in each case, the maximum gain is along the X axis, away from the screen center. In Figure 12, the gain for the SA antennas on the right side of the phone in LTE band 46 is shown with similar characteristics.
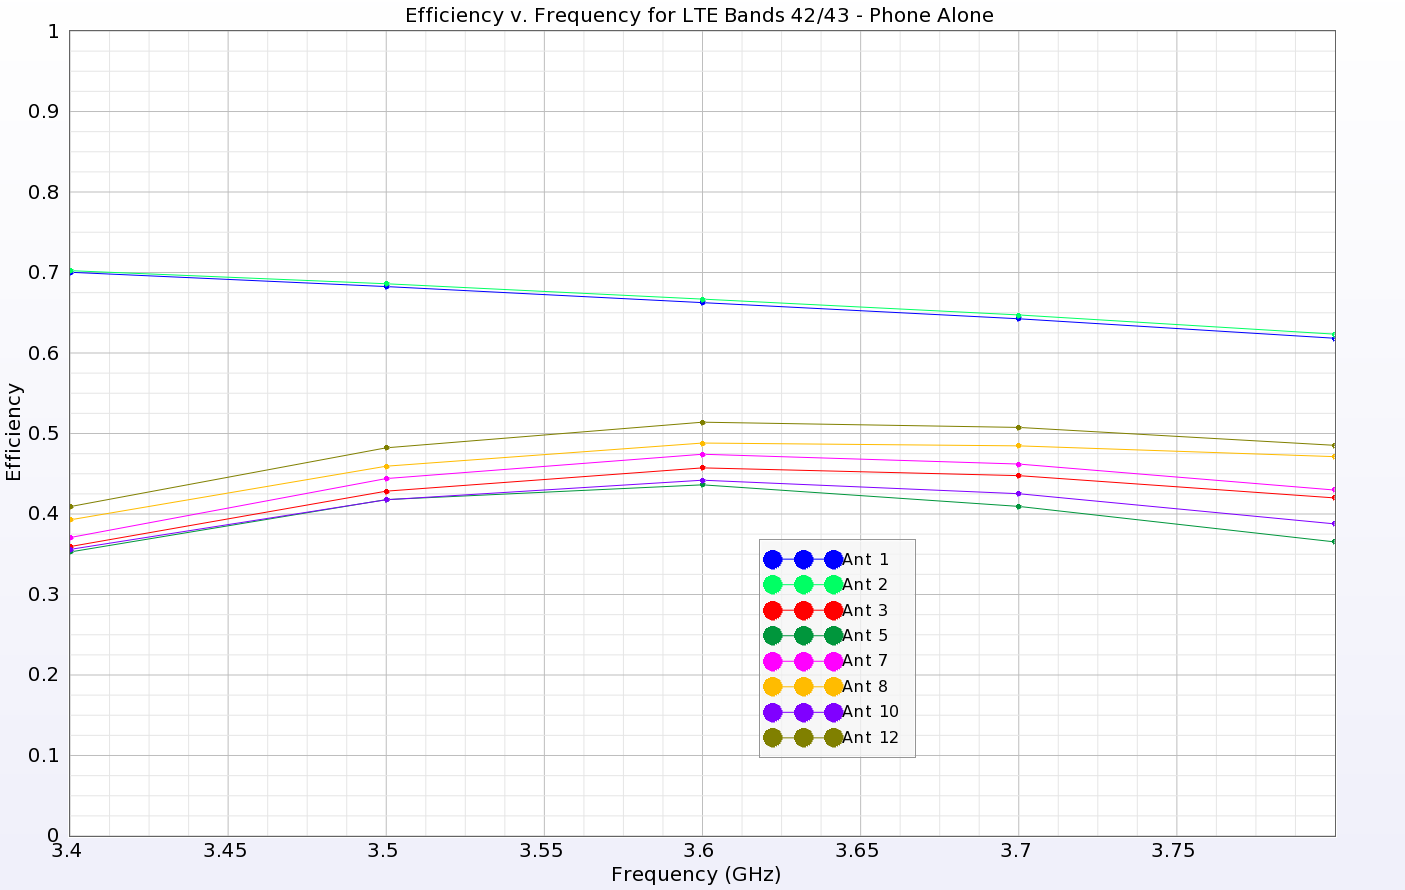
Figure 8: The efficiencies for antennas in the LTE band 42/43 are shown. The two IA antennas at the ends of the phone (1 and 2) show higher efficiency over 60% while the LA antennas on the sides of the phone have lower efficiencies between 35 and 50%.
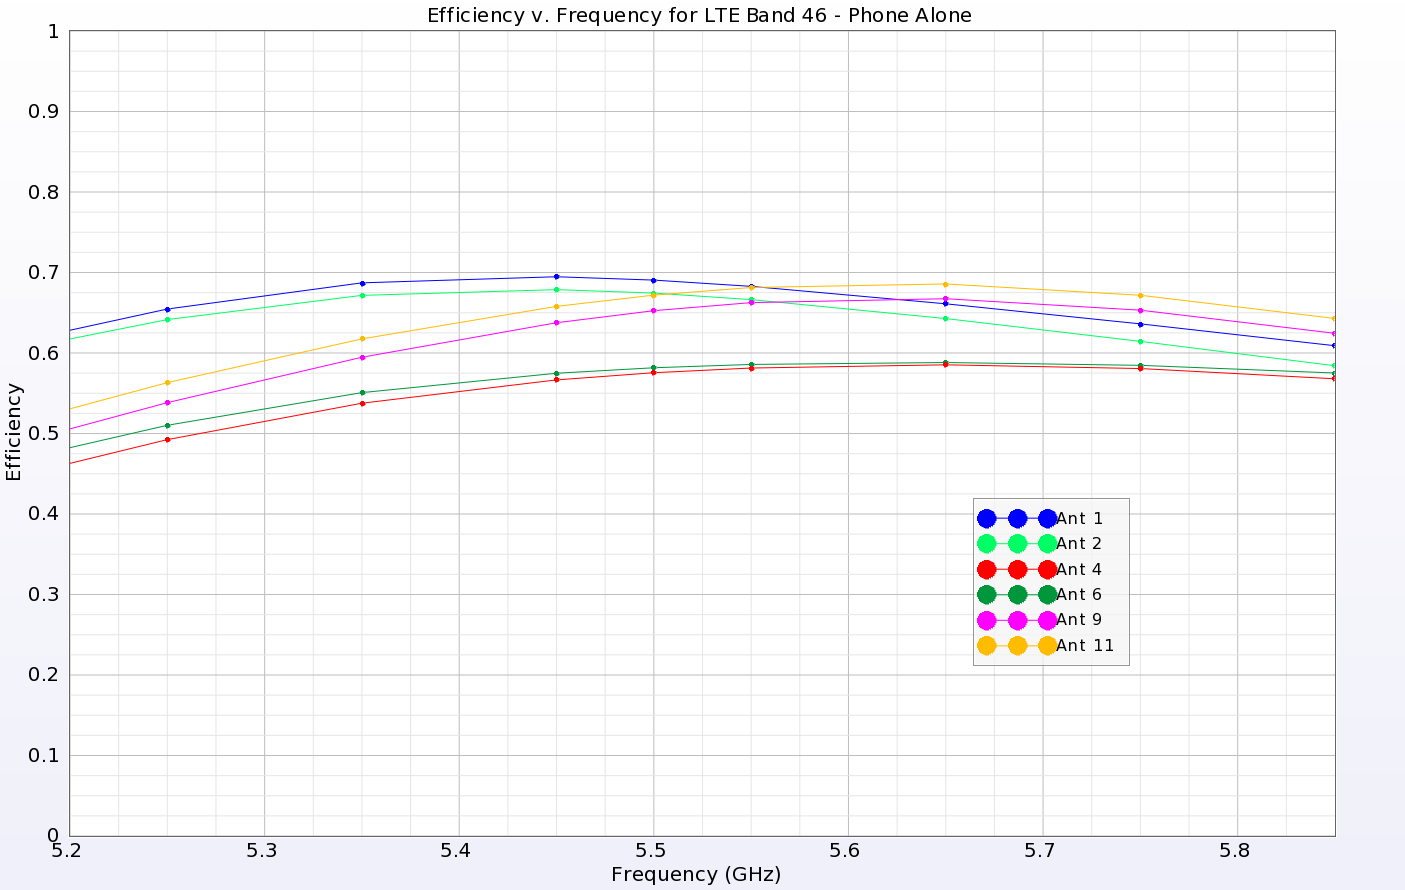
Figure 9: The efficiencies for all antennas in the higher LTE 46 band are above about 50% and show good performance.
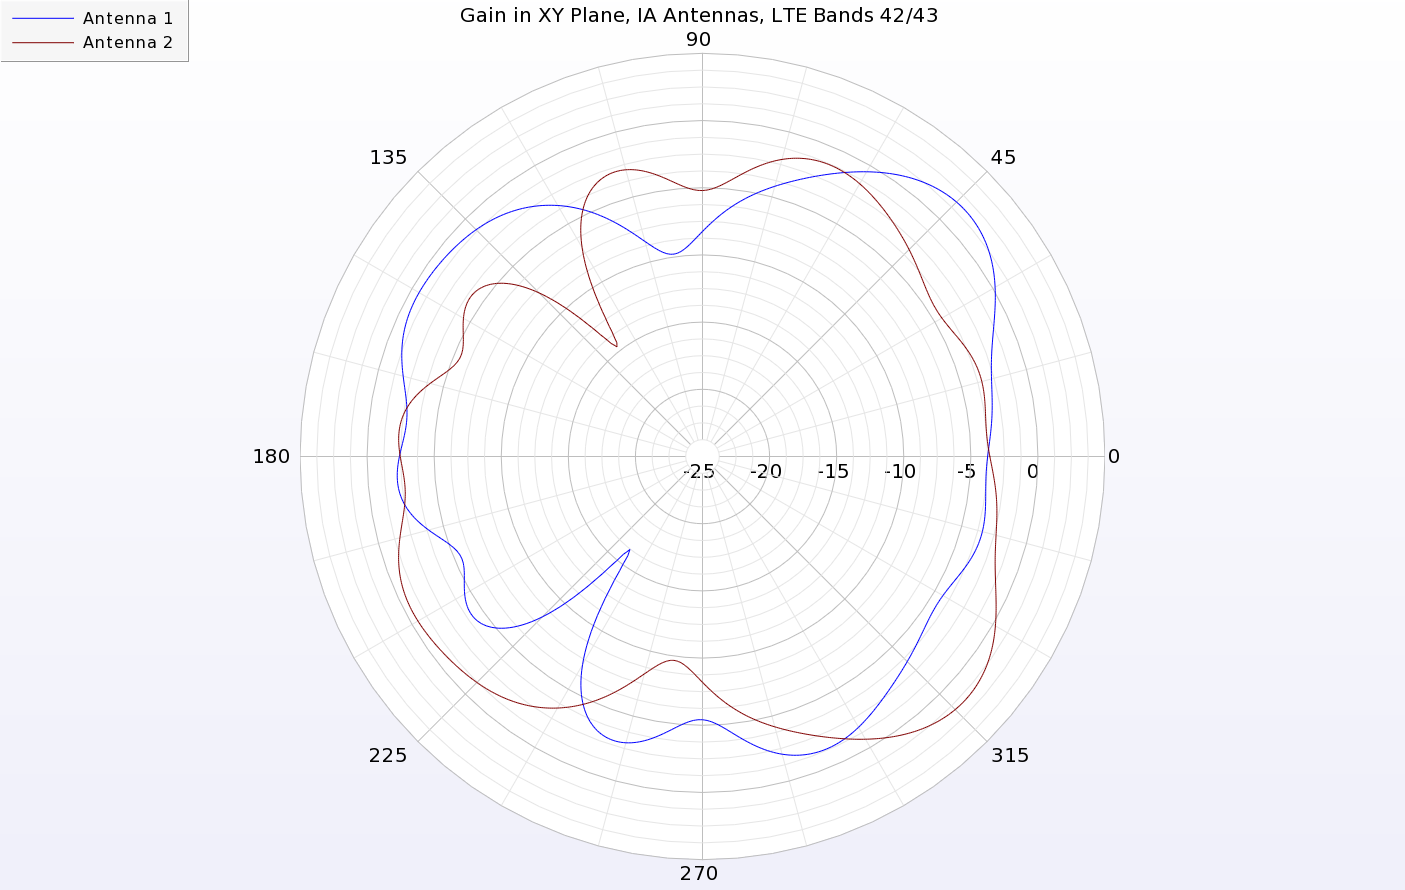
Figure 10: The gain patterns in the XY plane for the two IA antennas show peak gains toward the respective corners of the device.
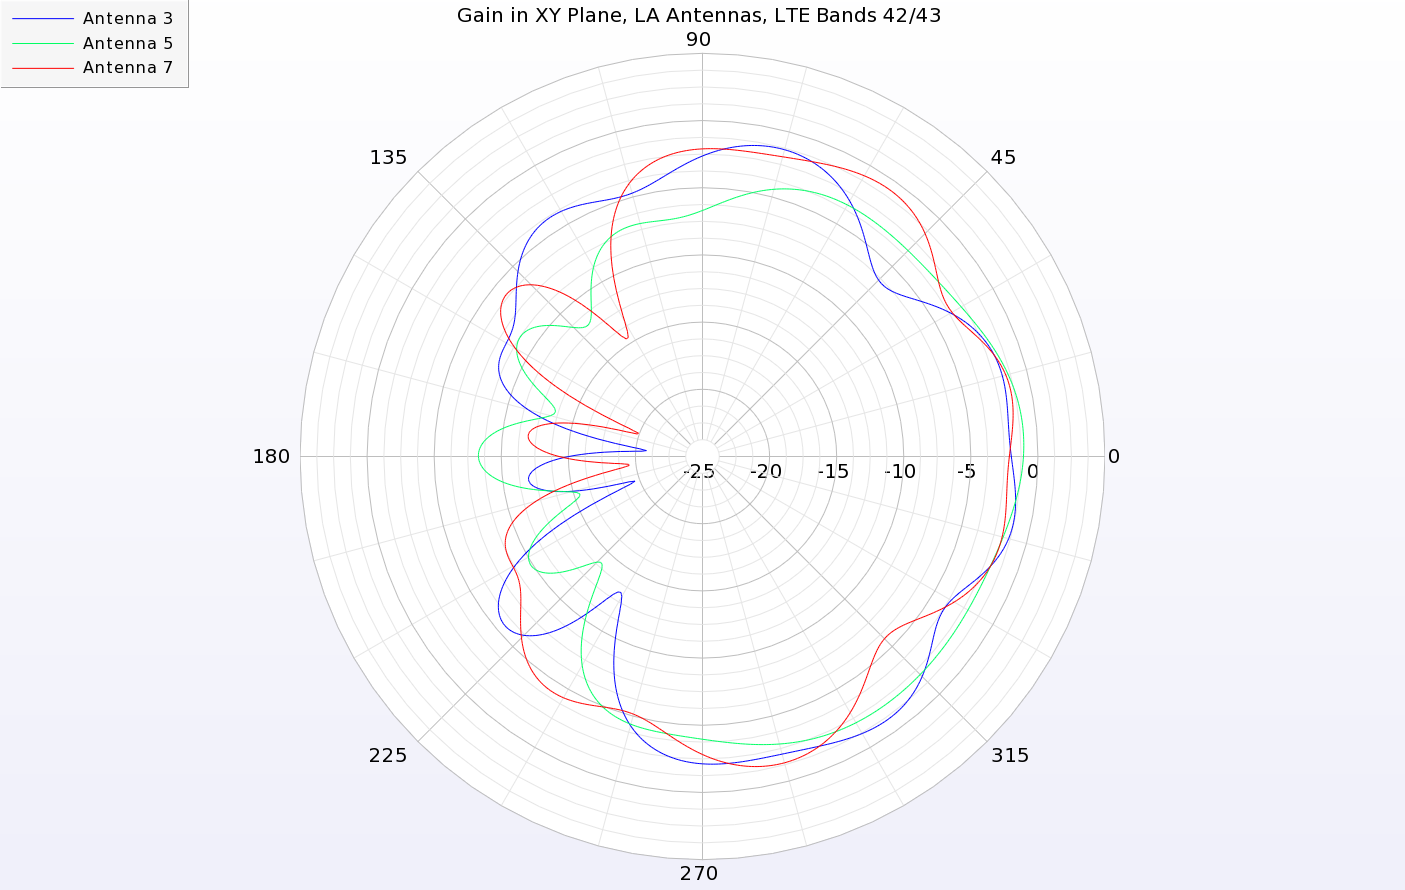
Figure 11: The LA antennas have peak gain toward the outer edge of the device. In this case, the antennas on the right side of the device are shown with peak gain in the +X direction.
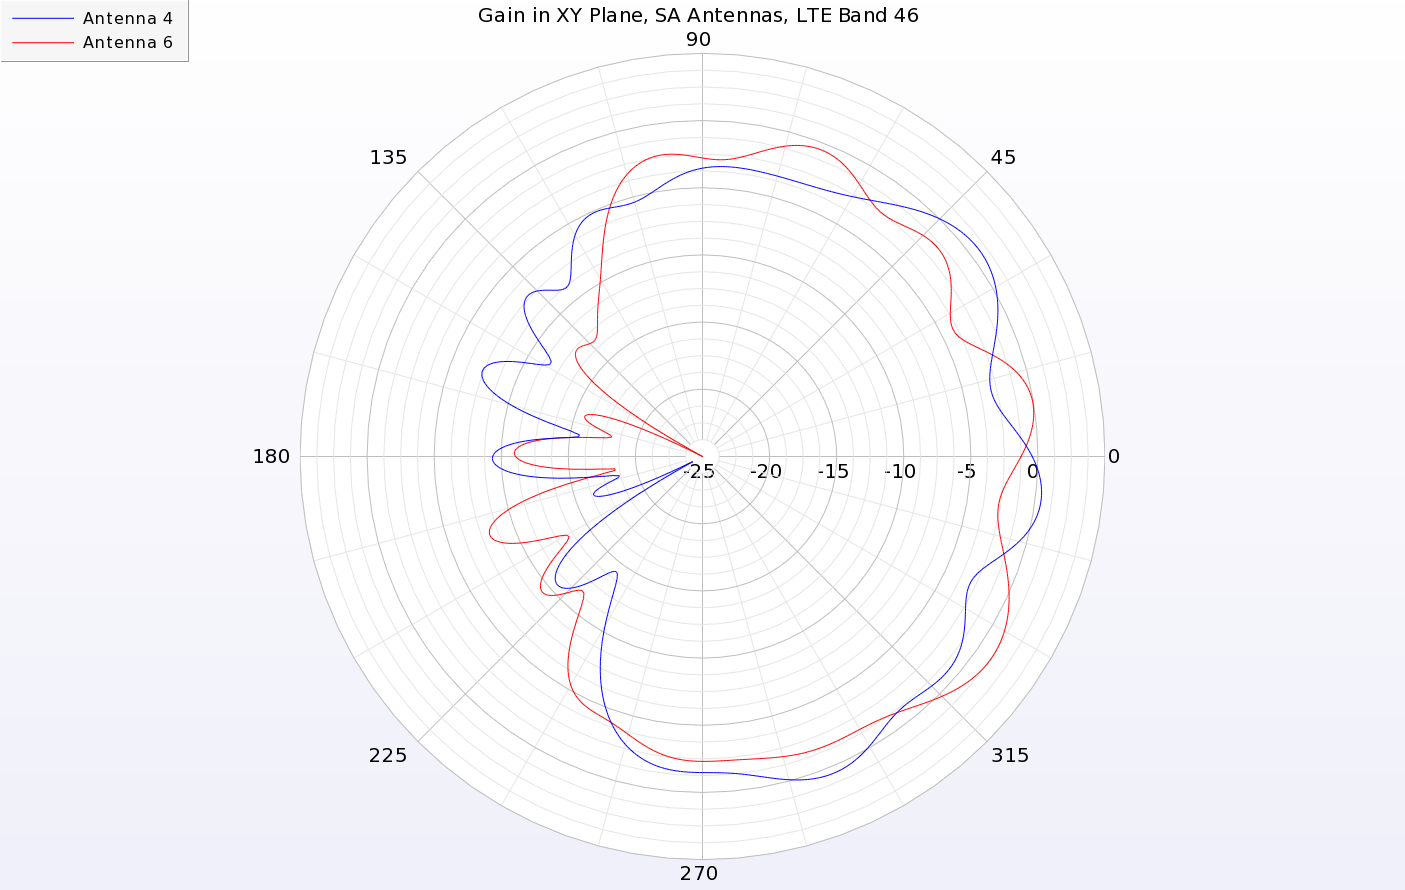
Figure 12: The SA antennas have peak gain toward the outer edge of the device similar to the LA antennas. Here antennas 4 and 6 are shown with peak gain in the +X direction.
To evaluate the diversity performance of antenna pairs, an important measure beyond the isolation is the envelope correction coefficient (ECC). This measure is useful for determining how well a device will work for diversity and multiplexing applications where it is important that individual antennas perform independently from others. The basic criterion for ECC is a value less than 0.5. The ECC for various antenna pairs in the LTE 42/43 band and LTE 46 band are compared in Figures 13 and 14, respectively. All plots are well below the 0.5 limit with the maximum correlation being between Antennas 8 and 10 in the LTE 42/43 band at about 0.15.
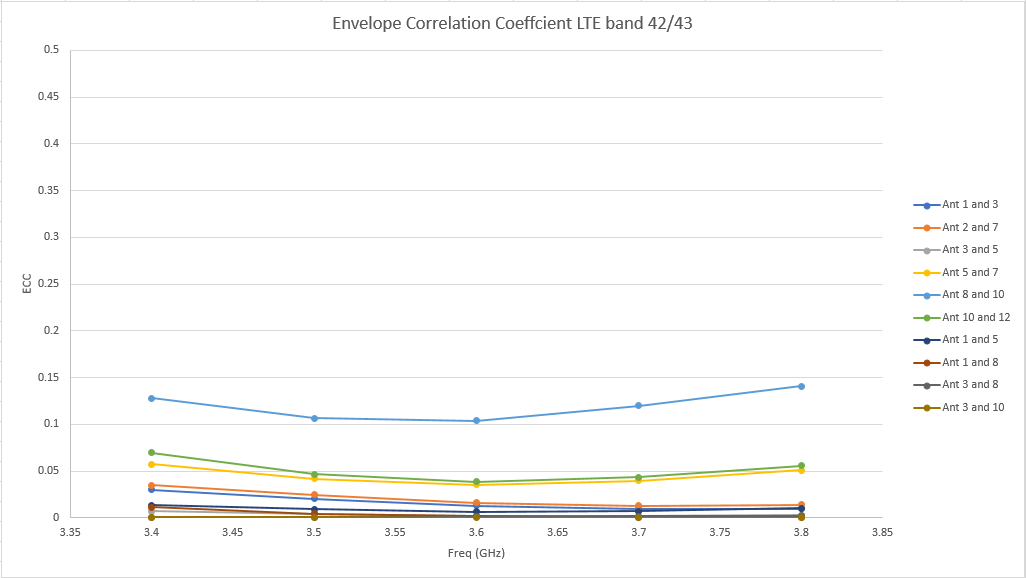
Figure 13: The Envelope Correlation Coefficient (ECC) for the LTE band 42/43 antennas is quite good with a peak value of 0.15.
Simulation with Hands
To further test the phone operation in more realistic conditions, hand models are introduced in both single hand and two hand configurations, as shown in Figure 15. The positions are for left and right hand holds, two hands at the side mode, and two hands with thumbs typing configuration. Depending on the hand position, certain antennas will be covered and the performance will be affected. However, since there are multiple antennas on both sides of the device, in most situations there are still several antennas available with good performance.
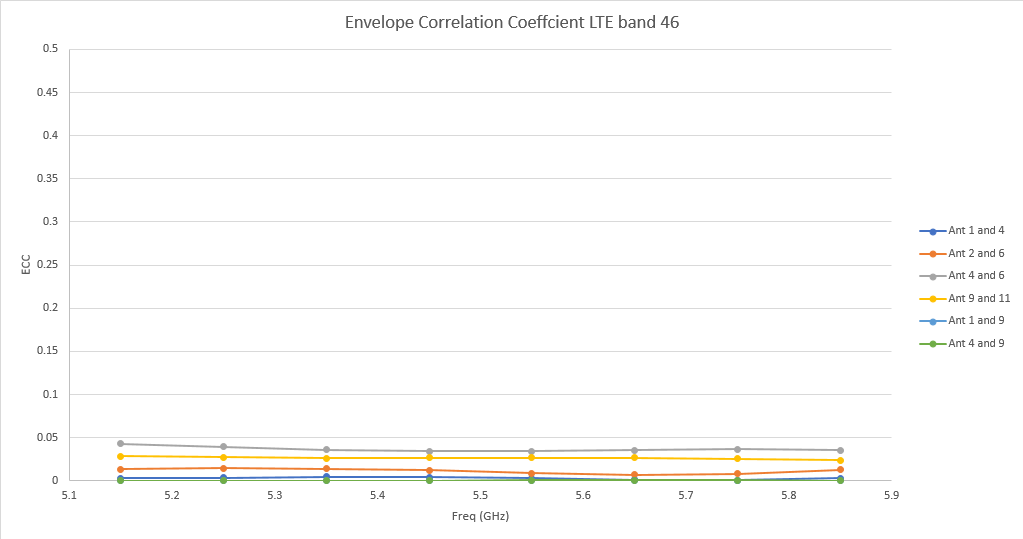
Figure 14: The Envelope Correlation Coefficient (ECC) for the LTE band 46 antennas is very good with no two antennas higher than 0.05.
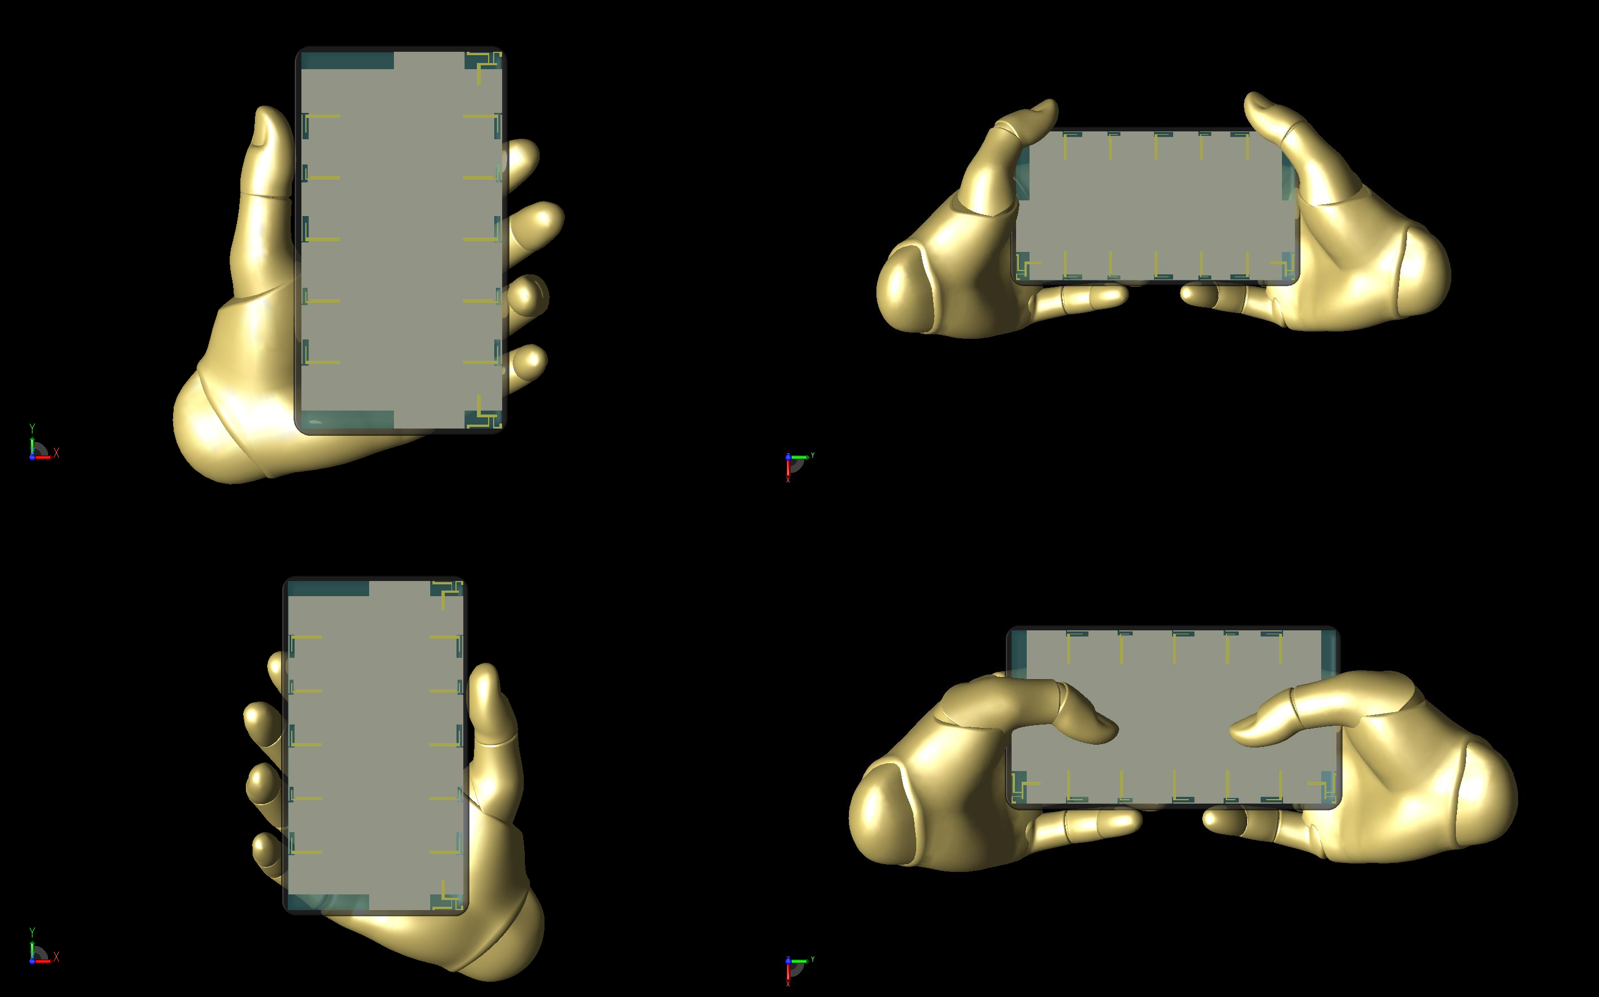
Figure 15: Shown are the four positions of the Poseable Hand model used in the study, which were positioned using controls within XFdtd. Clockwise from top left: left hand hold, two hands at sides, two hands typing, and right hand hold.
The S-parameter performance remains good for all hand positions, although in some cases the return loss is significantly affected. For example, in Figure 16 the return loss for the LTE band 42/43 antennas is shown for the left and right hold positions and there is are noticeable difference versus the phone alone return loss shown in Figure 5. Similarly, the SA antennas operating in the LTE band 46 are also changed by the left and right hand hold positions as shown in Figure 17. For the two hand hold positions, there is less disruption to the S-parameters for the same antennas since the hands are not directly covering the antennas, as shown in Figures 18 and 19.
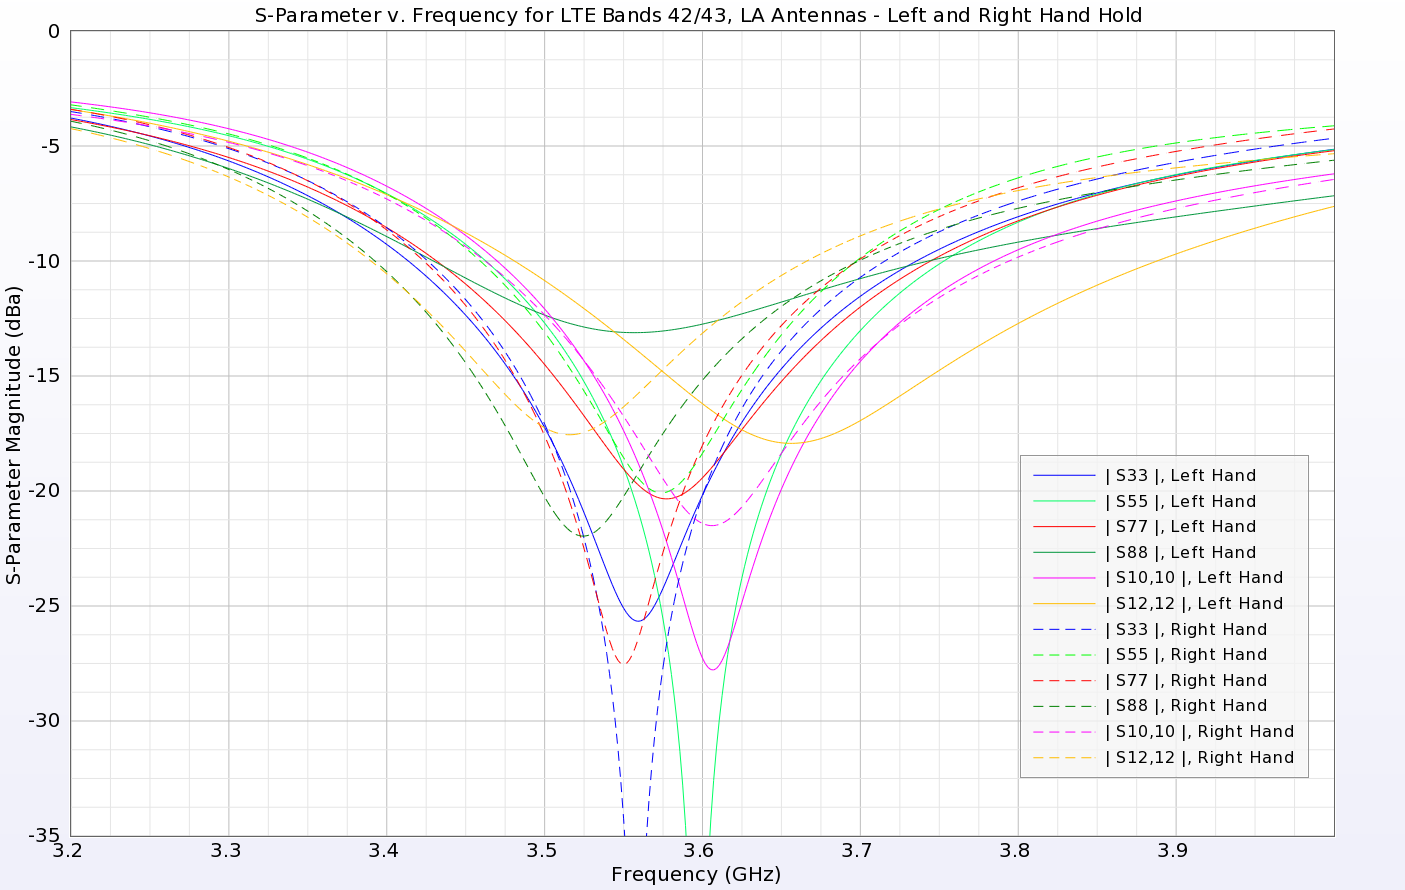
Figure 16: With the left and right hands holding the phone, the return loss results for the LTE band 42/43 antennas are changed but still good enough.
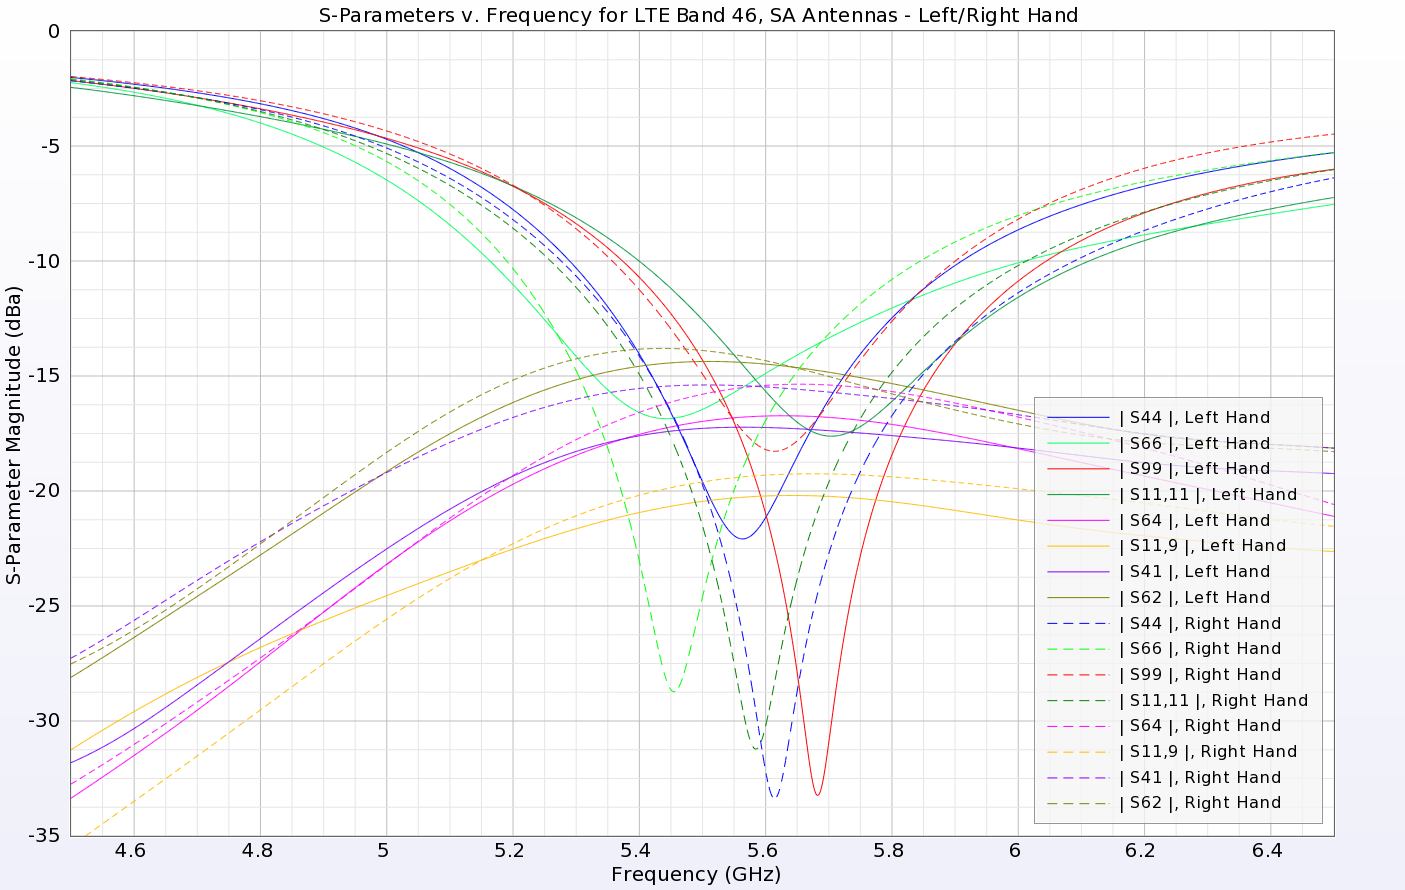
Figure 17: With the left and right hands holding the phone, the return loss and isolation remain acceptable for the LTE band 46 antennas.
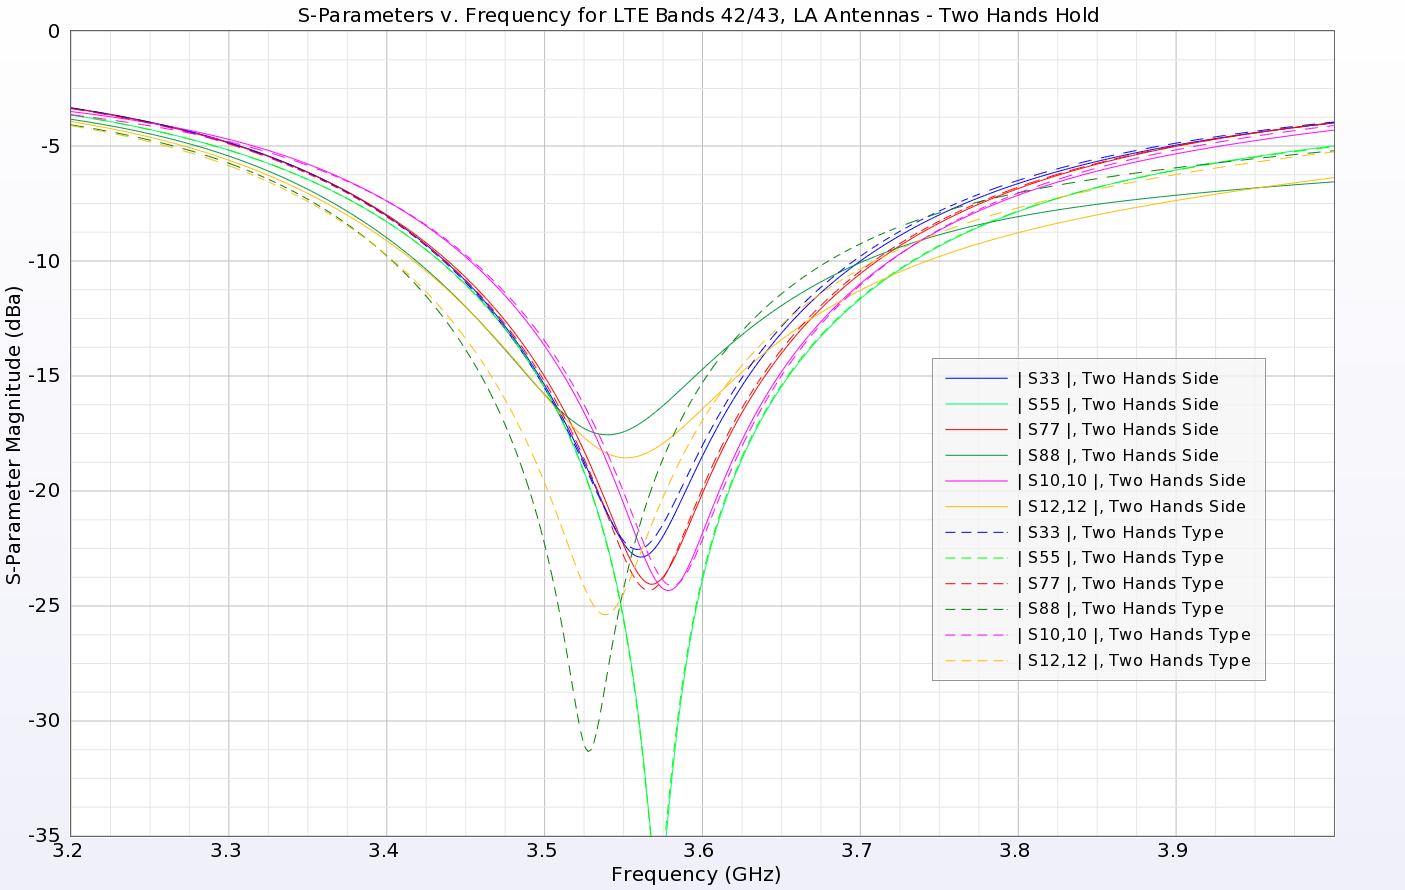
Figure 18: In the two hand configurations, the return loss in the LTE 42/43 band is only slightly changed and remains acceptable.
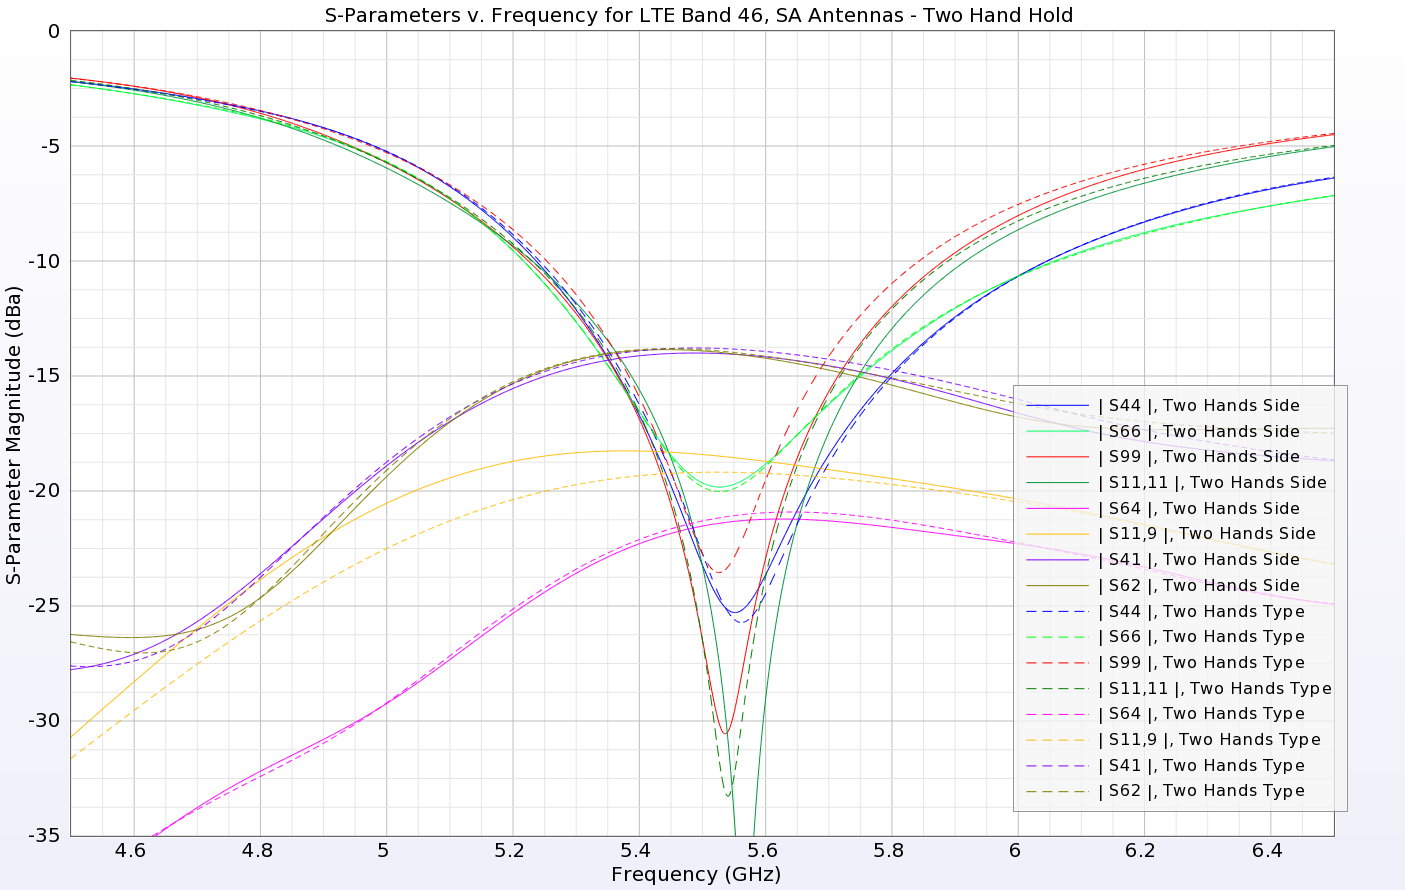
Figure 19: At the higher LTE band 46, the two hand configurations have only slight impacts on the return loss and isolation.
As can be expected, the efficiency is greatly affected by the presence of the hands. The patterns are disrupted and power is lost in the hand tissue resulting in worse performance. An extreme example is shown in Figure 20 for the case of the two hands at the sides in LTE bands 42/43 where the peak efficiency is only around 35%. Other cases studied had better performance.
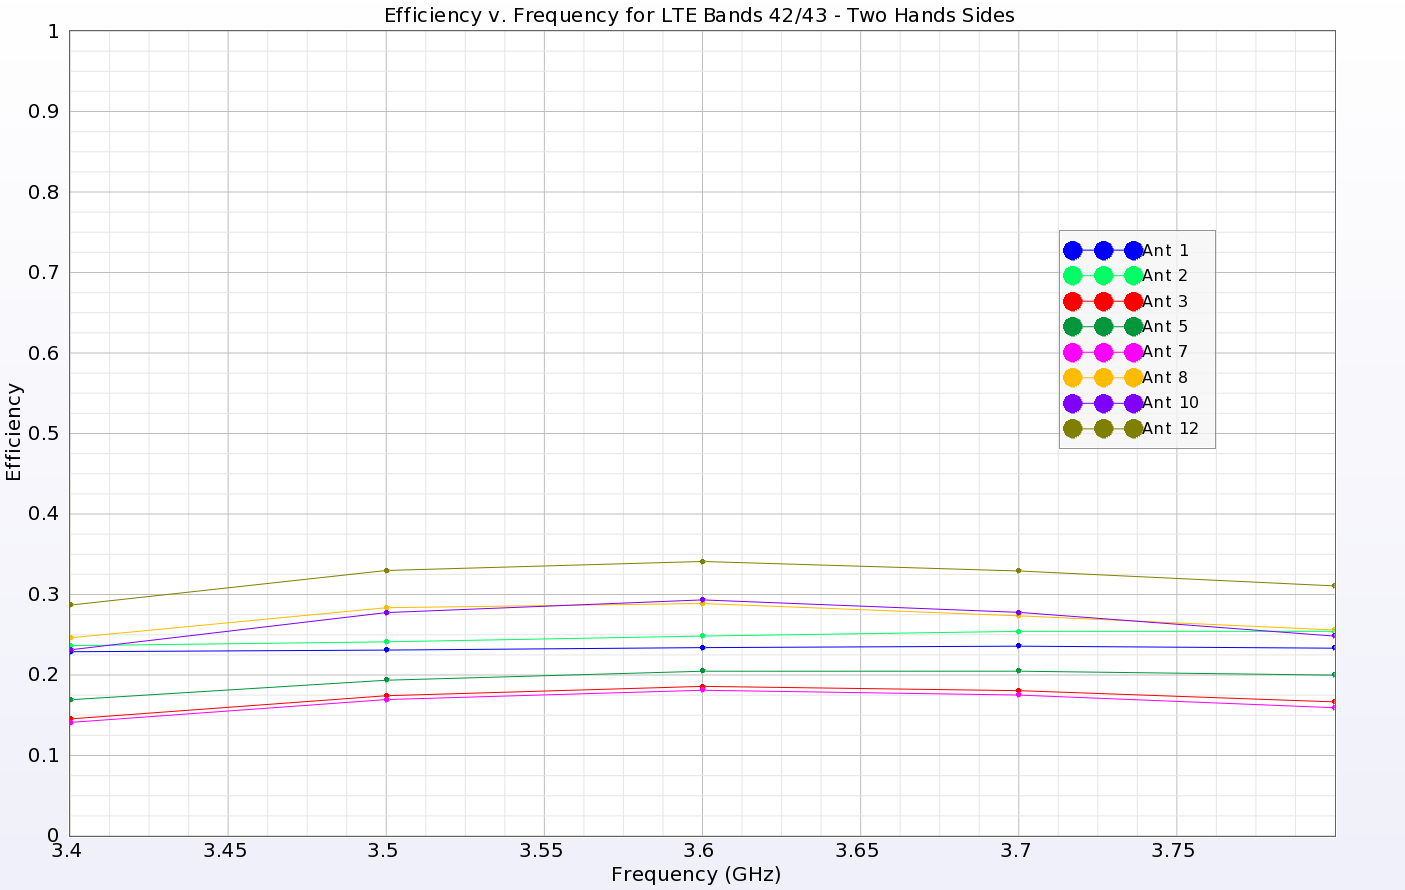
Figure 20: Efficiency is greatly affected by the hands on the phone. Here the efficiency for LTE bands 42/43 for the two hands at sides case is shown with no antenna above 35% efficiency.
The gain patterns are understandably impacted by the hand positions on the phone. Figure 21 shows the three-dimensional patterns of the six LA antennas at LTE bands 42/43 in the case of the phone alone. When the left hand is holding the phone, as shown in Figure 22, some of the patterns, particularly antenna 10 by the thumb, are greatly impacted and show much less gain. For the higher frequency LTE band 46 SA antennas on the sides, there are fairly uniform patterns when the device is alone, such as in Figure 23. With the hands at the sides and the finger next to the two bottom antennas, as in Figure 24, the patterns on the bottom antennas (4 and 6) are reduced compared to the top antennas (9 and 11). For the two hand typing configuration and the same antennas, the top antennas show an increase in gain due to the presence of the thumbs in the middle of the screen as shown in Figure 25. In summary, the peak gains for all configurations are detailed in Tables 1 and 2.
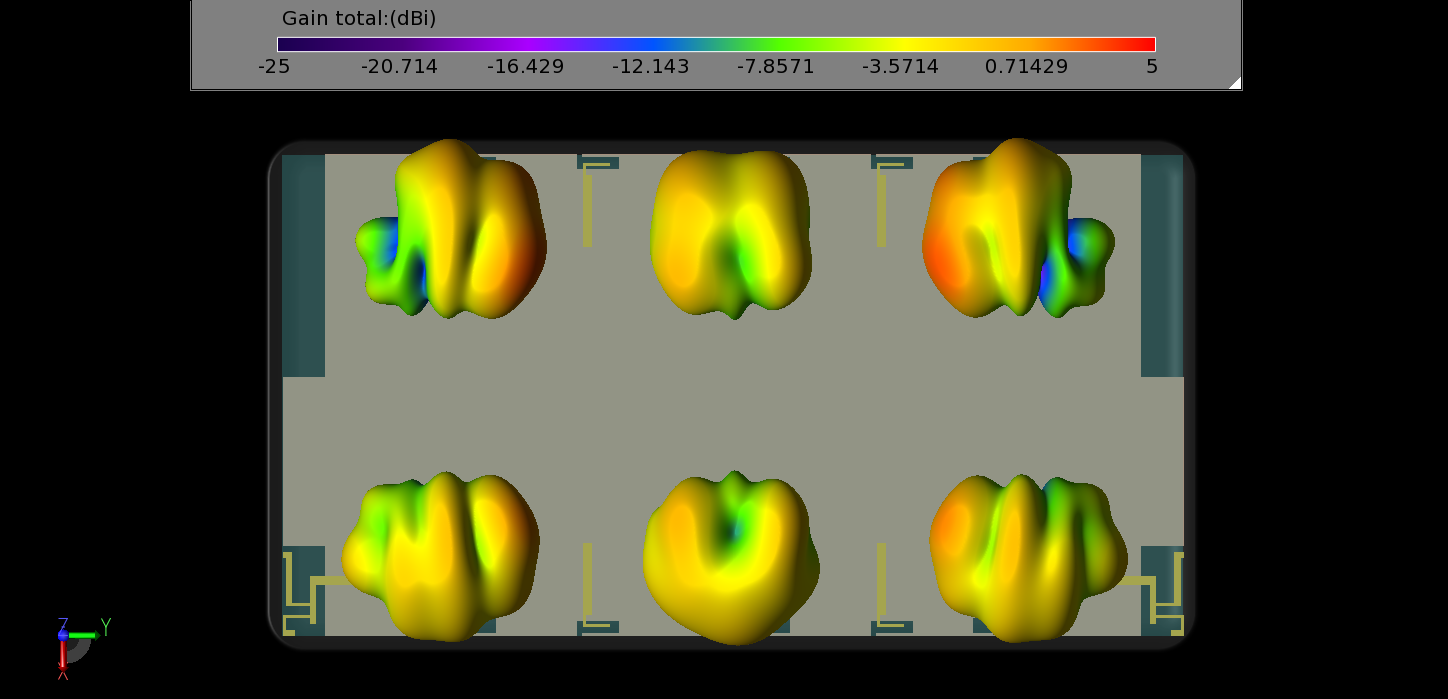
Figure 21: Three-dimensional gain patterns of the six LA antennas are shown at 3.6 GHz (LTE bands 42/43) for the case of the device alone in free space. Each antenna is radiating a pattern with peak gain to the outer edges of the device as desired.
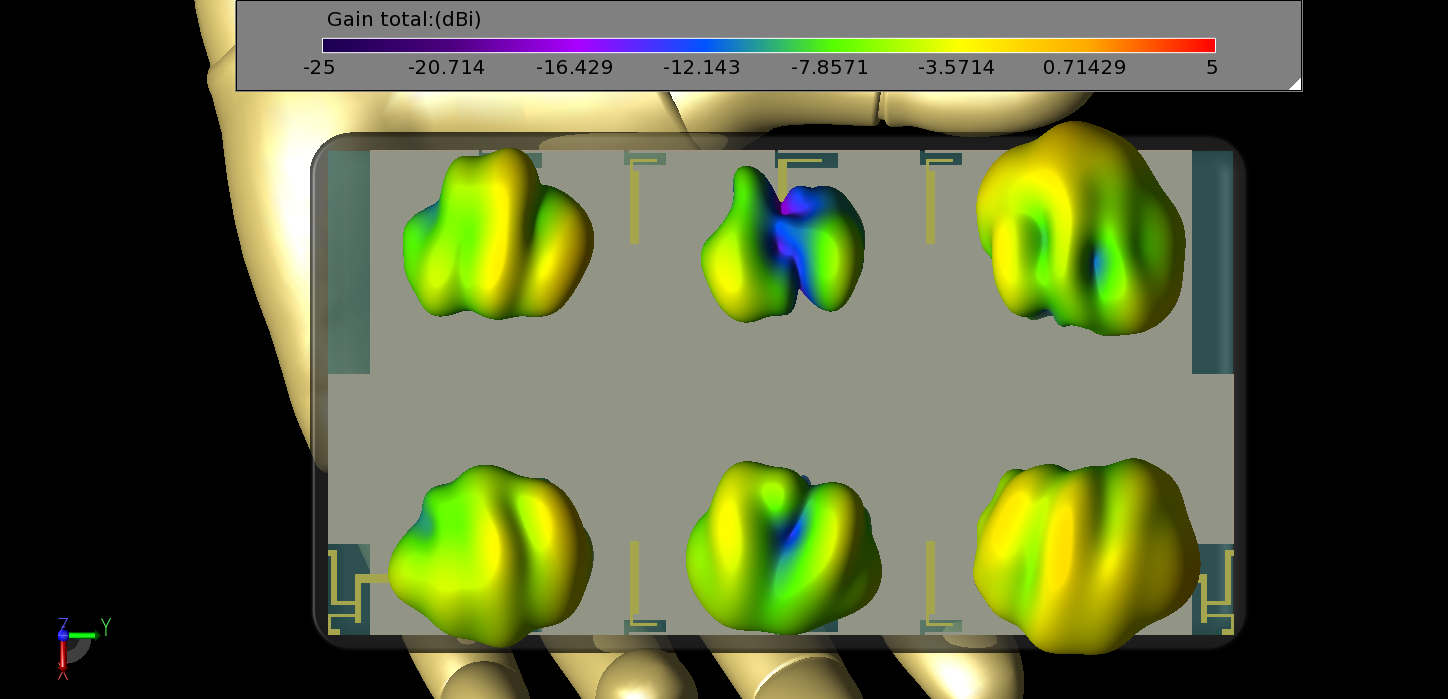
Figure 22: With the left hand holding the phone in LTE band 42/43, the gain patterns are modified and the center pattern under the thumb (antenna 10) is greatly reduced in gain.
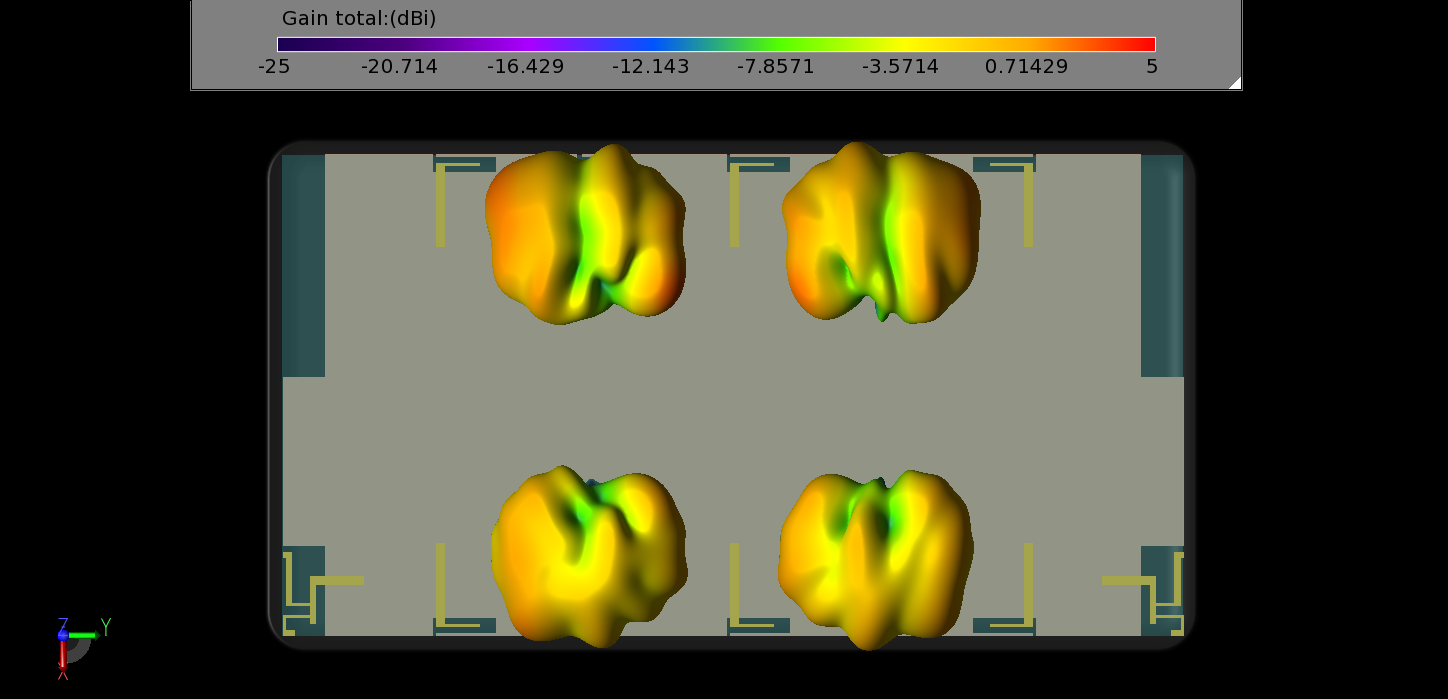
Figure 23: In LTE band 46, the three-dimensional gain patterns are shown with peak gain toward the outside of the device.
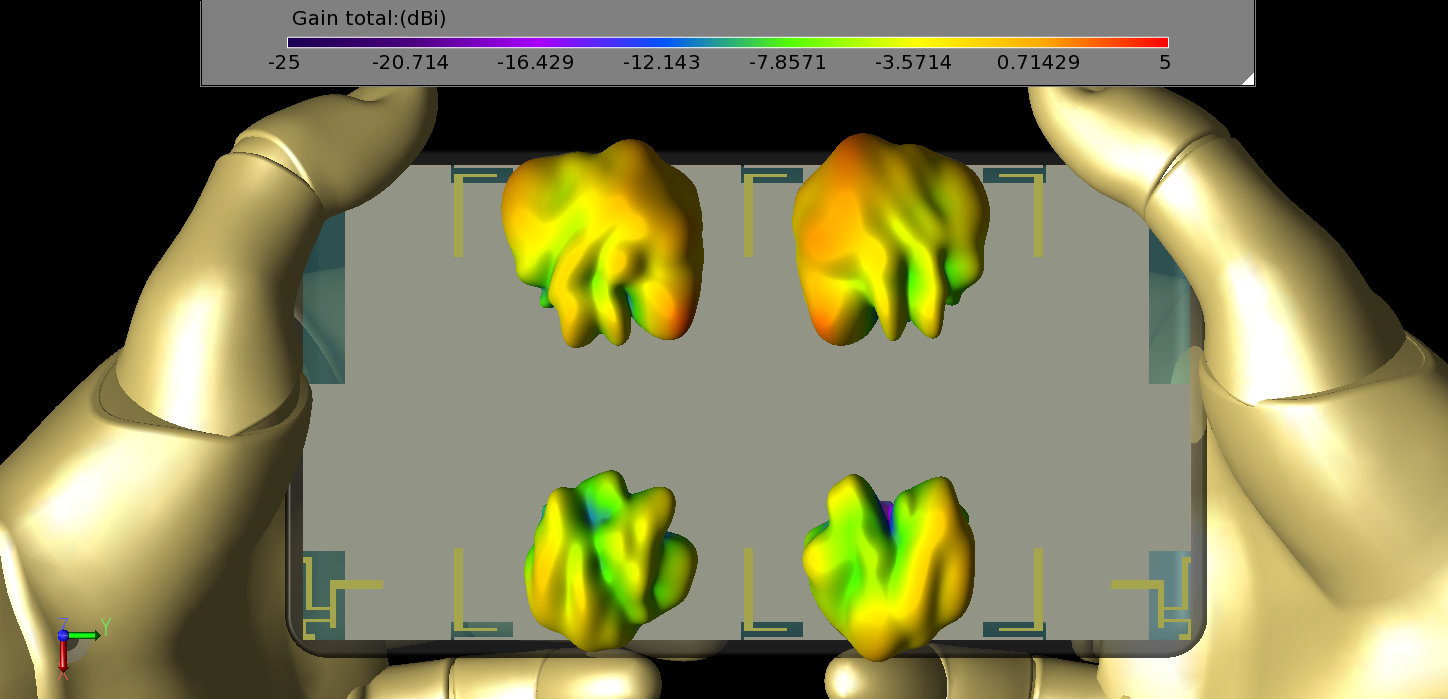
Figure 24: In the two hands at side position in LTE band 46, the gain patterns at the bottom of the phone (antennas 4 and 6) are disturbed by the presence of the fingers and are reduced compared to the upper patterns.
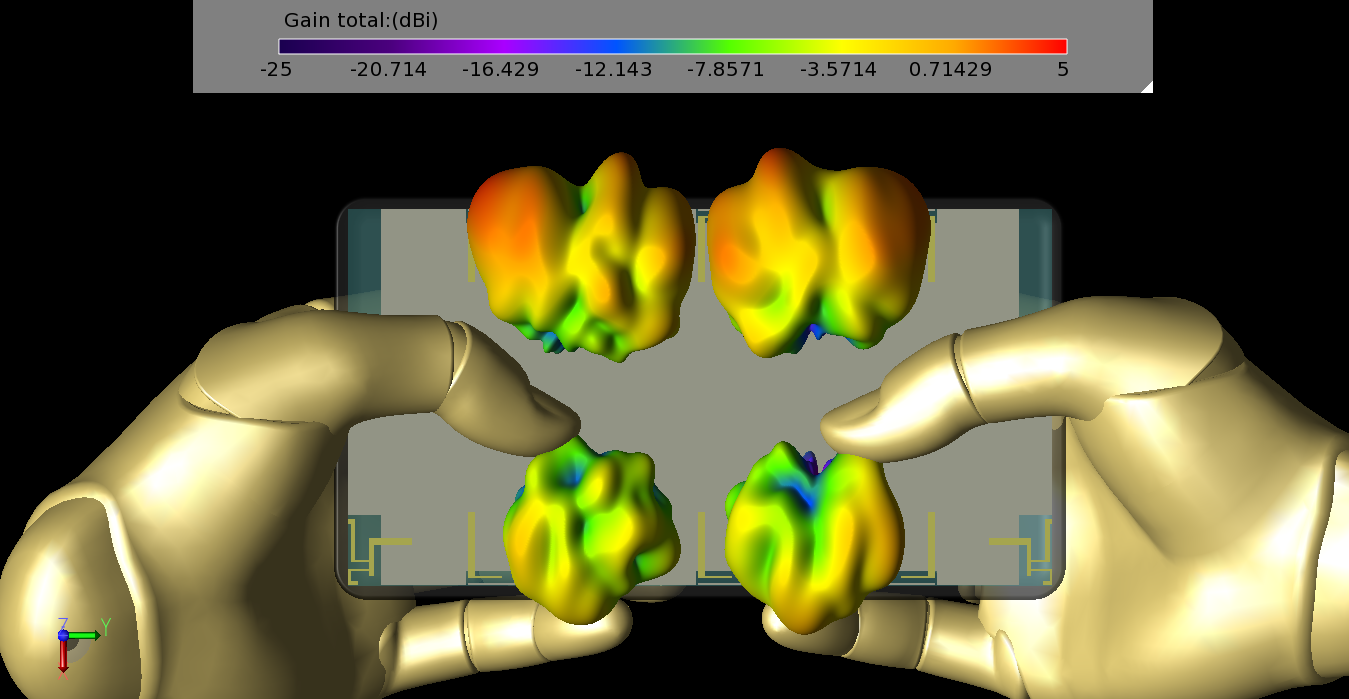
Figure 25: In the two hand typing configuration in LTE band 46 the upper patterns (antennas 9 and 11) are enhanced by the impact of the thumbs with give a reflector effect.
 Table 1: The peak gains for each antenna at 3.6 GHz (LTE bands 42/43) are shown for the five configurations.

Table 2: The peak gains for each antenna at 5.5 GhHz (LTE band 46) are shown for the five configurations.
As can be expected, the ECC results are also affected by the presence of the hands. In all cases though, the ECC remains well below the 0.5 threshold as desired. The worst-case ECC results are for the left and right hand hold positions in the LTE band 42/43 antennas where the ECC can reach as high as 0.4 as shown in Figures 26 and 27. All cases in LTE band 46 remain with an ECC below 0.2.
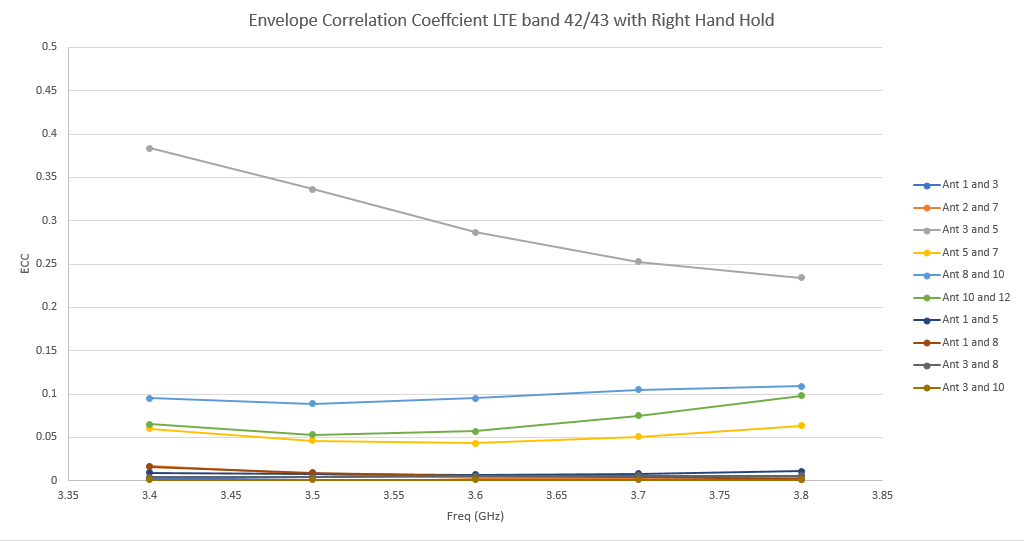
Figure 26: The worst-case ECC is shown for the right hand hold case at LTE bands 42/43 where the correlation between antennas 3 and 5 reaches as high as 0.4. This is still below the threshold of 0.5.
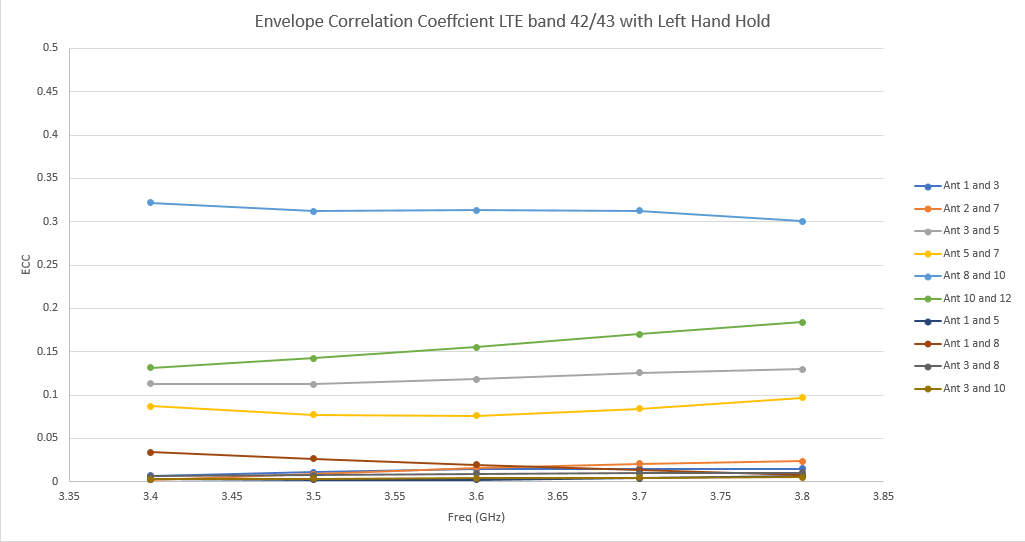
Figure 27: In the left hand hold position at LTE bands 42/43, the ECC is highest for antennas 8 and 10 with a peak level around 0.33.
The 12-port antenna can be seen to deliver very good performance with a variety of use configurations. While some hand placements degrade the performance of antennas that are covered, there are other antennas available to maintain operation.
Reference:
[1] Yixin Li, Chow-Yen-Desmond Sim, Yong Luo, and Guangli Yang, “12-Port 5G Massive MIMO Antenna Array in Sub-6GHz Mobile Handset for LTE Bands 42/43/46 Applications,” IEEE Access vol. 6, pp. 344-354, 2018.

