Wireless InSite’s Communication System Analyzer provides capabilities for assessing the performance of LTE, WiMAX, 802.11n, and 802.11ac systems. These systems can contain multiple transmitters and receiver sets. Users can adjust the noise and interference levels in the scene and generate useful performance metrics such as throughput, throughput cutoff, and capacity.
The following example investigates WiFi throughput coverage in a house provided by 802.11ac routers operating at 5 GHz using an 80 MHz bandwidth. The geometry for the house was imported from a CAD file and a flat terrain was placed underneath the house.
The WiFi routers are modeled as transmitters using short dipole antennas with input powers of 7 dBm. The routers are located on the first and second floors of the house as shown in Figure 1.

Figure 1: Locations of the transmitting routers (red far-field patterns) within the house geometry.
Receiver grids covering the first and second floors were added to capture the behavior of the signal throughout the scene. The receivers use vertically polarized short dipole antennas and are shown in Figure 2.
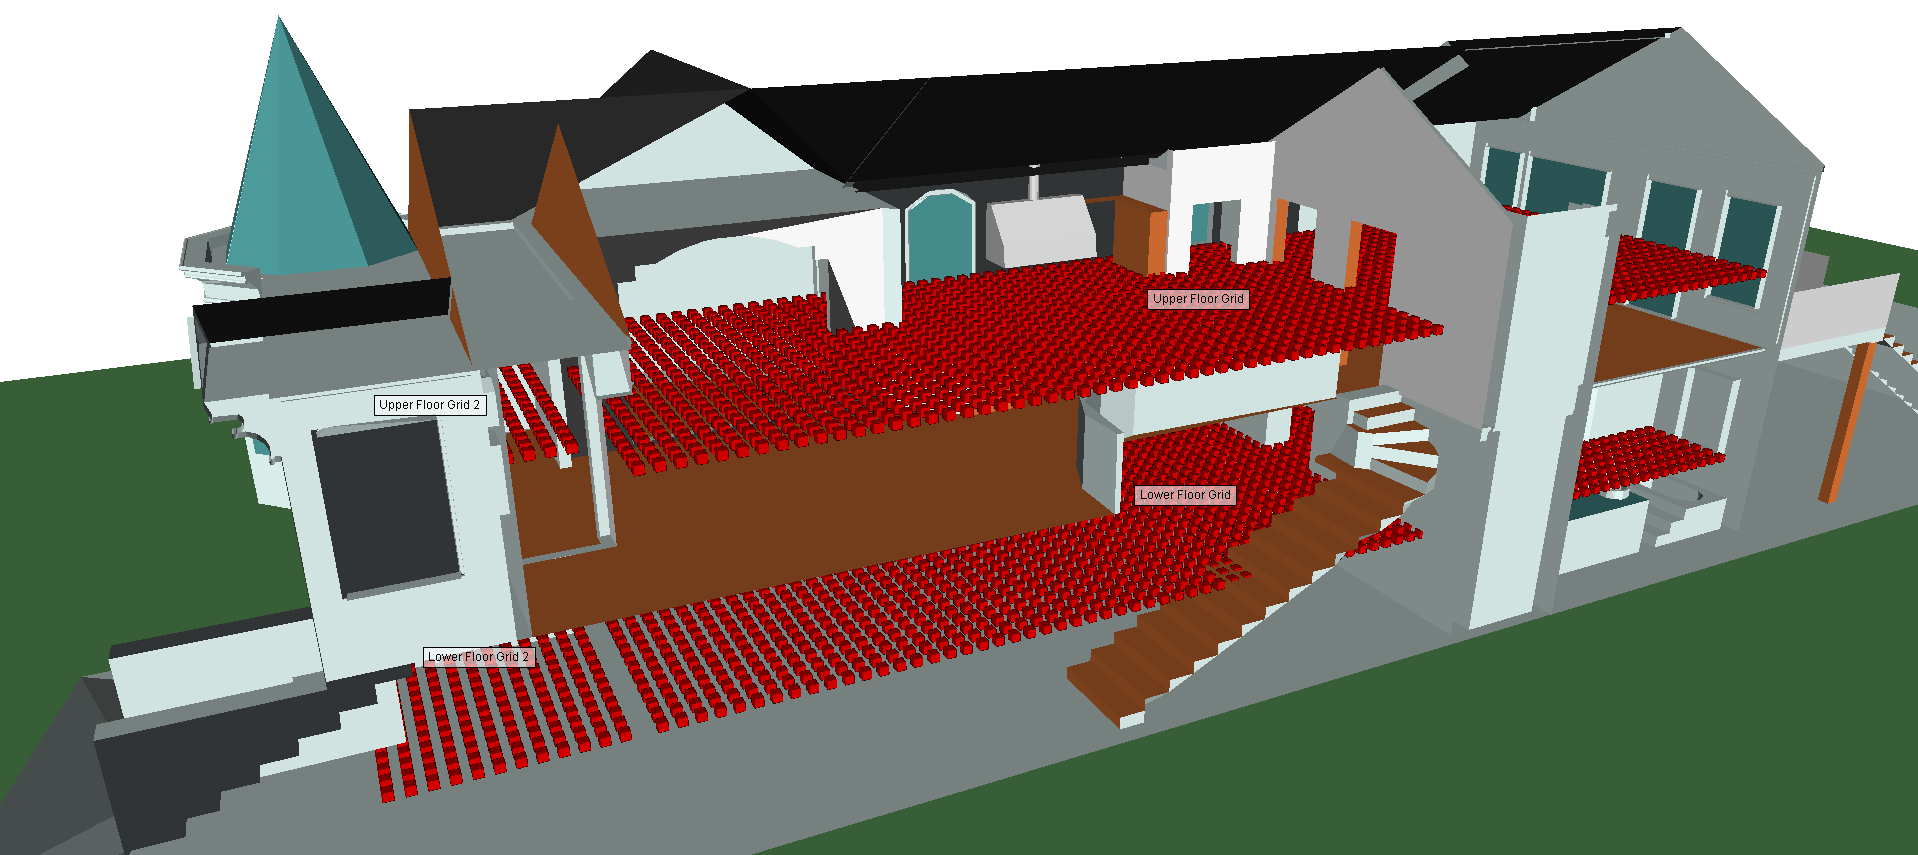
Figure 2: Receiver grid used for studying throughput coverage.
Propagation Simulation
The general propagation calculations for the project were made with the X3D model using three reflections, three transmissions, and one diffraction.
Communication System Definition
Throughput is a post-processed output generated by adding a communication system to a project using New > Communication System. Projects can contain multiple communication systems, making it simple to investigate different configurations of transmitter and receiver or protocols.
To calculate throughput in the house, both transmitters were designated as base stations and all receiver sets were selected to be included in the analysis. After setting the Analysis Type to “Throughput,” the Wireless Access Method was set to 802.11ac and bandwidth set to 80 MHz. The defaults for the Interference and Noise were accepted. Number of Data Streams was left at 1. The Number of Data Streams setting is available for 802.11n and 802.11ac protocols and can be used to estimate the throughput of MIMO systems based on the SISO simulation results.
When communication systems contain multiple transmitters, receivers will establish a link with a single transmitter based on the setting of the “Select Transmitter Based On:” field. For this analysis, “Highest Power” is used as the decision criteria, so an individual receiver will compare the received power from each active transmitter and link to the transmitter providing the highest received power.
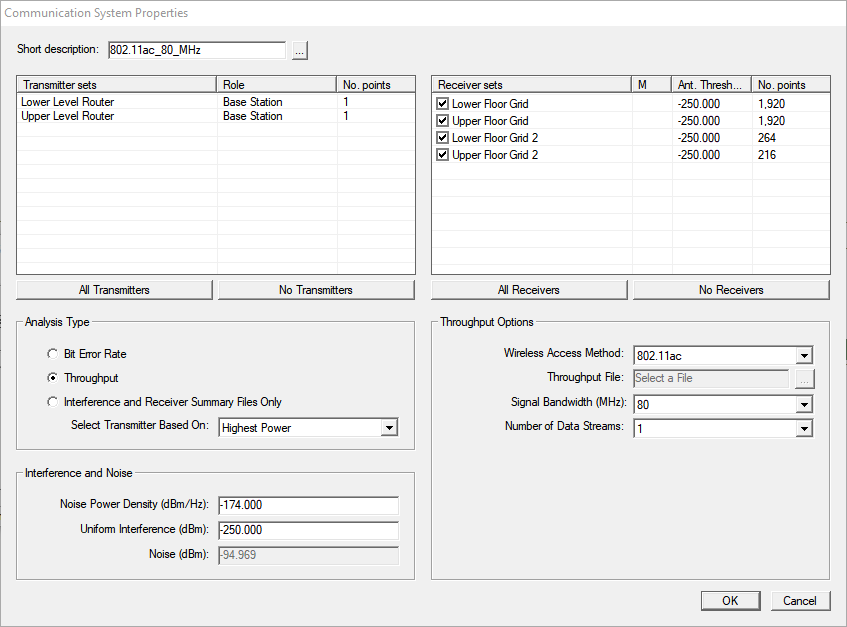
Figure 3: Communication System Properties window.
Running Communication Systems Analysis
Communication System Analysis calculations automatically run for each active study area directly following the propagation model calculation. Alternatively, the analysis can also be run separately using the Calculation > Comm System Analysis run option once initial propagation simulation results are available.
Throughput Results
After the Communication System Analysis completes, outputs from the analysis are available for viewing and plotting. The communication results are located in a subfolder under the study area as shown in Figure 4.
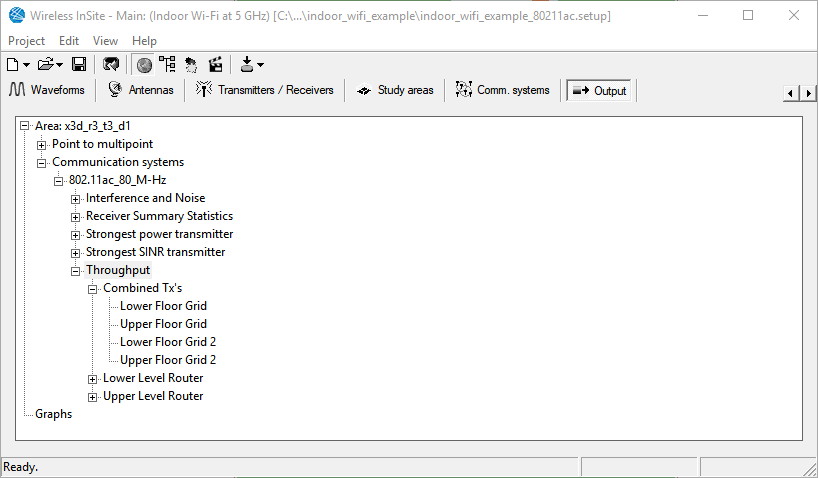
Figure 4: Communication system outputs location in the output tree.
Throughput results are reported for each individual base station in the system and for all the base stations operating together. Figure 5 shows the throughput levels in the house from the lower level transmitter and Figure 6 shows the throughput from the upper level transmitter. The total throughput when both transmitters are operating cooperatively in the communication system is displayed in Figure 7.
The strongest transmitter output, shown in Figure 8, identifies which transmitter the receiver links to.
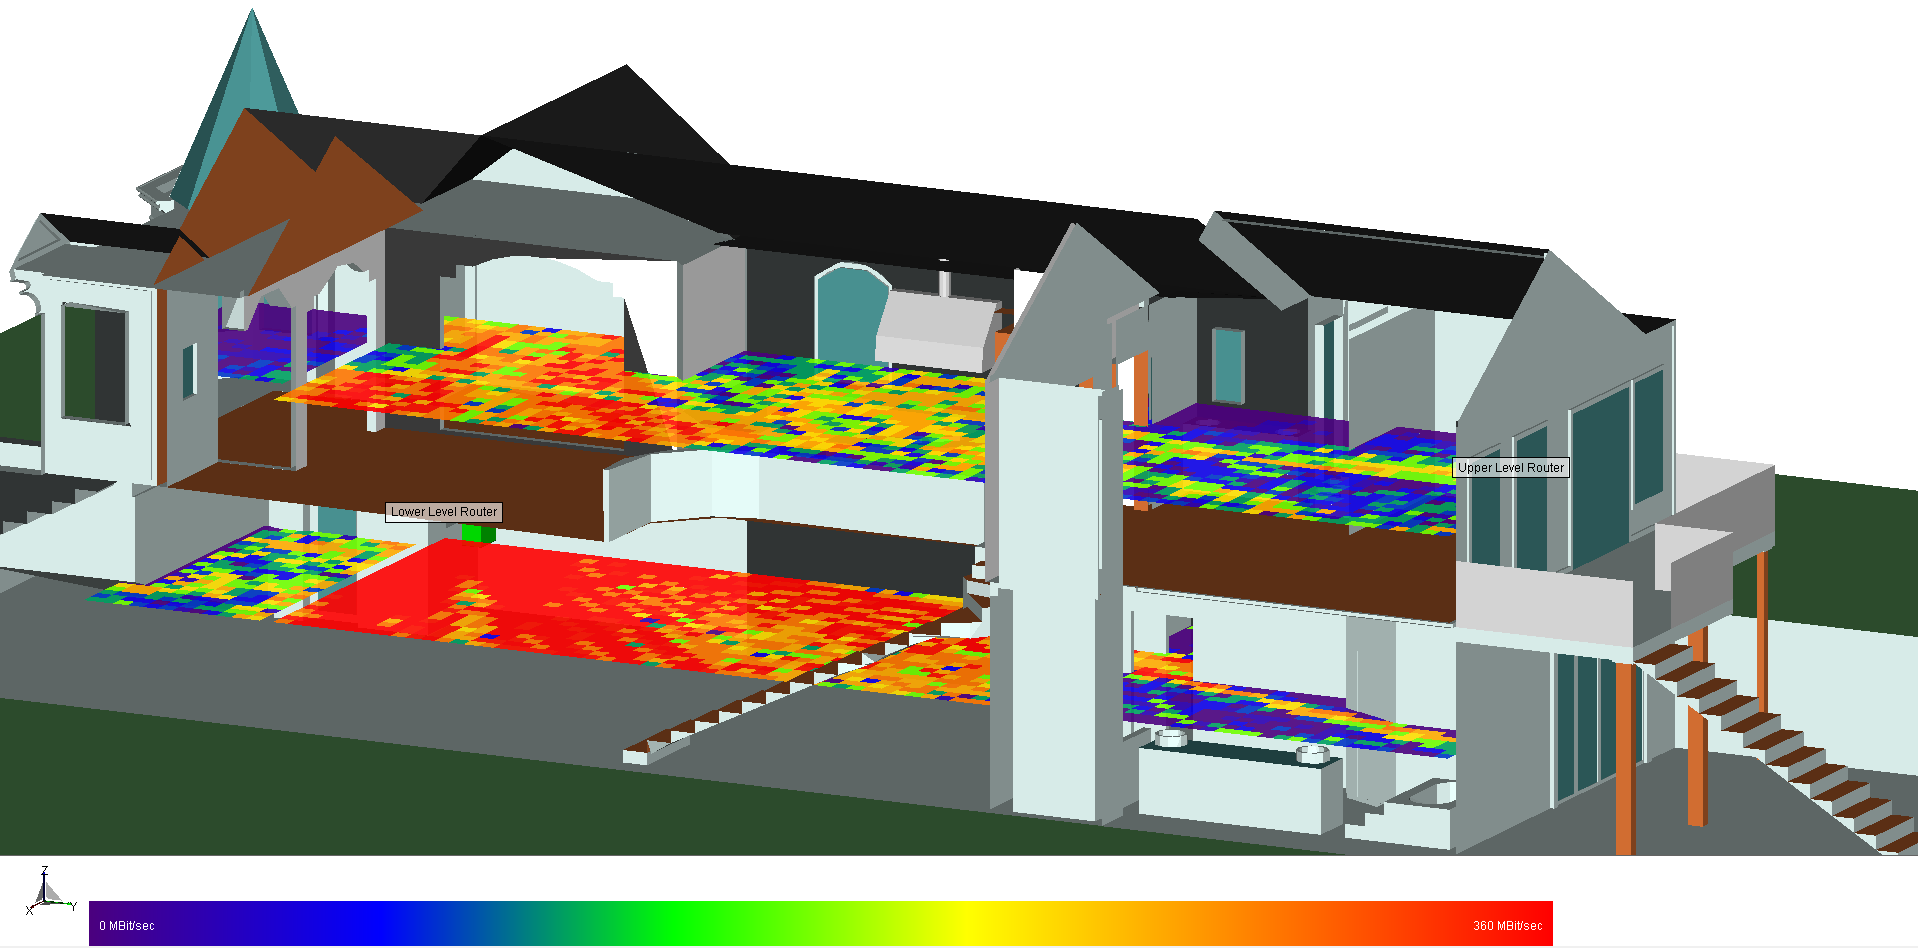
Figure 5: Throughput from lower level transmitter to the coverage grids.
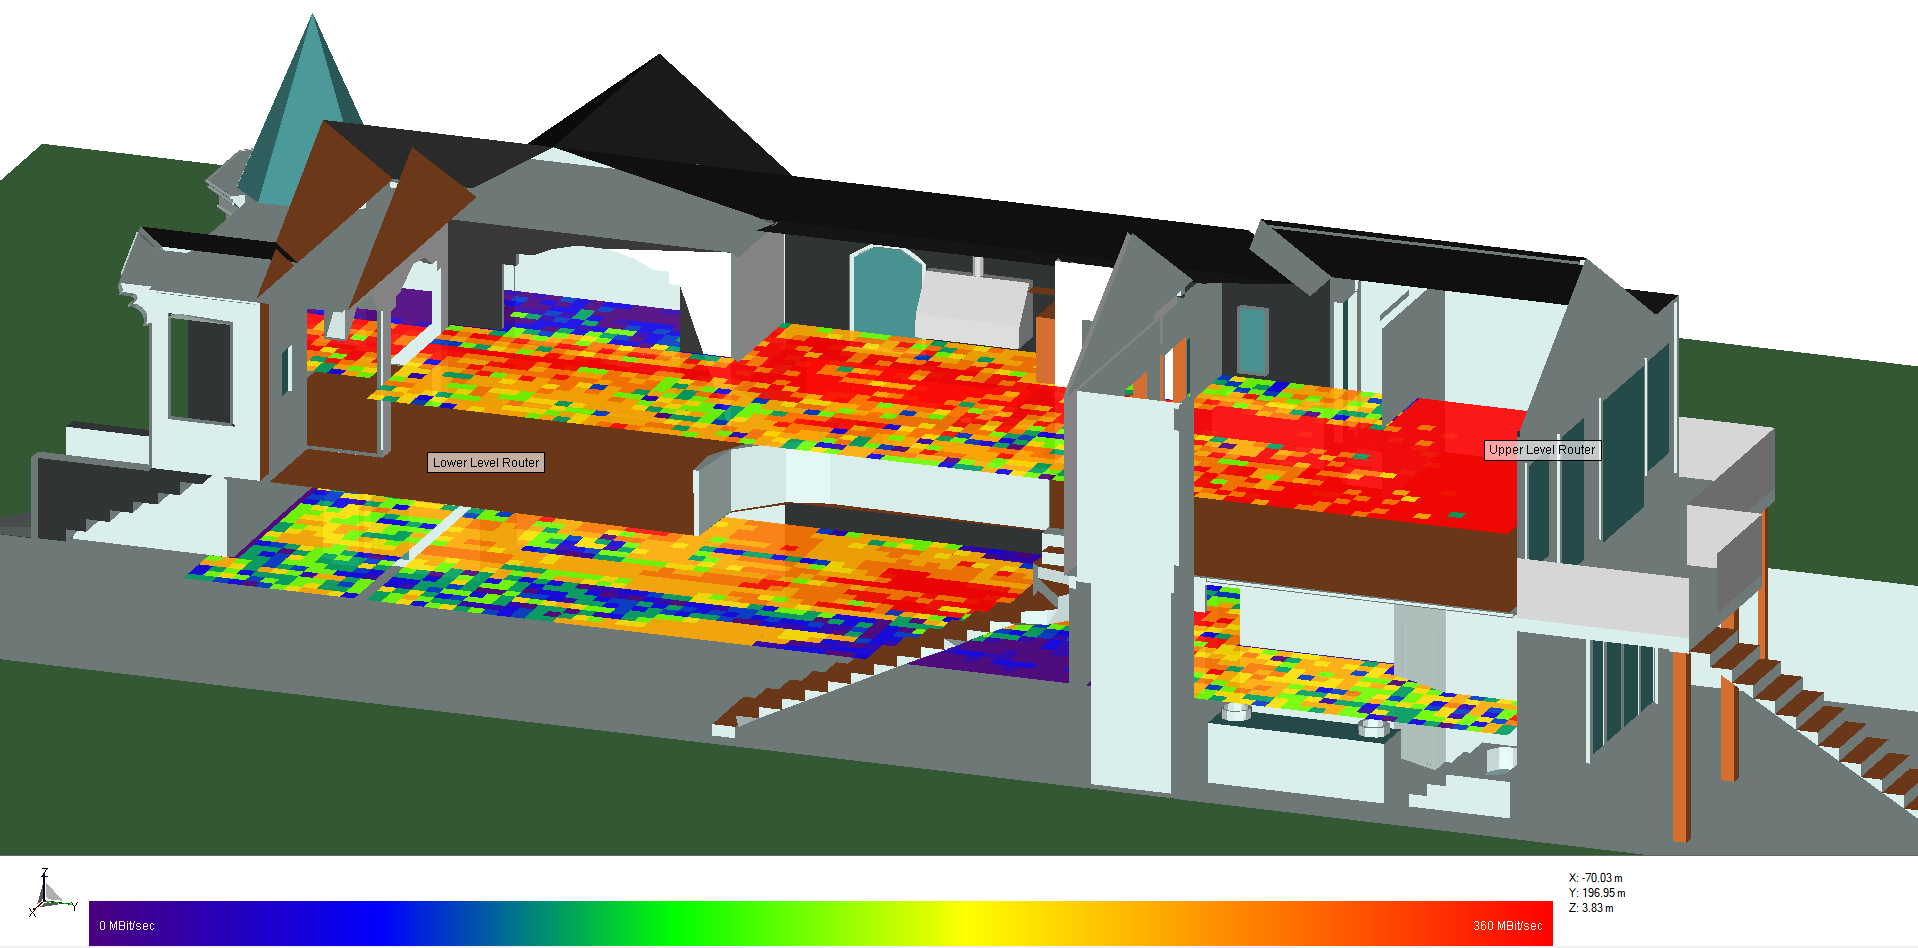
Figure 6: Throughput from upper level transmitter to the coverage grids.
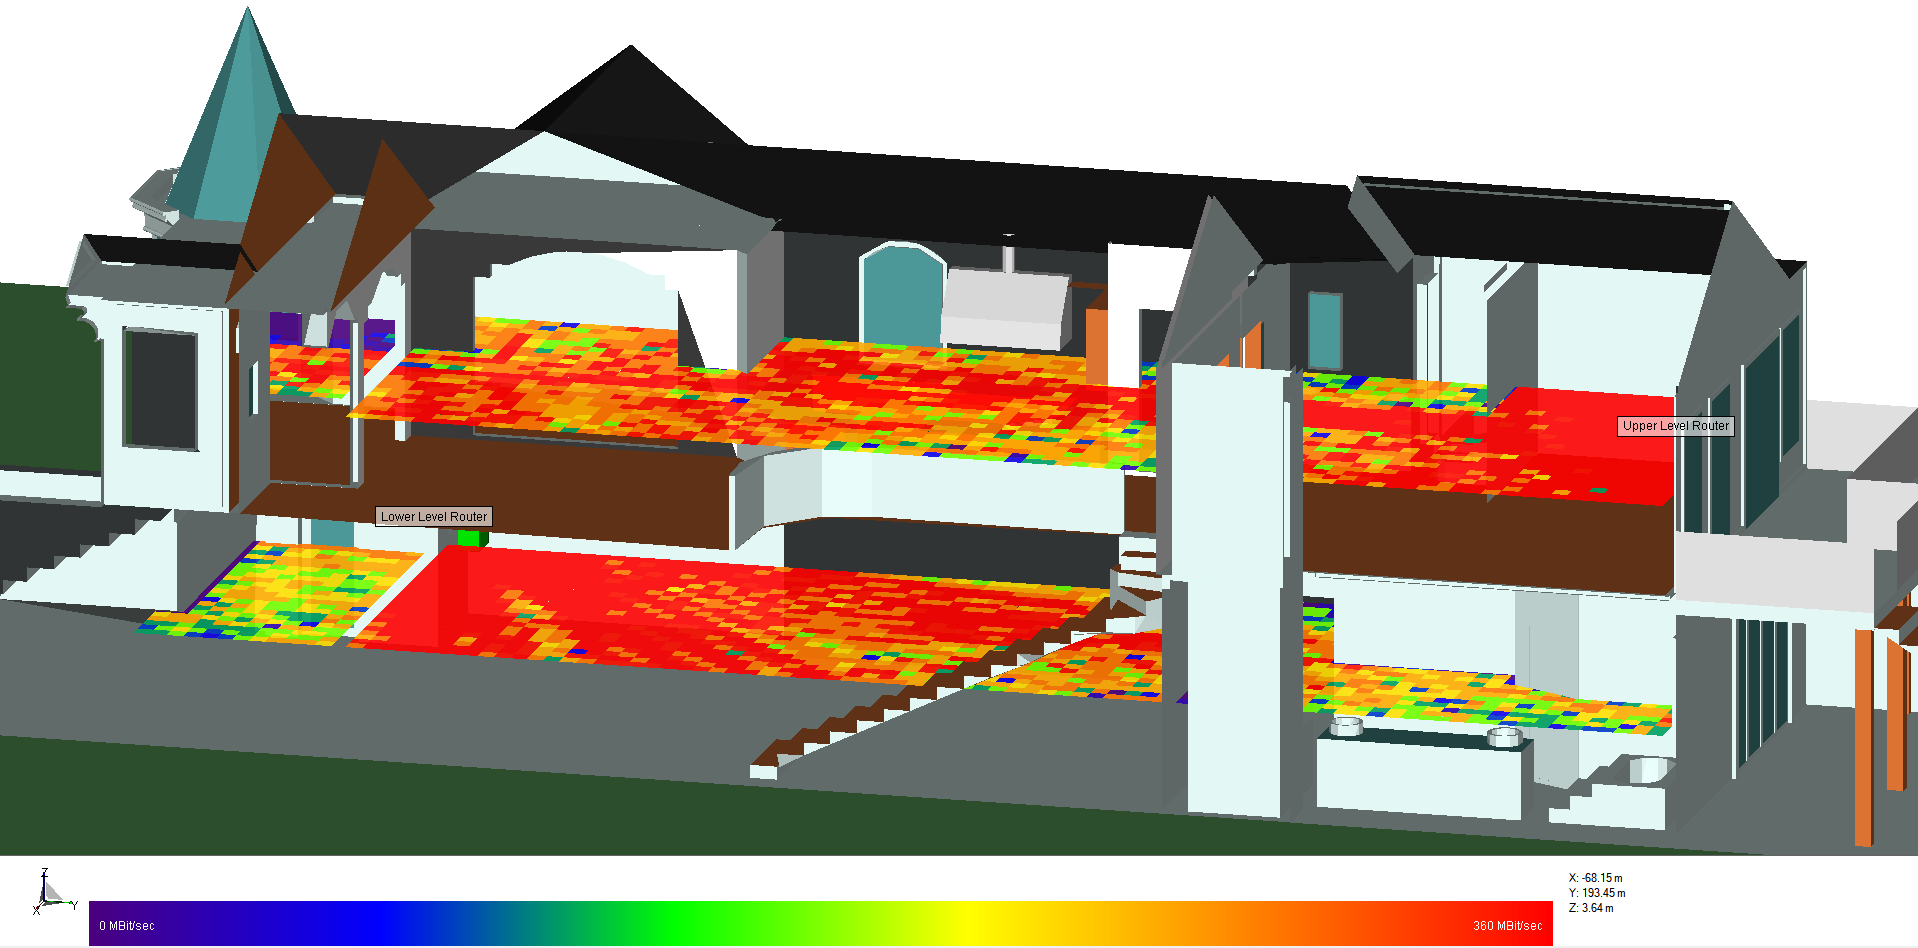
Figure 7: Combined throughput from both the lower and upper level transmitters.
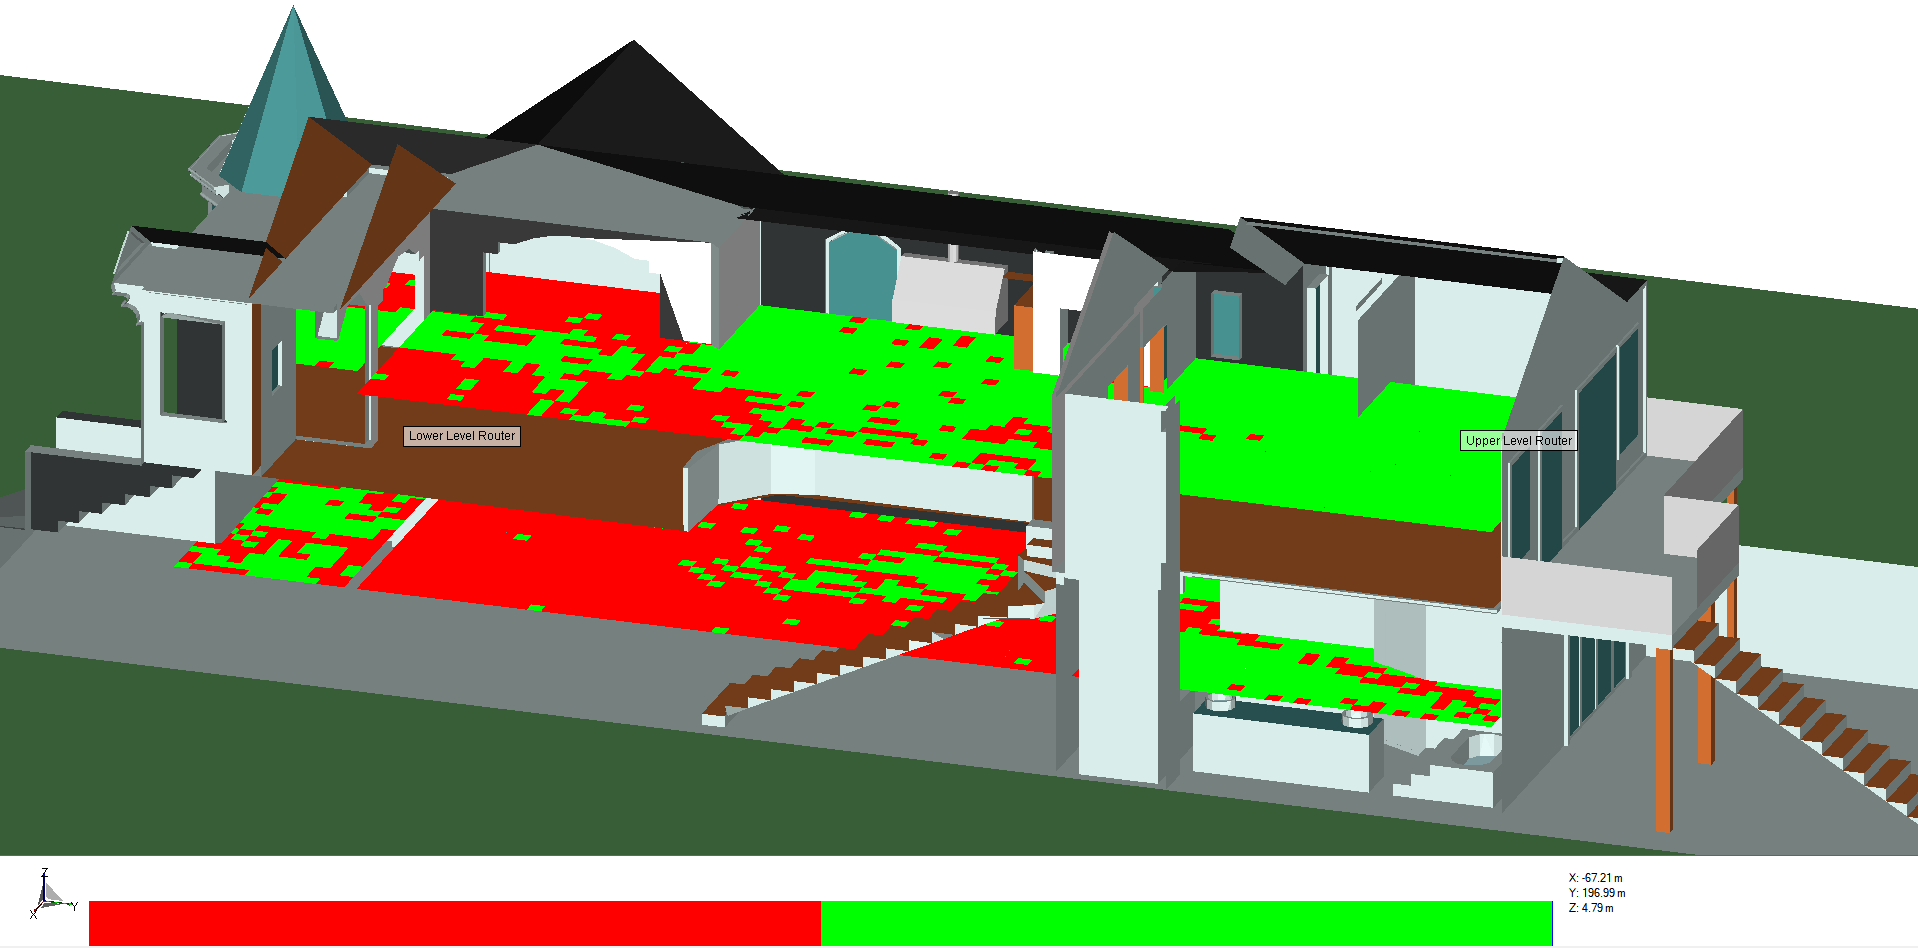
Figure 8: Identification of the router that provides the highest power to the receiver location. Red indicates the lower level transmitter and green indicates the upper level transmitter.
Channel capacity based on the Shannon-Hartley theorem is another output provided with the throughput analysis. The capacity provides an ideal maximum throughput rate that theoretically could be achieved for the SINR and bandwidth of the communication system operating in the given environment. Figure 9 shows the capacity within the house for the two transmitter system. The maximum theoretical throughput predicted by the capacity calculation is 1500 Mbit/sec, which is well above the maximum achievable rate of 390 Mbit/sec used by 802.11ac with an 80 MHz bandwidth (QAM 256, with ⅚ coding rate).
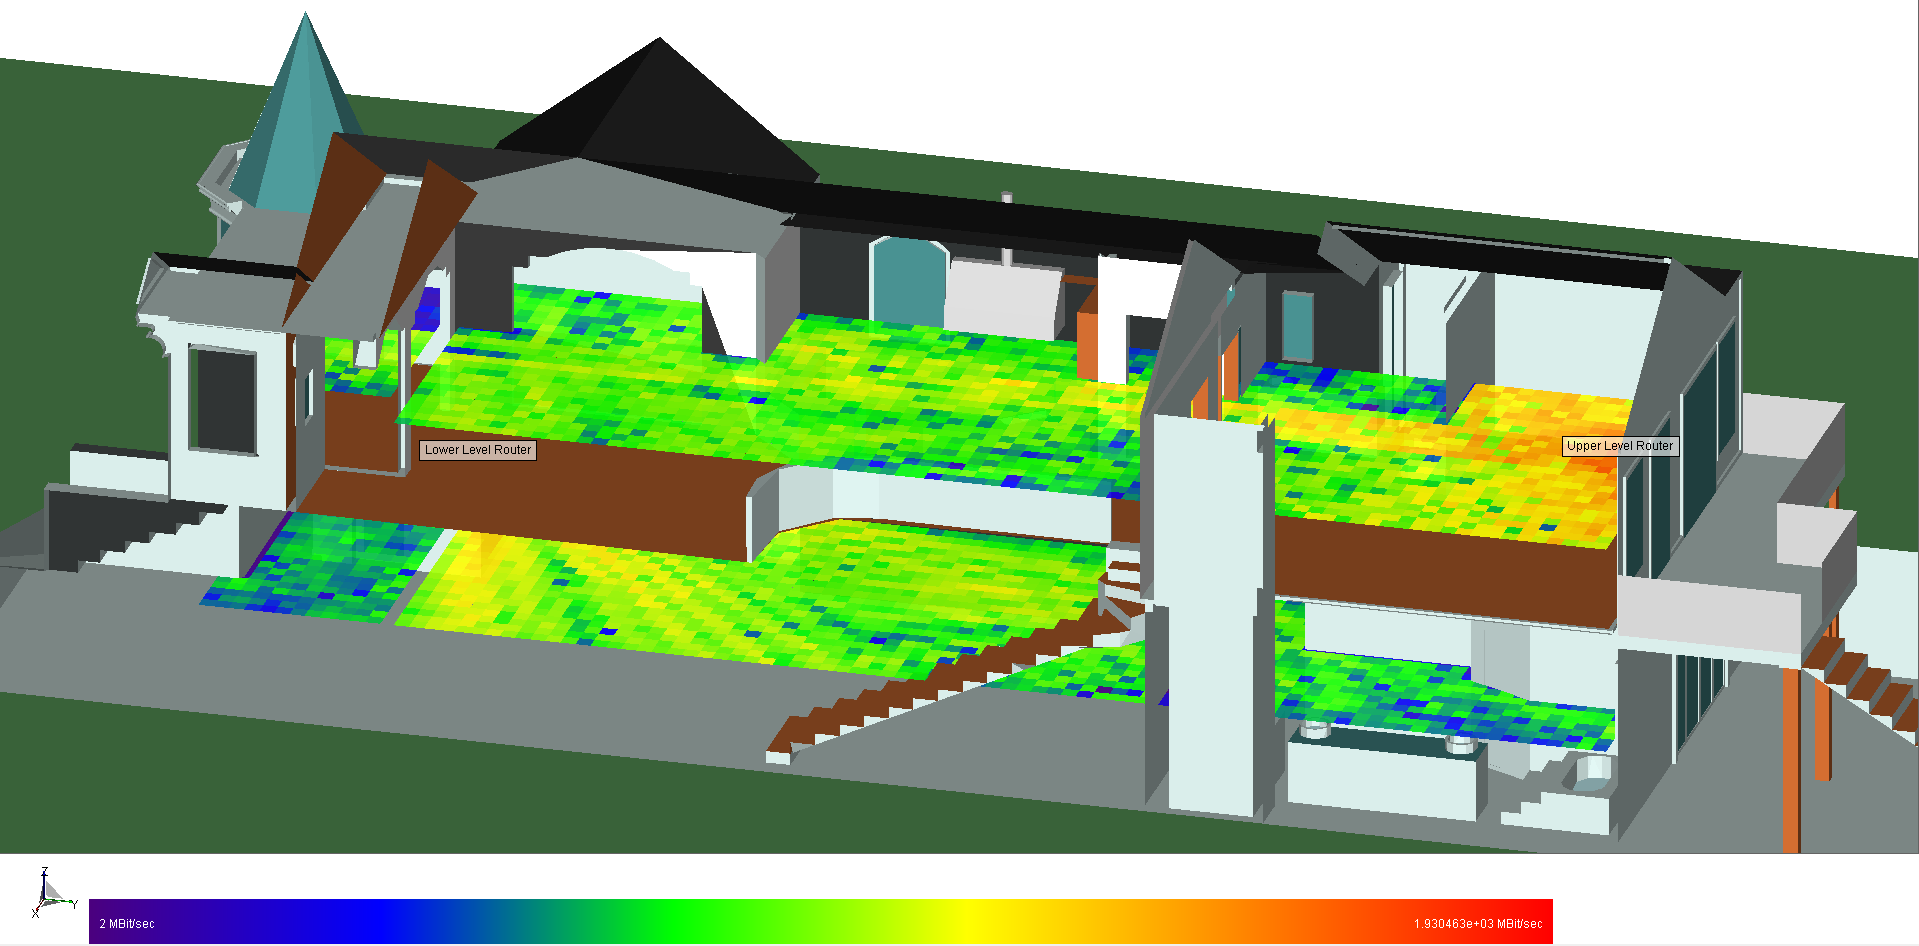
Figure 9: Channel capacity for both the upper and lower transmitters.
Throughput Cutoff
From the properties window of throughput outputs, users can enter a “Throughput Cutoff” value and display the percentage of receiver points that meet or exceed that level. This provides a useful metric for quantifying the throughput coverage for a receiver set. For instance, if a throughput rate of 200 Mbit/sec is desired, 84.90% of the receivers in the lower grid meet this criteria when both transmitting routers are included in the communication system.
Throughput cutoff rates based on the transmitter and receiver sets at 200 Mbit/sec for the house project are presented in Table 1. The communication system that uses both transmitters as base stations provides 200 MBit/sec throughput rates to 83.45% of the sampled receiver locations. Alternatively, we can also see that if only one transmitter location could be used, the location on the upper level of the house would provide the 200 MBit/sec rates to the most locations.
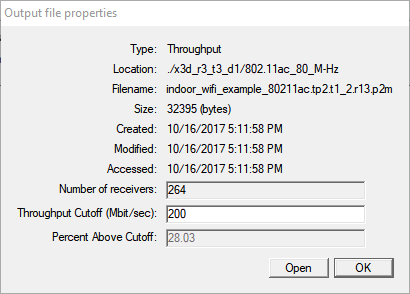
Figure 10: Throughput cutoff for combined transmitter system to the lower level receiver grid.
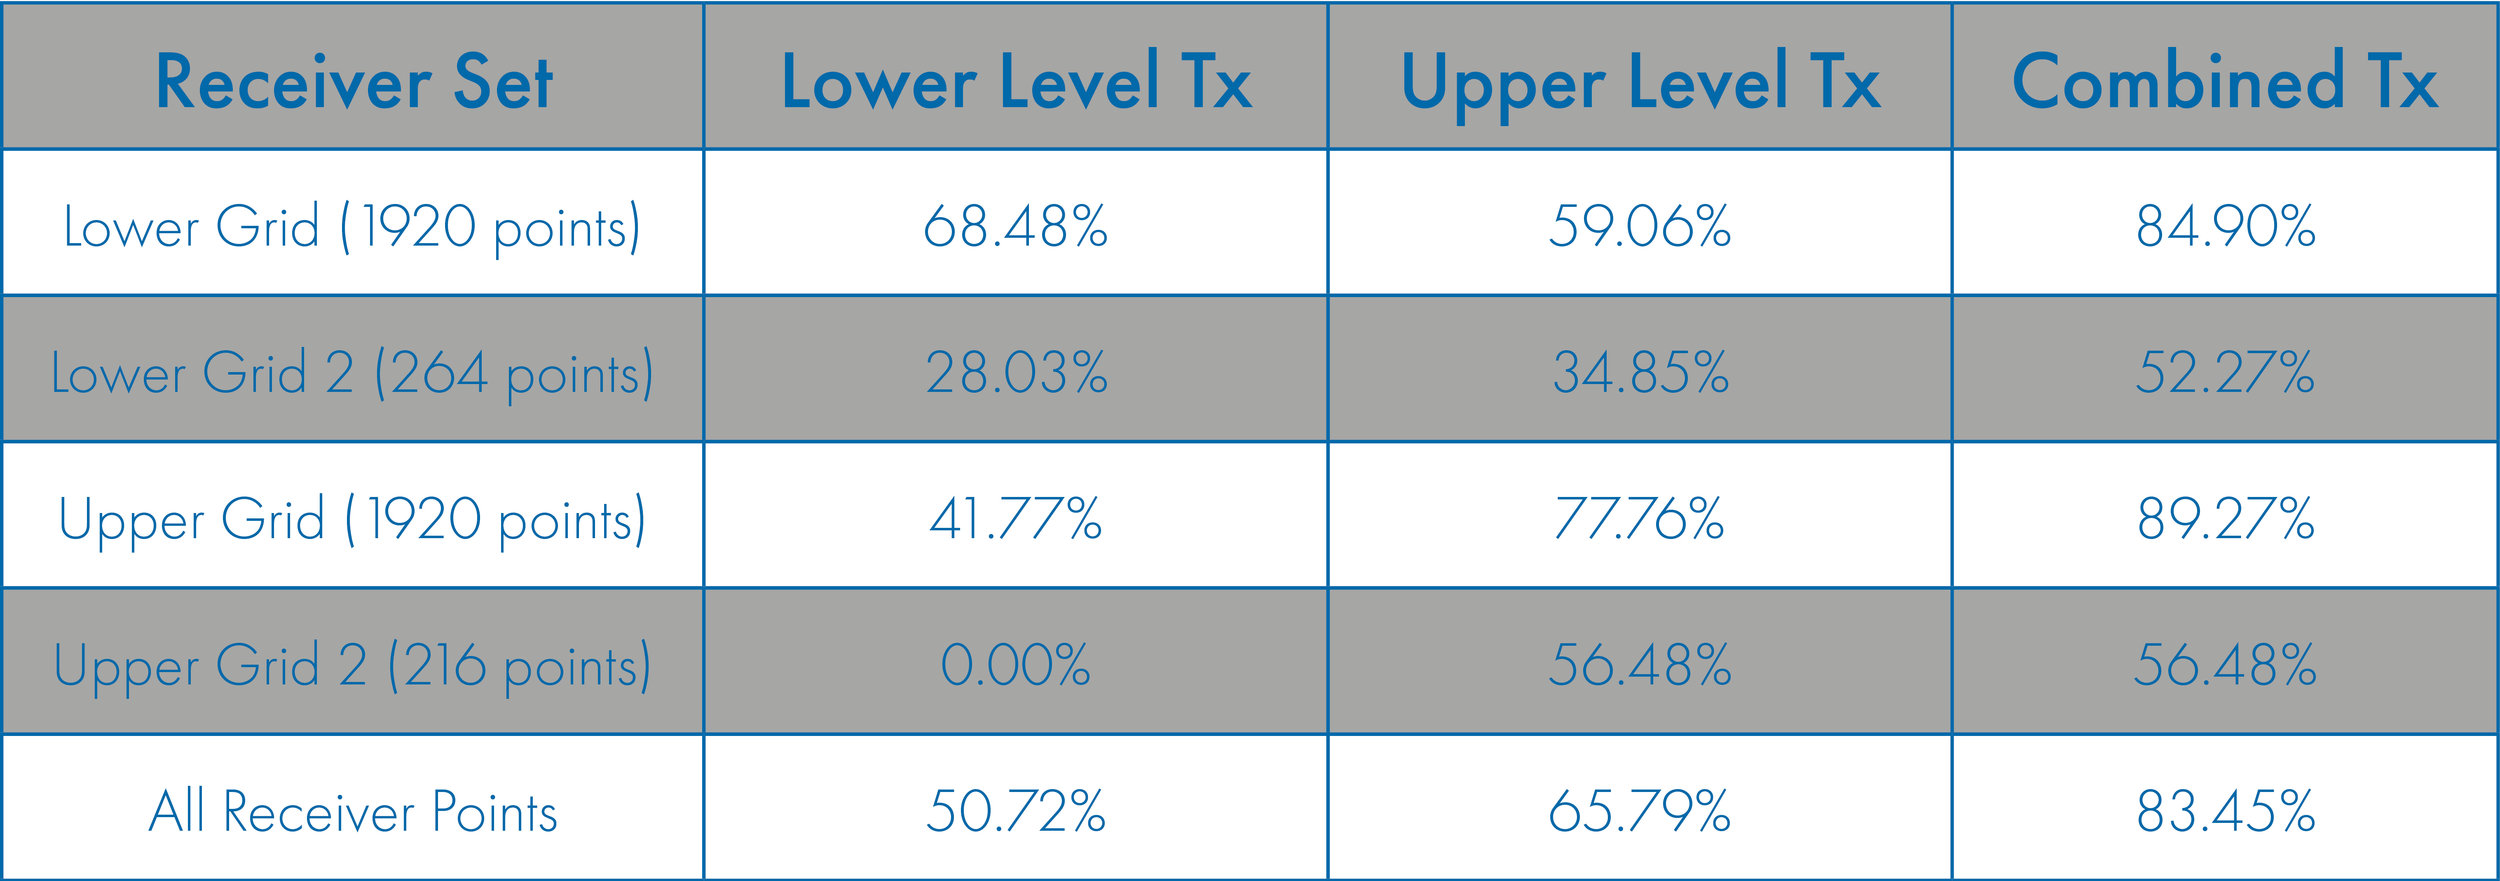
Table 1: Percentage of receiver points achieving a throughput rate for 200 Mbit/sec.
Throughput Coverage with Two Data Streams
802.11ac WiFi systems can achieve higher data rates by establishing multiple streams between the transmitting router and the receiver. To investigate the improvement in coverage, an additional communication system was created using two data streams and the results were quickly post-processed using the Run -> Comm System Analysis calculation mode. Results for two data streams are presented in Table 2. With two data streams, the overall number of receivers reaching the desired throughput rate of 200 MBit/sec increased from 83.45% to 93.20%.
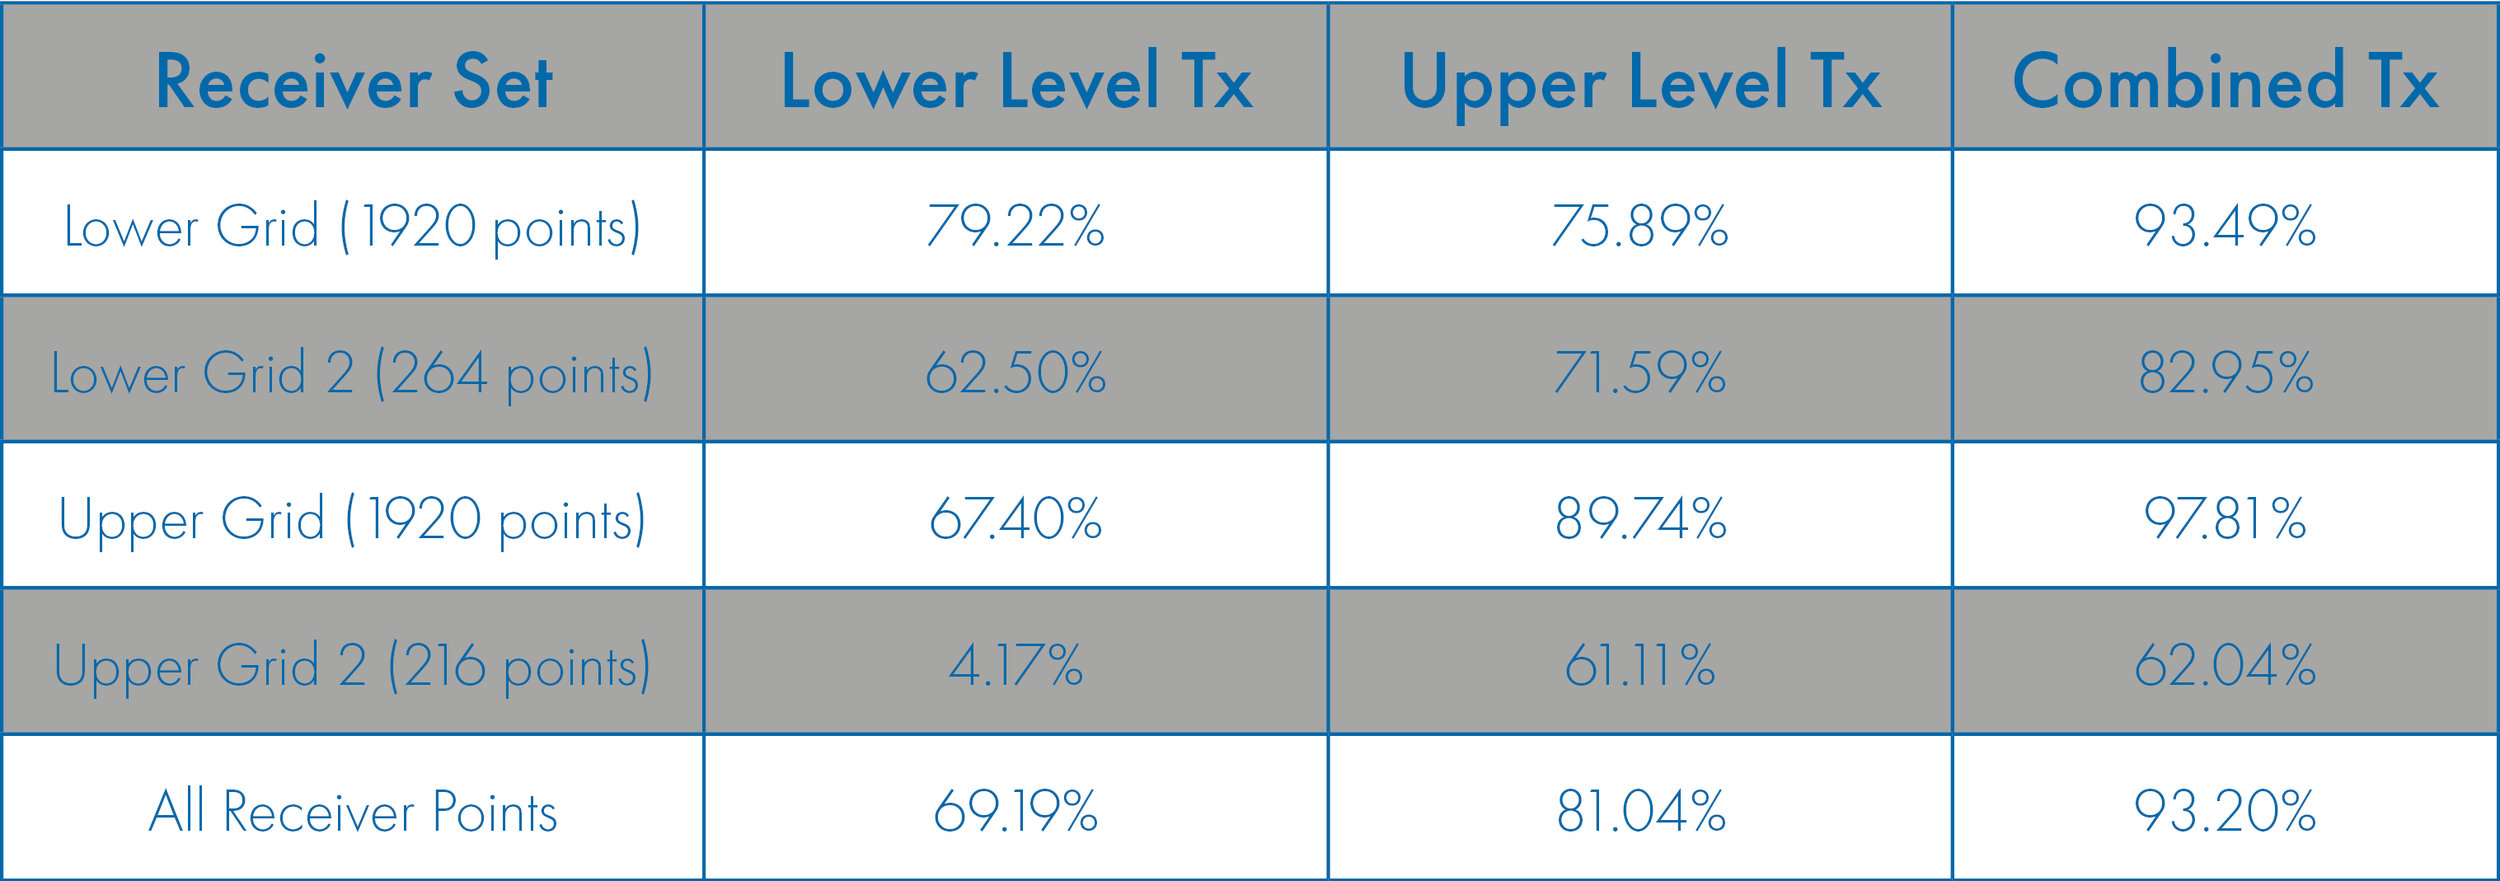
Table 2: Percentage of receiver points achieving a throughput rate for 200 Mbit/sec with two data streams
Conclusion
Wireless InSite’s Communication system analysis provides capabilities for estimating the throughput rates for LTE, WiMAX, 802.11n, and 802.11ac systems. These systems can contain multiple transmitters and receiver sets and provide users options for adjusting the noise and interference levels in the scene. The throughput cutoff method provides a single value that can used to quantify and compare competing system configurations.