Received Power and Delay Spread Comparisons in an Urban Environment
The following example illustrates Wireless InSite's ability to calculate received power and delay spread for a microcellular system located within an urban environment. Results from Wireless InSite are compared to measurements presented in [1]. The paper provides data collected during a measurement campaign carried out in downtown Helsinki, Finland. A mobile transmitter, mounted on a cart, was moved along six different routes in Helsinki. Measurements were taken at fixed receiving base stations. Locations of the transmitter routes and the base station are given in Figure 1. Collected data was arranged to provide received power vs. distance for each transmitter route.
Problem Setup
Using Wireless InSite's city editor, a model of downtown Helsinki was created from the information given in Figure 1. Building heights and additional buildings were included from information provided in [2 ,3 ]. A 3-D orthographic projection of the city model is shown in Figure 2. Because specific building materials were not given, all of the buildings were modeled as a single material type with a permittivity of 5. This is the same value used by El-Sallabi, et. al., in their numerical simulations [1].
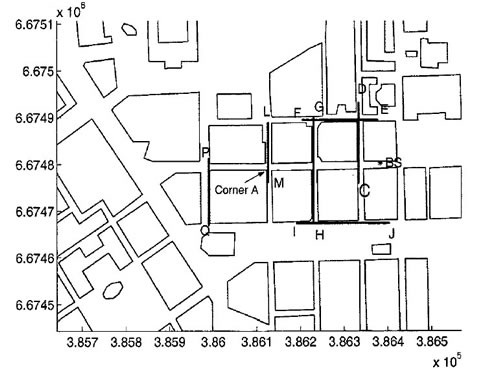
Figure 1: Map of Helsinki , Finland.
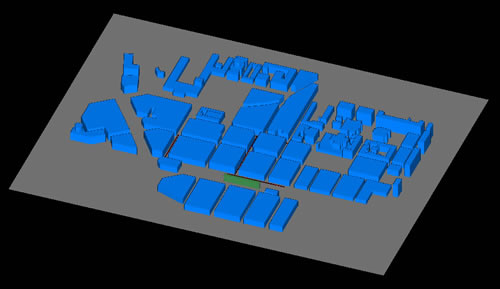
Figure 2: Wireless InSite model of downtown Helsinki.
Transmitters/Receivers
With a model of Helsinki, the locations of the transmitter and receivers can now be specified. The actual measurement campaign utilized a fixed receiver location and a mobile antenna to collect data. For simplicity, the system was modeled as having a single transmitter located at the base station and receiver routes along the paths traversed by the transmitter. Exchanging the location of the transmitter and receiver creates an analogous problem and does not affect the results of the simulation because propagation paths between any two points are independent of which point is designated as transmitter or receiver.
The locations of the base station (green dot) and receiver routes (red lines) are given in Figure 3. A vertically polarized directional antenna was used for the transmitter antenna. A 2.154 GHz sinusoid with a 100 MHz bandwidth was used as the emitted waveform. Receiver routes were modeled as vertically polarized omni-directional antennas. Figure 4 and 5 lists additional parameters used by Wireless InSite to define the transmitter and receiver's antenna patterns.
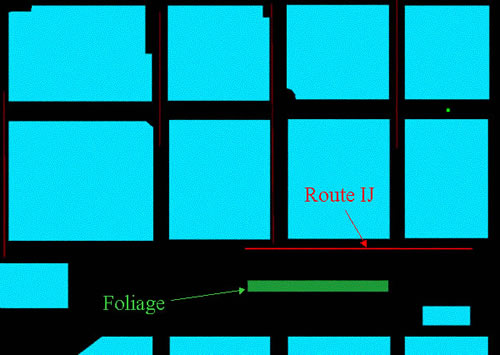
Figure 3: Receiver routes and base station locations.
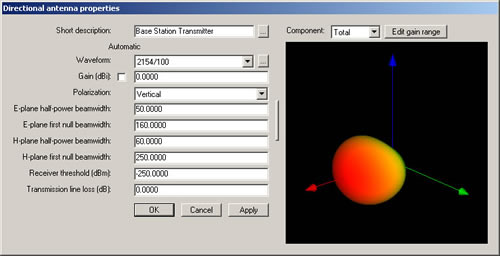
Figure 4: Antenna Description.
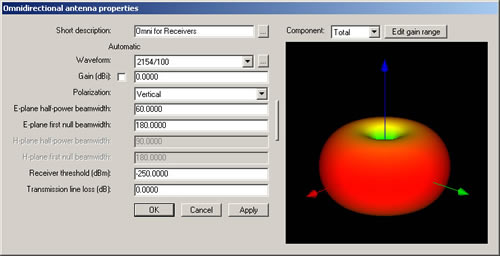
Figure 5: Receiver Antenna Description.
Signal propagation was calculated using an urban canyon model with a maximum of 10 reflections, 2 diffractions, and allowing 5 reflections between diffractions. No transmissions over the tops of buildings or through buildings were considered. This assumption is reasonable considering the relatively low heights of the transmitter (3m) and receivers (1.8m) compared to the surrounding building heights (~25 m).
Results for Perpendicular Streets – Routes CD, GH, LM, and PQ
Using Wireless InSite, received power and delay spread predictions were compared to measurements and numerical results presented in El-Sallabi's paper [1]. Red lines in the graphs represent Wireless InSite output and the black lines are the measurements. The following graphs, Figures 6-9, demonstrate Wireless InSite's ability to match measured power received on street perpendicular to the direction of the transmitting antenna. Considering the lack of specific information on building material properties and exact building locations, the results reproduce the measurements with good accuracy.
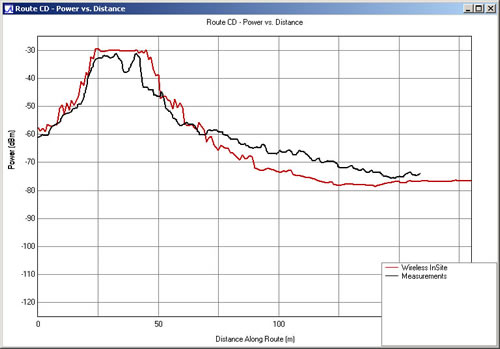
Figure 6: Received power along route CD.
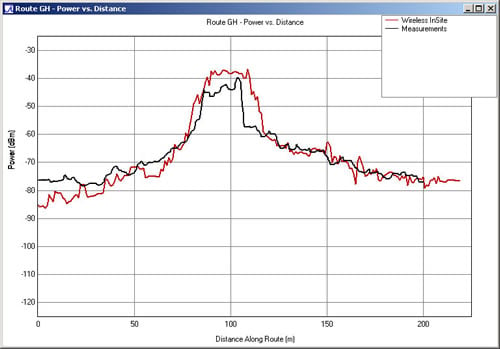
Figure 7: Received power along route GH.
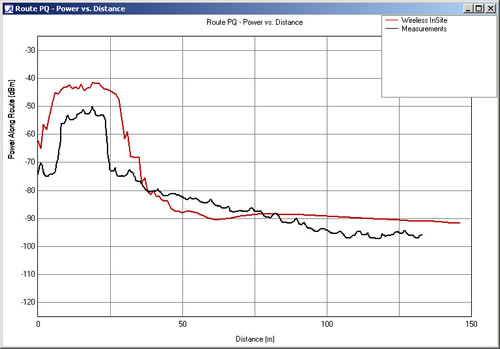
Figure 8: Received power along route LM.
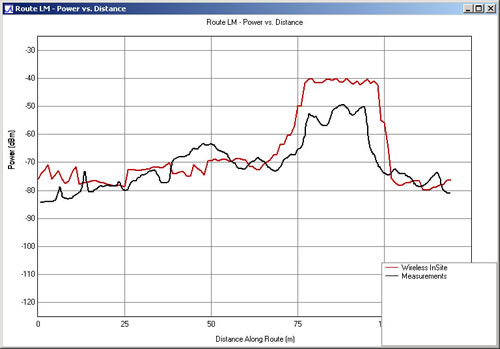
Figure 9: Received power along route PQ.
Parallel Street – Route IJ
Comparisons of Wireless InSite results route IJ which runs parallel to the directional transmitter is shown in Figure 10. Numerical results for power received for route IJ match well with the measurements with some small deviation at peak values.
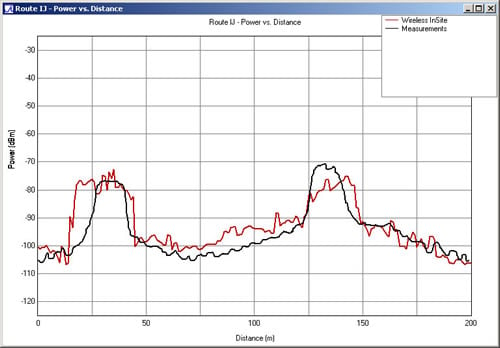
Figure 10. Received power along route IJ.
Modeling Foliage Effects on Route IJ
El-Sallabi attributed the numerical over-prediction of predicted received power along route IJ on the effects of a row of trees running parallel to the route. Wireless InSite is capable of including foliage effects in propagation models. To illustrate this ability, a foliage feature was added in the middle of the street next to route IJ (see Figure 11). The feature was 10 m wide and assigned an attenuation of 0.25 dB/meter. Including the foliage increases the agreement between InSite's results and the measurements, especially between 50-125 m. In Figure 12, the green line represents the received power taking into account the foliage, while the red is without the foliage.
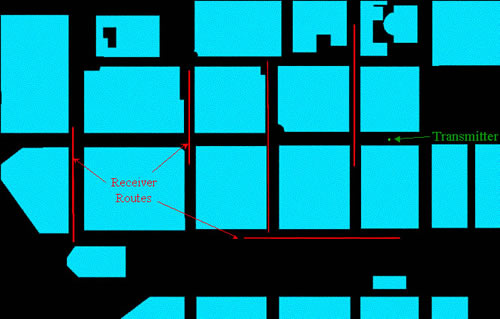
Figure 11. Foliage feature near route IJ.
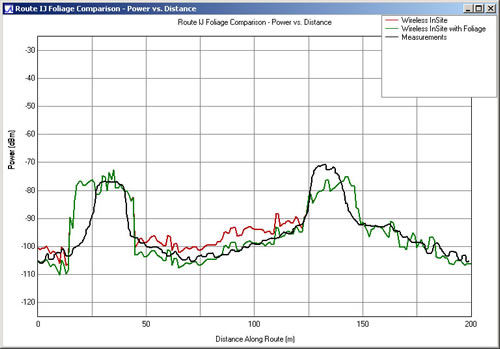
Figure 12. Received power along route IJ with foliage effects.
References
- H. M. El-Sallabi, G. Liang, H. L. Bertoni, I. T. Rekanos, and P. Vainikainen, “Influence of Diffraction Coefficient and Corner Shape on Ray Prediction of Power and Delay Spread in Urban Microcells,” IEEE Trans. Antennas Propagat., vol 50, pp. 703-712, May 2002.
- W. Zang, “Fast Two-Dimensional Diffraction Modeling for Site-Specific Propagation Prediction in Urban Microcellular Environments,” IEEE Trans. Veh. Technol., vol 49, pp. 428-436, March 2000.
- K. Kalliola, K. Sulonen, H. Laitinen, O. Kivekas, J. Krogerus, and P. Vainikainen, “Angular Power Distribution and Mean Effective Gain of Mobile Antenna in Different Propagation Environments,” IEEE Trans. Veh. Technol. , vol 51, pp. 823-838, Septemeber 2002.

