This example takes a microstrip Rotman Lens designed in Remcom’s Rotman Lens Designer (RLD) software and simulates it in full wave XFdtd making use of customized scripts and the XACT Accurate Cell Technology meshing feature. The original lens design can be found in the 16 GHz Rotman Lens Example. It is simulated first by itself and then a linear 1x16 array of patch antennas is added to the output ports of the lens for a more complete analysis. In each case the radiated pattern from the lens is compared to the array factor developed in the RLD software when optimizing the design.
Lens Alone
The lens from RLD has 7 beam ports, 16 array ports and a center frequency of 16 GHz. The lens is a microstrip design with 50 ohm system impedance and half wavelength element spacing at the output. Scripting was used to in the setup and the imported lens is shown in Figure 1 where the beam ports are at the left, the output (array) ports are at the right, and dummy ports attached to the sidewalls are on the top and bottom. When the XACT meshing feature is enabled for the lens structures, the mesh maps exactly along the curved surfaces as can be seen in the zoomed image of several of the array lines in Figure 2. For this lens, the cell size chosen is 1mm.
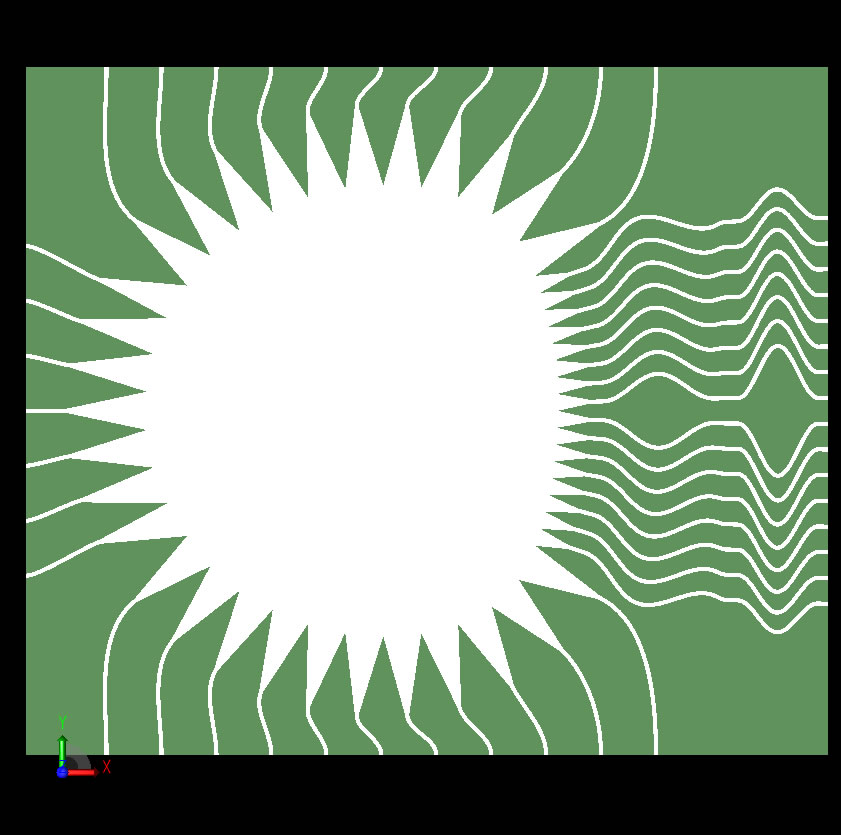
Figure 1: Imported Rotman Lens design from RLD.
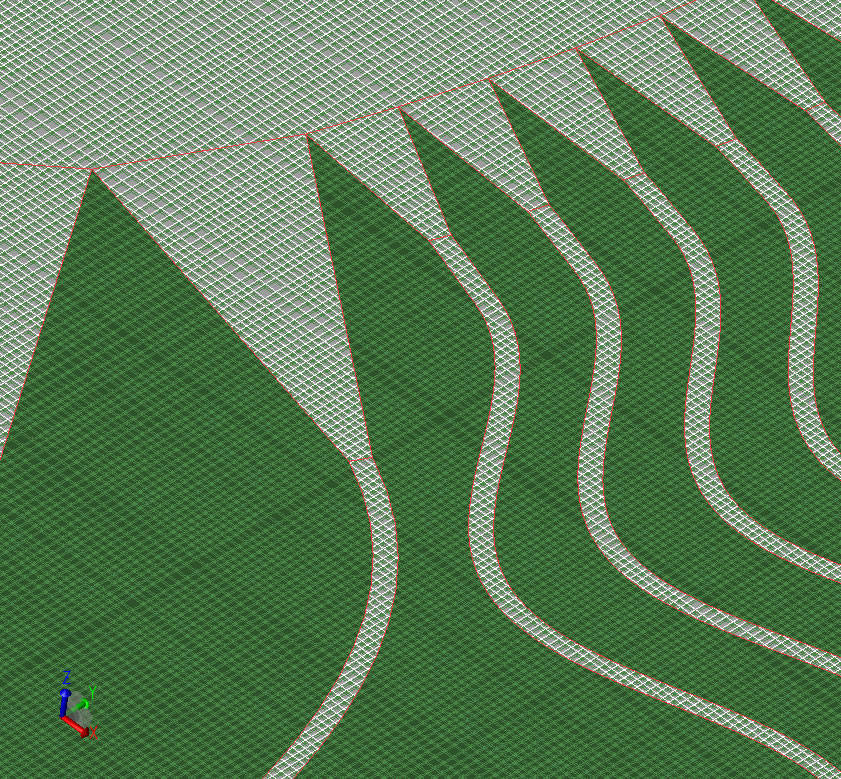
Figure 2: Mesh of lens using XACT.
The lens will first be simulated by applying a 16 GHz-centered modulated Gaussian pulse to the center beam port. This should produce a centered beam at the output. Following the simulation, the return loss at the input port is plotted versus frequency as shown in Figure 3. The array factor for the center beam of the lens, as computed by XFdtd, is compared to the array factor from the original RLD design in Figure 4. Scripting was also used to plot S-parameter magnitude and phase across the array ports at the center frequency to verify the performance of the lens. As shown in Figure 5 the output across the array ports is nearly level as expected for the center beam port active.
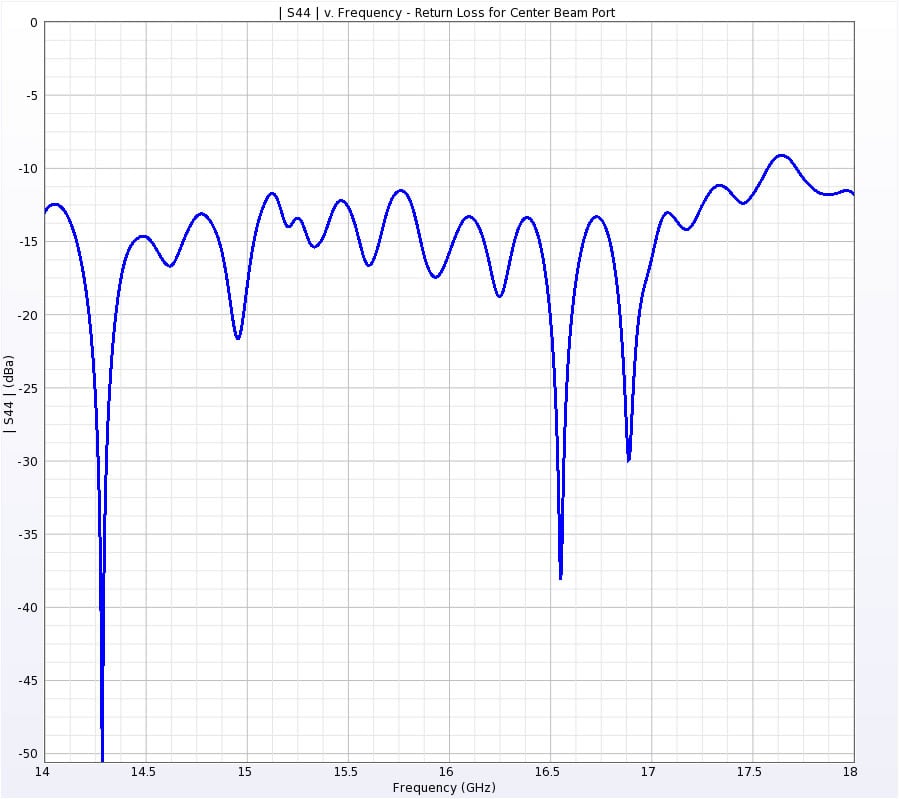
Figure 3: Return loss at active port for the center beam port active.
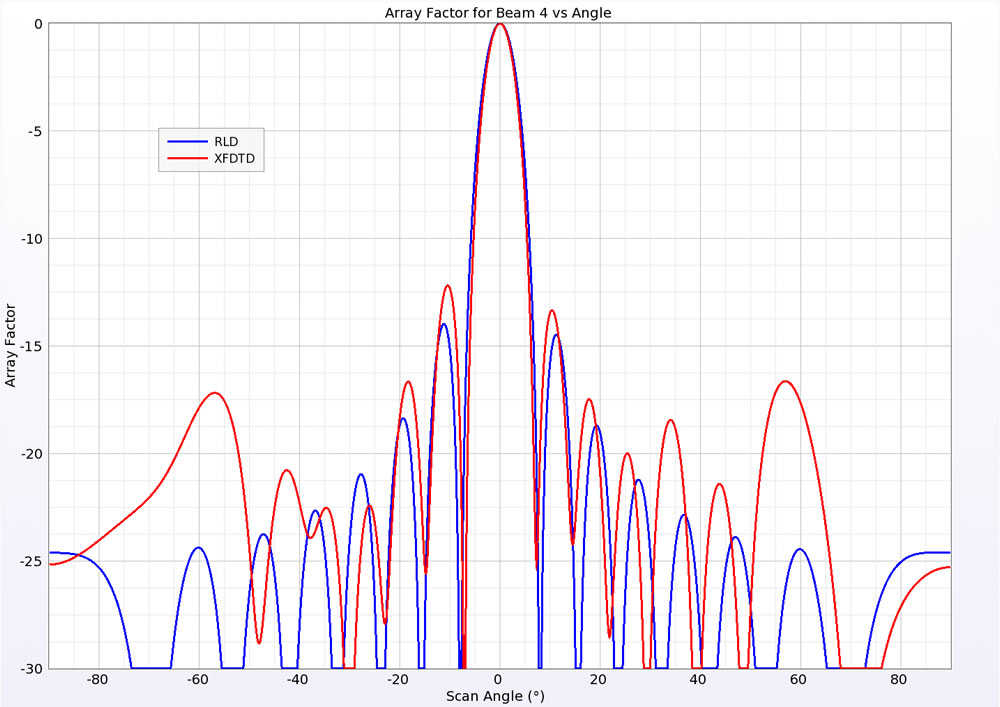
Figure 4: Array factor for the center port active.
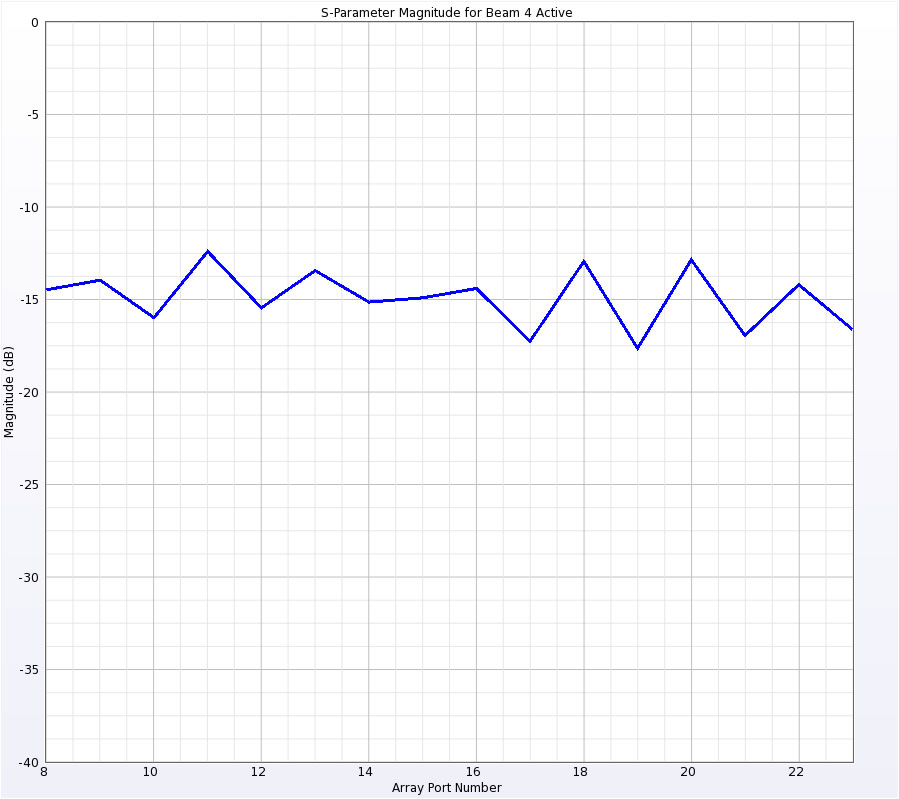
Figure 5: SParameter magnitude at each array port at the center frequency.
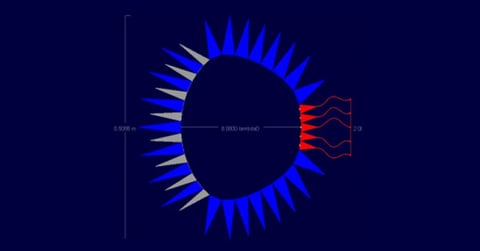
To demonstrate the scanning of the beam of the lens, a second simulation is run with the first beam port (lower left) active. In this case the beam is offset by the scan angle, 16 degrees as defined by the design, and can be seen in Figure 6. Figures 7 and 8 illustrate the difference in the conduction currents on the surface of the lens when the center (Figure 7) and lower left (Figure 8) beam ports are active. The variation in the arrival time of the fields at the output ports set up the phase shift responsible for the scanning of the beam.
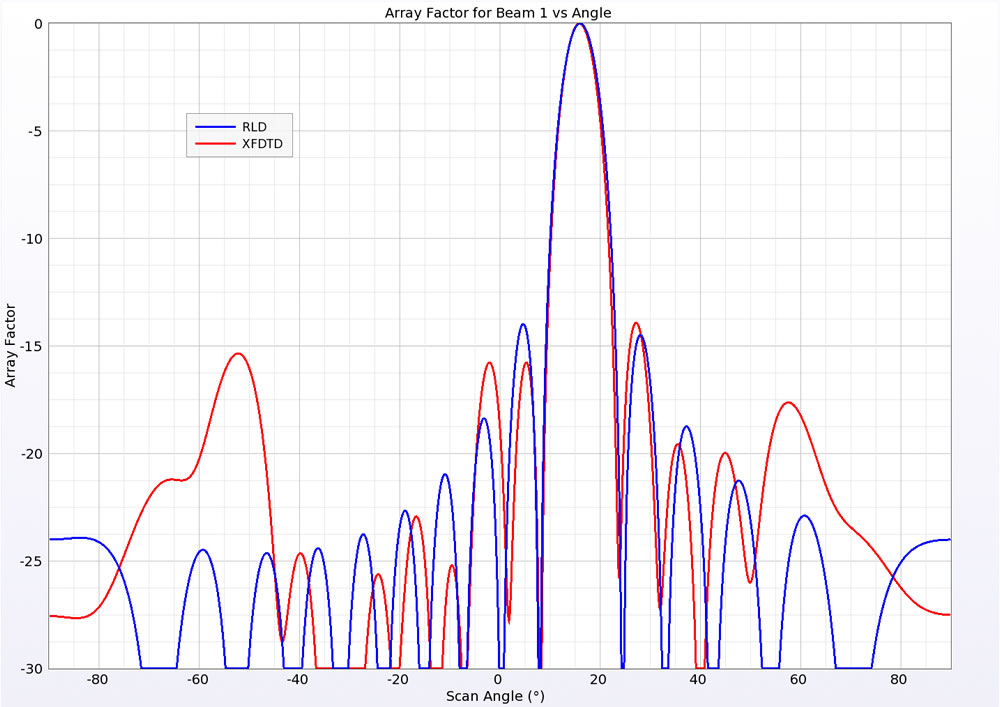
Figure 6: Array factor, with 16 degree shift, for the lower port active.
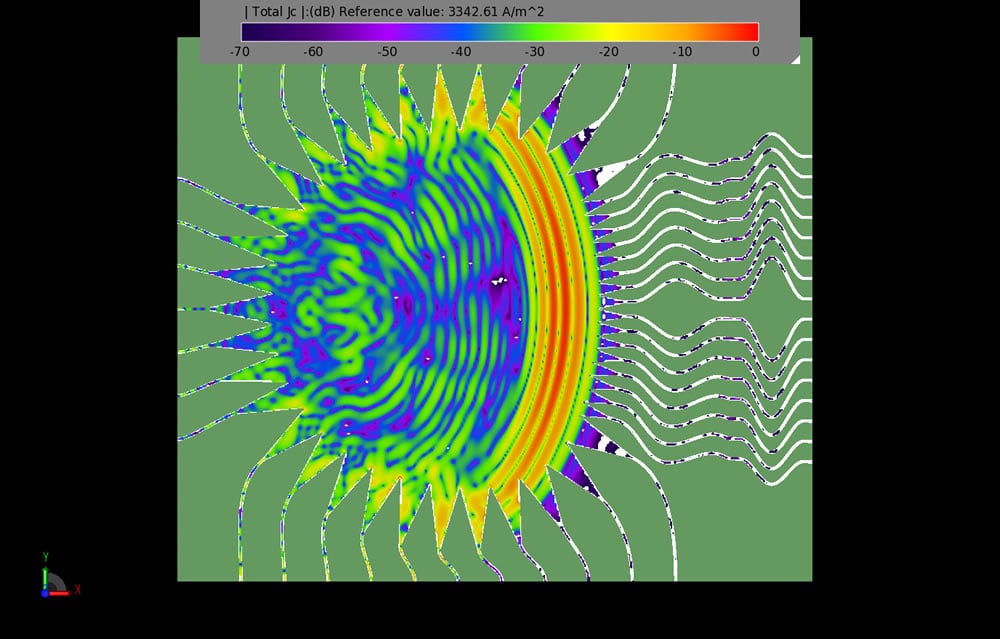
Figure 7: Time domain conduction current with Port 4 active.
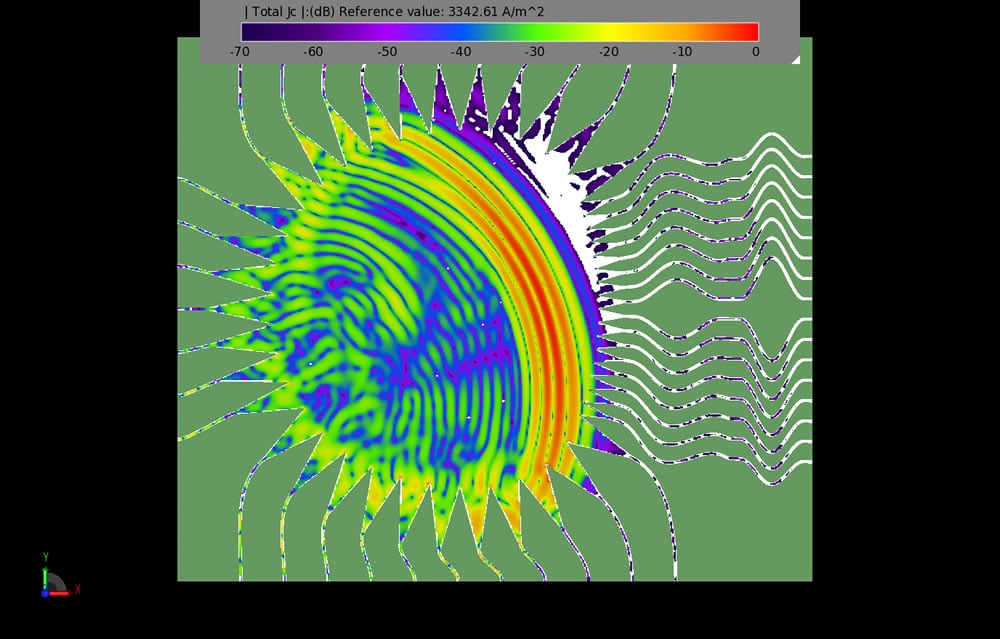
Figure 8: Time domain conduction current with Port 1 active.
Lens with 1x16 Patch Array
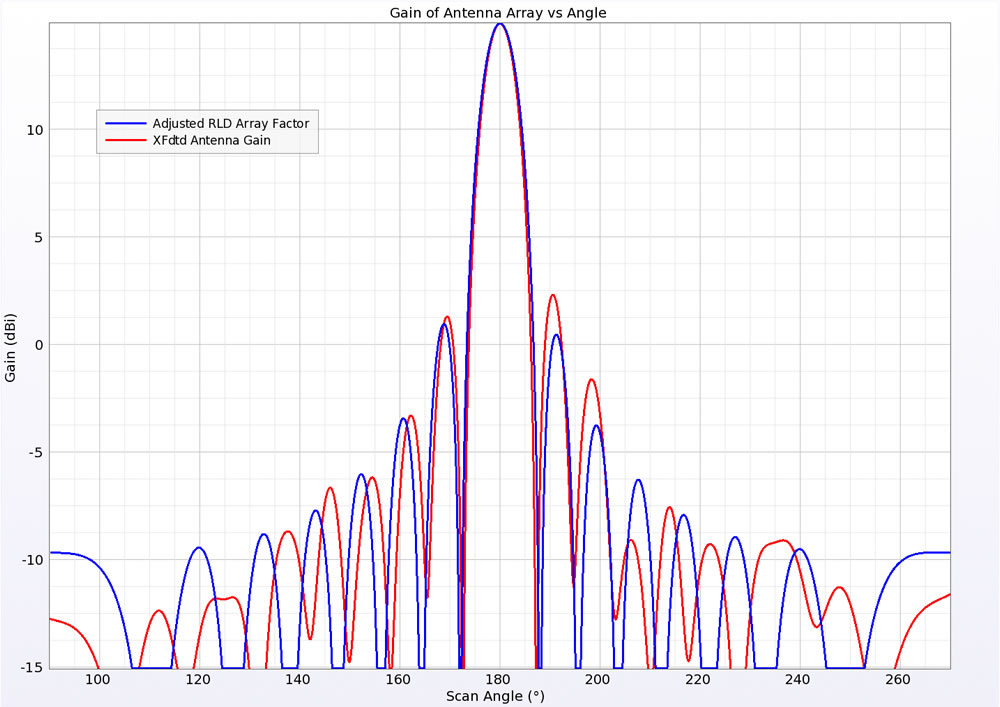
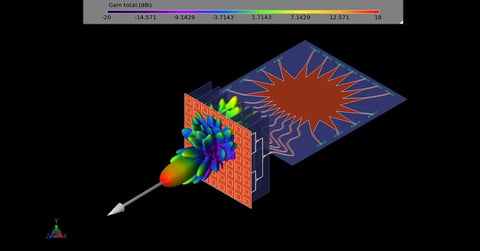
Next, a linear 1x16 array of patch antennas is added to the output of the lens. The lens geometry with the patch array attached is shown in Figure 9. Due to the complexity of the antennas, the cell size for this simulation is decreased to 0.5 mm. Following the simulation with the center beam port active, the radiation gain pattern of the patch array is plotted. This gain pattern is plotted vs. the RLD array factor in Figure 10 where the RLD gain pattern is created by adding the peak gain of the XFdtd simulation to the RLD array factor data.
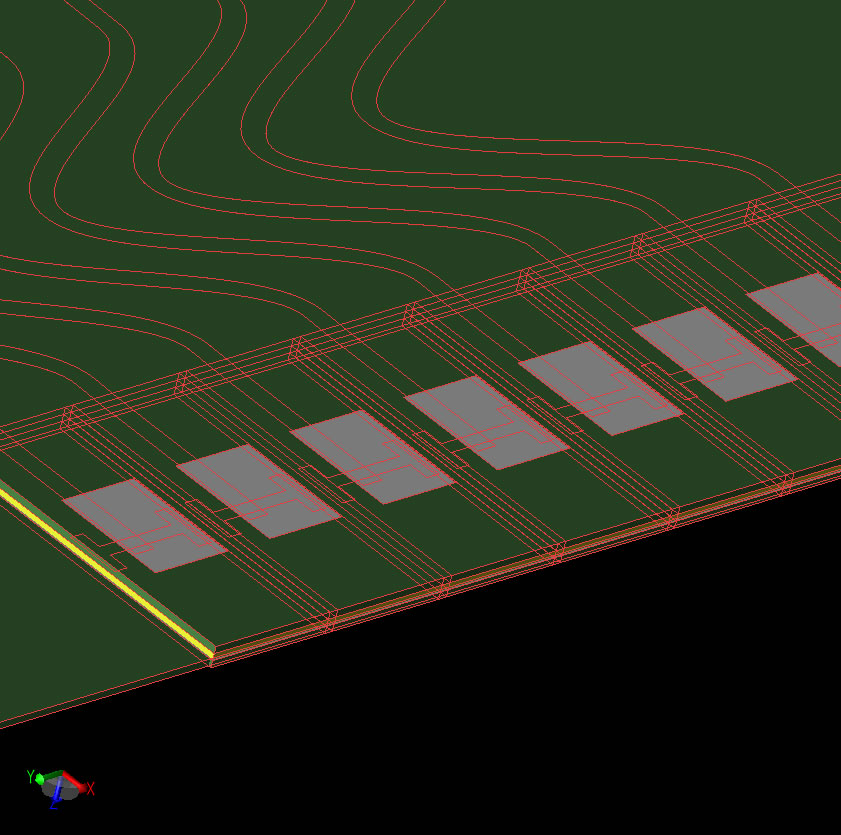
Figure 9: Geometry of lens with linear 1x16 patch antenna array.